Anisotropic self-affine properties of experimental fracture surfaces
Abstract
The scaling properties of post-mortem fracture surfaces of brittle (silica glass), ductile (aluminum alloy) and quasi-brittle (mortar and wood) materials have been investigated. These surfaces, studied far from the initiation, were shown to be self-affine. However, the Hurst exponent measured along the crack direction is found to be different from the one measured along the propagation direction. More generally, a complete description of the scaling properties of these surfaces call for the use of the 2D height-height correlation function that involves three exponents , and independent of the material considered as well as of the crack growth velocity. These exponents are shown to correspond to the roughness, growth and dynamic exponents respectively , as introduced in interface growth models. They are conjectured to be universal.
keywords:
roughening, fractal cracks:
JEL codesKAPKluwer Academic Publishers; \abbrevcompuscriptElectronically submitted article
KAPKluwer Academic Publishers; \nomencompuscriptElectronically submitted article
D24, L60, 047
1 Introduction
Since the early work of \inlineciteMandelbrot, the study of the morphology of fracture surfaces is a very active field of research. Crack surfaces were observed to display some universal scaling features although they result from a broad variety of specific processes taking place at the microstructure scale (see \openciteBouchaud4, for a review). Many experimental results suggested indeed that fracture surfaces are self-affine over a wide range of length scales In other words, the height-height correlation function computed along a given direction is found to scale as :
| (1) |
where is the Hurst exponent and the topothesy or the scale at which is equal to . This exponent was found to be weakly dependent on the nature of the material and on the fracture mode with (\openciteBouchaud9; \openciteMaloy; \openciteSchmittbuhl5; \openciteDaguier). This exponent was then conjectured to be universal (\openciteBouchaud9; \openciteMaloy).
Since the early 90s, a large amount of theoretical studies suggested scenarios to explain these experimental observations. They can be classified into two main approaches:
-
(i)
Percolation-based models where the fracture propagation is assumed to result from a damage coalescence process (\openciteRoux2; \openciteHansen). These models lead to isotropic fracture surfaces.
-
(ii)
Elastic string models that modelize the crack front as an elastic line propagating in a random medium (\openciteJPBouchaud; \openciteRamanathan; \openciteRamanathan2). The fracture surface corresponds then to the trace left by this crack front. As emphasized by \inlinecitePonson5, such approaches lead to anisotropic fracture surfaces.
All these models lead to self affine fracture surfaces, but with varying critical exponents. The relationship between these predicted exponents and the roughness exponent measured experimentally remains controversial.
We present here an extensive experimental investigation of the scaling properties of fracture surfaces in heterogeneous materials. Four different materials with four different characteristic length scales of the microstructure were investigated: silica glass, aluminum alloy, mortar and wood. They were broken using four different types of fracture tests and the fracture surfaces were scanned by three different techniques. Fracture surfaces observed in all these different materials/failure modes are shown to be self-affine, in agreement with results reported in the literature. However, their scaling properties are not isotropic as usually believed but require the use a two-dimensional (2D) height-height correlation function for a complete description.
This 2D description involves two independent scaling exponents, which are the Hurst exponents measured along the crack front direction and along the crack propagation direction. Those will be shown to correspond respectively to the roughness exponent and the growth exponent introduced to describe the depinning of elastic manifolds in a random medium (\openciteKardar2; \openciteBarabasi). To describe fully the scaling properties of the experimental fracture surfaces, a third exponent - the dynamic exponent - must be introduced. As expected for Family-Vicsek scaling [Family and Vicsek (1991)], this last exponent is shown to be equal to the ratio of the two others, .
These three exponents are found to vary little with the nature of the material and the crack propagation velocity. They are conjectured to be universal. Implications of these scaling properties will finally be discussed.
2 Description of fracture tests and surface scanning
Silica glass and aluminum alloy are archetypes of brittle and ductile materials respectively while mortar and wood are good examples of isotropic and anisotropic quasi-brittle materials respectively.
-
(a)
Silica fracture surfaces were obtained by applying a DCDC (Double Cleavage Drilled Compression) to parallelepipedic () samples under stress corrosion in mode I (see \inlinecitePrades for details). After a transient dynamic regime, the crack propagates at a slow velocity through the specimen under stress corrosion. This velocity was measured by imaging in real time the crack tip propagation through Atomic Force Microscopy (AFM). In the stress corrosion regime, the crack growth velocity can be controlled by adjusting the compressive load applied to the DCDC specimen [Bonamy et al. (2006)]. The protocol is then the following: (i) a large load is applied to reach a high velocity; (ii) the load is decreased to a value lower than the prescribed one; (iii) the load is increased again up to the value that corresponds to the prescribed velocity and kept constant. This procedure allows to observe on the post-mortem fracture surfaces constant velocity zones clearly separated by visible arrest marks. The topography of these fracture surfaces is then measured through AFM with in-plane and out-of-plane resolutions of the order of and 0.1 respectively. To ensure that there is no bias due to the scanning direction of the AFM tip, each image is scanned in two perpendicular directions and the analyses presented hereafter are performed on the two sets of images. These images represent a square field of (1024 by 1024 pixels).
-
(b)
Fracture surfaces of the commercial 7475 aluminum alloy were obtained from CT (compact tension) specimens, first precracked in fatigue and then broken under uniaxial mode I tension. In the tensile zone, the fracture surface has been observed with a scanning electron microscope at two tilt angles. A high resolution elevation map has been produced from the stereo pair using the cross-correlation based surface reconstruction technique described in \inlineciteAmman2. The reconstructed image of the topography represents a rectangular field of (512 by 512 pixels). The in-plane and out-of-plane resolutions are of the order of .
-
(c)
Mortar fracture surfaces were obtained by applying four points bending to a notched beam leading to a mode I failure. The displacement is controlled during the test. The length of the beam is 1400 mm and its height and thickness are both equal to 140 mm. The topography of the fracture surfaces has been recorded using an optical profilometer. The maps include 500 profiles of 4096 points each with the first profile close to the initial notch. The sampling step along profiles is . Two successive profiles are separated by along the direction of crack propagation. The lateral and vertical accuracy are of the order of . A transient regime is also observed by a post-mortem analysis of the fracture surfaces. On the first 10 of the crack propagation, corresponding to the first 200 profiles, the roughness of the profiles increases with the distance to the initial straight notch. A full description of the roughness in this region of the fracture surface is given in \inlineciteMourot2. The present study focuses on the geometry of the surface far from the initial notch and the first 200 profiles are therefore systematically removed from the maps.
-
(d)
Fractured wood surfaces were obtained from modified Tapered Double Cantilever Beam specimens (TDCB) subject to uniaxial tension with a constant opening rate leading to mode I failure (see \inlineciteMorel6 for details). The wood species used in the study is a Spruce (Picea excelsa W.) which is strongly anisotropic. The crack propagated along the longitudinal direction of the wood. As a result, the characteristic length scale of the elementary feature of the fracture surface is anisotropic : it is respectively of the order of a mm and of a few tenths of micrometer in the longitudinal and transverse directions. These values correspond respectively to the length and the diameter of the wood cells. As a consequence, the height of the surface has been scanned by an optical profilometer over a area with a higher resolution in the transverse direction () than in the longitudinal one () : this map includes 50 profiles parallel to the crack front with 2048 points each. As for the mortar fracture surfaces, the maps of the wood fracture surfaces correspond to the zone far from the initial straight notch where the roughness is statistically stationary, i. e. approximately 50 from initiation.
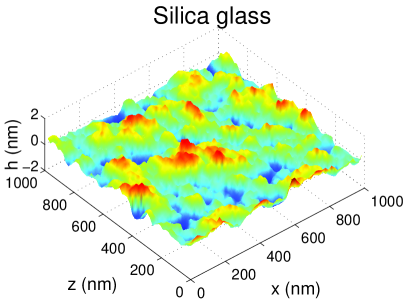
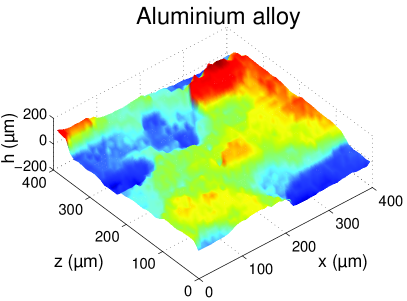
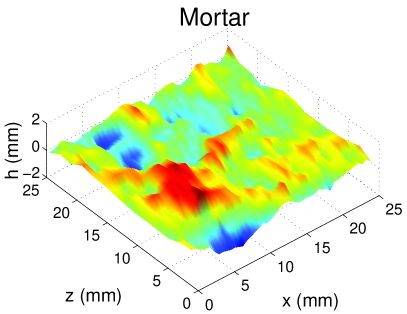
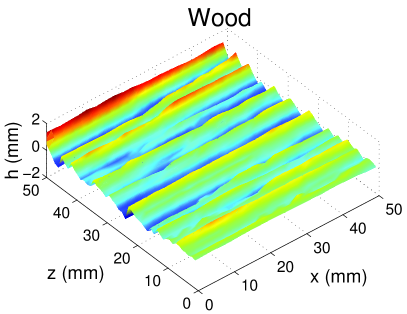
In all four cases, the reference frame is chosen so that and are respectively parallel to the direction of crack propagation and to the crack front. Figure 1 shows typical snapshots of the fracture surfaces as observed in silica glass, aluminum alloy, mortar and wood. These surfaces display striking visual differences : the in-plane (along or ) and out-of-plane (along ) length-scales of the features observed strongly depend indeed on the considered material. They are respectively of the order of 50 and 1 for the silica glass surface, approximately and for aluminum, and and 0.6 for mortar. The fracture surface in wood is highly anisotropic: The in-plane sizes of the patterns are respectively and 1 along the longitudinal (-axis) and transverse (-axis) directions and for out of plane sizes.
Despite their apparent differences, these surfaces share common scaling properties to be discussed in the next section.
3 Fracture surface analysis: Anisotropic scaling properties
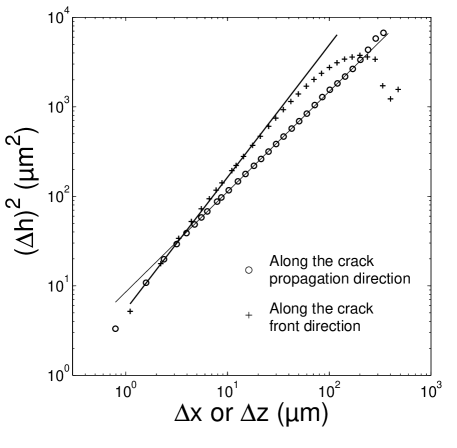
In order to investigate the anisotropy of the experimental fracture surfaces, the 1D height-height correlation functions along the direction, and along the direction were computed for each material. They are represented in Figure 2 for a fractured aluminum alloy sample.
These curves indicate a clear dependence on the measurement direction although all profiles are self affine. This anisotropy is reflected not only in the correlation lengths and in the amplitudes, but also in the values of the Hurst exponent: Along the crack front, it is found to be , i. e. fairly consistent with the ”universal” value of the roughness exponent reported in the literature (\openciteBouchaud9; \openciteMaloy; \openciteSchmittbuhl8; \openciteDaguier). Parallel to the crack front, the measured Hurst exponent is significantly smaller, with .
The observation of two different scaling behaviors in two different directions of the fractured aluminum alloy surface suggests a new approach based on the analysis of the 2D height-height correlation function defined as:
| (2) |
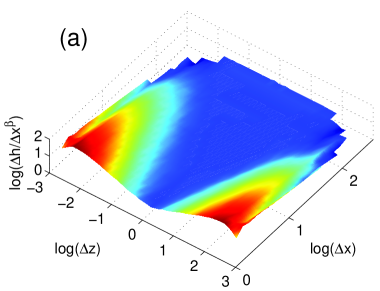
This function contains informations on the scaling properties of a surface in all directions. Figure 3a gives a color scale representation of in the () plane for the aluminum alloy. The function was normalized by and logarithmic scales were used for all the axis to emphasize the anisotropy of the power-law scalings. This representation clearly demonstrates two distinct behaviors of the 2D correlation function depending on the orientation of the vector of coordinates .
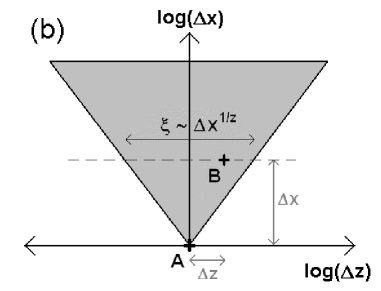
If lies inside the grey region in Figure 3b (corresponding to the blue domain in Figure 3a), the 2D correlation function scales as and does not depend on The straight boundaries of this domain in these logarithmic scales indicate that its width (Figure 3b) increases following a power law where
In other words, from any given point A of the fracture surface, a domain where the 2D correlation function scales as develops over a width increasing as (the crack propagates parallel to ). Outside of this domain, the 2D correlation function depends only on . If =0, the correlation function corresponds to that presented in Figure 2 and scales as with . The latter variation is not visible in Figure 3a because of the divergence of the normalization term
These scaling behaviors of the 2D correlation function of the aluminum fracture surface can be summed up as follows:
| (3) |
where the constant is related to the topothesies and defined along and respectively.
The variations of the correlation functions are plotted as a function of in the insets of Figure 4 respectively for silica glass, aluminum alloy, mortar and wood fracture surfaces. This Figure demontrates that the scaling properties described by Equation 3 apply for all fracture surfaces investigated experimentally. For adequate values of and , it can be seen in the main graphs of that same figure that a very good collapse of the curves can be obtained by normalizing the x-axis by and the y-axis by . As expected from Equation 3, the resulting master curve is characterized by a plateau region and followed by a power law variation of exponent . The exponents and which optimize the collapse, and the exponent determined by fitting the large scales regime exhibited by the master curves are listed in Table 1. The three exponents are found to be , and , independent of the material and of the crack growth velocity over the whole range from ultra-slow stress corrosion fracture (picometers per second) to rapid failure (some meters per second). They can therefore be conjectured to be universal.
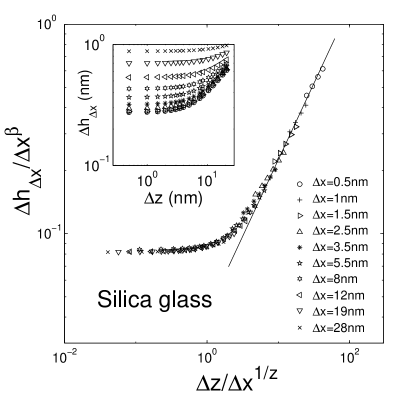
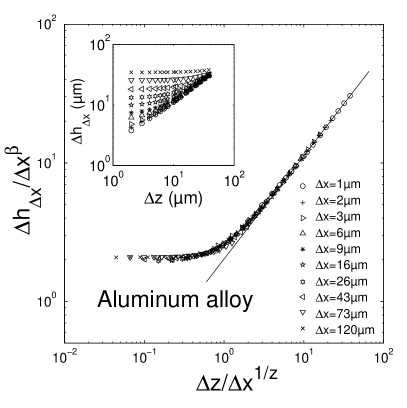
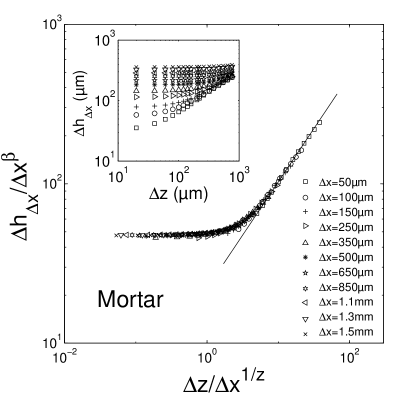
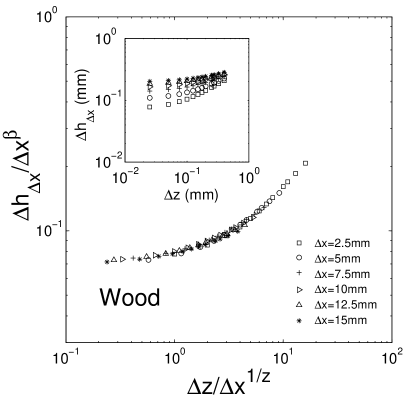
The ratio of to is given in the fourth column. It is worth noting that the exponent verifies the relation as expected for Family-Vicsek scalings (\openciteFamily) classically observed in interface growth processes.
| z | ||||
|---|---|---|---|---|
| silica glass | 0.77 0.03 | 0.61 0.04 | 1.30 0.15 | 1.26 |
| aluminum alloy | 0.75 0.03 | 0.58 0.03 | 1.26 0.07 | 1.29 |
| mortar | 0.71 0.06 | 0.59 0.06 | 1.18 0.15 | 1.20 |
| wood | 0.79 0.05 | 0.58 0.05 | 1.25 0.15 | 1.36 |
4 Discussion
Equation 3 suggests analogies with roughening in interface growth processes. In Ref. \inlinecitePonson5, surfaces were generated numerically by solving the Edwards-Wilkinson (\openciteEdwards) and the Kardar-Parisi-Zhang (\openciteKardar) equations, which describe the dynamics of an elastic line perturbed by a thermal noise. In such systems, the roughness developed from a flat profile in the transient initial regime is known to be characterized by a 1D height-height cross-correlation function with a time dependence verifying [Barabasi and Stanley (1995)]:
| (4) |
where is constant and , and refer to the roughness, growth and dynamic exponents respectively, as commonly defined in the framework of elastic manifolds propagating in a random environment. These three exponents are not independent and are related by (\openciteFamily).
In Ref.\inlinecitePonson5, the 2D height-height correlation function is computed for these simulated surfaces in the steady state regime reached at long times where the roughness becomes time invariant. It is shown that verifies the scaling Equation 3 where the exponents , and coincide with , and respectively. In other words, the ”universal” exponents , and measured on experimental fracture surfaces in the previous section correspond respectively to the roughness, growth and dynamic exponents.
Note that these results differ from those of
previous measurements in the initial transient regime which reported material-dependent dynamic exponents (\openciteSchmittbuhl2; \openciteLopez4; \openciteMorel6; \openciteMourot2). These two last studies focused on the fracture surface morphology, respectively of mortar and wood, in the roughening regime starting from a straight notch. The surfaces were found to be anisotropic and to display an anomalous scaling requiring to introduce a fourth, global roughness, exponent.
Moreover, the dynamic exponents were found to be different from those reported in the present study on the same materials and to vary from material to material. In other words, there is apparently no relationship between the exponents measured in the transient and steady state propagation regimes.
This observation is quite surprising in view of the predictions of theoretical models. In models based on elastic lines propagating in random environments, the physical mechanism which rules the time evolution of the line is not changing between the transient and the long-time regime. Hence, the exponents are found the same in the two regimes [Ponson et al. (2006)]. In experiments, we would thus expect to get also the same exponents in transient and stationary regimes. However, in quasi-brittle materials, the physical mechanisms that rule the roughening of a fracture surface developing from an initial straight notch (microcracks development, material toughness,…) is evolving with time during the transient regime. This may explain the apparent discrepancy in measured exponents.
5 Conclusion
The scaling properties of fracture surfaces of materials with different characteristic length scales of their microstructure have been investigated. Measurements were realized on brittle (amorphous silica), ductile (aluminum alloy) and quasi-brittle (mortar and wood) materials. The surfaces were studied far enough from the initiation of the crack so that the roughness distribution could be considered as stationary. It was first observed on aluminum alloy surfaces that profiles parallel and perpendicular to the direction of crack propagation were both self-affine, but corresponded to different Hurst exponents. In order to characterize such surfaces, 1D measurements such as roughness profiles are too restrictive, and the 2D height-height correlation function has been shown to be more suitable. For all types of materials investigated, the 2D correlation function displays similar scaling properties involving three exponents , and independent of the considered material as well as the crack growth velocity. They are shown to correspond respectively to the roughness, growth and dynamic exponents introduced in interface growth models. Moreover, the three exponents are not independent: as expected for Family-Viseck scaling (\openciteFamily).
The fact that and shows that scaling features of fracture surfaces result from dynamic processes. In others words, static models like percolation-based models [Hansen and Schmittbuhl (2003)] are not suitable to describe fracture surfaces in heterogeneous materials. The experimental observations reported here provide strong arguments in favor of models based on elastic manifolds moving in a random medium. As shown by \inlineciteRoux and \inlineciteRosso3 in simulations of the propagation of an elastic line in a random environment, the criticality of such a phenomenon is expected to arise only at long times. This is in perfect agreement with the experimental evidence of the existence of three universal exponents in the long time regime reported here. It should be emphasized that elastic strings models available presently don’t succeed in reproducing quantitatively the exponents observed. Work in this direction is currently under progress.
Acknowledgements.
We are indebted to J. P. Bouchaud and S. Roux for enlightening discussions.References
- Amman and Bouchaud (1998) Amman, J.J. and Bouchaud, E.: 1998, ‘Characterization of self-affine surfaces from 3D digital reconstruction’. The European Physical Journal-Applied Physics 4, 133–142.
- Barabasi and Stanley (1995) Barabasi, A.L. and Stanley, H.E.: 1995, Fractal concepts in surface growth. Cambridge University Press.
- Bonamy et al. (2006) Bonamy, D., Prades, S., Ponson L., Dalmas, D., Rountree, C.L., Bouchaud, E. and Guillot, C.: 2005, ‘Experimental investigation of damage and fracture in glassy materials at the nanometer scale’. International Journal of Product and Technology (to be published).
- Bouchaud (1997) Bouchaud, E.: 1997, ‘Scaling properties of cracks’. Journal of Physics: Condensed Matter 9, 4319–4344.
- Bouchaud et al. (1990) Bouchaud, E., Lapasset, G. and Planès, J.: 1990, ‘Fractal dimension of fractured surfaces: A universal value?’. Europhysics Letter 13.
- Bouchaud et al. (1993) Bouchaud, J.P., Bouchaud, E., Lapasset, G., and Planès, J.: 1993, ‘Models of fractal cracks’. Physical Review Letters 71, 2240–2243.
- Daguier et al. (1997) Daguier, P., Nghiem, B., Bouchaud, E. and Creuzet, F.: 1997, ‘Pinning and depinning of crack fronts in heterogeneous materials’. Physical Review Letters 78, 1062–1065.
- Edwards and Wilkinson (1982) Edwards, S.F. and Wilkinson, D.R.: 1982, ‘The surface statistics of a granular aggregate’. Proceedings of the Royal Society of London, Ser. A 381, 17.
- Family and Vicsek (1991) Family, F. and Vicsek, T.: 1991, Dynamics of fractal surfaces. World Scientific.
- Hansen and Schmittbuhl (2003) Hansen, A. and Schmittbuhl, J.: 2003, ‘Origin of the universal roughness exponent of brittle fracture surfaces: stress weighted percolation in the damage zone’. Physical Review Letters 90, 45504.
- Kardar (1998) Kardar, M.: 1998, ‘Nonequilibrium dynamics of interfaces and lines’. Physics Reports 301, 85–112.
- Kardar et al. (1986) Kardar, M., Parisi, G. and Zhang, Y.C.: 1986, ‘Dynamic scaling of growing interfaces’. Physical Review Letters 56, 889.
- Lopez and Schmittbuhl (1998) Lopez, J.M. and Schmittbuhl, J.: 1998, ‘Anomalous scaling of fracture surfaces’. Physical Review E 57, 6405–6408.
- Måløy et al. (1992) Måløy, K.J., Hansen, A., Hinrichsen, E.L. and Roux, S.: 1992, ‘Experimental measurements of the roughness of brittle cracks’. Physical Review Letters 68, 213–215.
- Mandelbrot et al. (1984) Mandelbrot, B.B., Passoja, D.E. and Paullay, A.J.: 1984, ‘Fractal character of fracture surfaces of metals’. Nature 308, 721–722.
- Morel et al. (2003) Morel, S., Mourot, G. and Schmittbuhl, J.: 2003, ‘Influence of the specimen geometry on R-curve behavior and roughening of fracture surfaces’. International Journal of Fracture 121, 23–42.
- Mourot et al. (2005) Mourot, G., Morel, S., Bouchaud, E. and Valentin, G.: 2005, ‘Anomalous scaling of mortar fracture surfaces’. Physical Review E 71, 016136–1–016136–7.
- Ponson et al. (2006) Ponson, L., Bonamy, D. and Bouchaud, E.: 2005, ‘Two-dimensional scaling properties of experimental fracture surfaces’. Physical Review Letters (to be published).
- Prades et al. (2004) Prades, S., Bonamy, D., Dalmas, D., Bouchaud, E., and Guillot, C.: 2004, ‘Nano-ductile crack propagation in glasses under stress corrosion: spatiotemporal evolution of damage in the vicinity of the crack tip’. International Journal of Solids and Structures 42, 637–645.
- Ramanathan et al. (1997) Ramanathan, S., Ertas, D., and Fisher, D. S.: 1997, ‘Quasistatic crack propagation in heterogeneous media’. Physical Review Letters 79, 873.
- Ramanathan and Fisher (1997) Ramanathan, S. and Fisher, D.S.: 1997, ‘Dynamics and instabilities of planar tensile cracks in heterogeneous media’. Physical Review Letters 79, 877.
- Rosso (2002) Rosso, A.: 2002, ‘Dépiégeage de variétés élastiques en milieu aléatoire’. Ph.D. thesis, Paris VI.
- Roux and Herrmann (1990) Roux, S. and Herrmann, H.: 1990, Statistical Models for the Fracture of Disordered Media. Elsevier.
- Roux and Vandembroucq (2002) Roux, S. and Vandembroucq, D.: 2002, ‘Depinning transition as a critical phenomenon’. International Journal of Modern Phys. B 17, 4113–4122.
- Schmittbuhl et al. (1993) Schmittbuhl, J., Gentier, S. and Roux S.: 1993, ‘Field measurements of the roughness of fault surfaces’. Geophysical Research Letters 20, 639–641.
- Schmittbuhl et al. (1994) Schmittbuhl, J., Roux, S. and Berthaud, Y.: 1994, ‘Development of roughness in crack propagation’. Europhysics letters 28, 585–590.
- Schmittbuhl et al. (1995) Schmittbuhl, J., Schmitt, F. and Scholz, C.: 1995, ‘Scaling invariance of crack surfaces’. Journal of Geophysical Research 100, 5953–5973.