In-plane anisotropy of spin excitations in the normal and superconducting states of underdoped YBa2Cu3O6+x
Abstract
A detailed inelastic neutron scattering study of the in-plane anisotropy of magnetic excitations in twin-free YBa2Cu3O6.6 ( 61 K) reveals that the spin excitation spectra in the superconducting and normal states are qualitatively different. Below , the spectrum consists of upward- and downward-dispersing branches with modest in-plane anisotropy merging at an energy 37.5 meV. In the normal state, the singularity at disappears, and the spectrum exhibits a steep dispersion with a strongly anisotropic in-plane geometry. These data have important implications for models based on static or dynamic “stripe” order of spins and charges.
pacs:
74.25.Ha, 74.72.Bk, 78.70.NxA variety of different states with unusual spin, charge, or current correlations have been invoked to explain the anomalous normal-state (NS) properties of underdoped copper-oxide superconductors. Prominent examples are “striped” states with spin and charge order extending along one of the principal axes of the CuO2 square lattice. Neutron scattering experiments yield detailed information about the microscopic magnetic order and dynamics and can thus serve as particularly incisive tests of microscopic models of the copper oxides. Recent neutron scattering work on and YBa2Cu3O6+x has uncovered tantalizing evidence of a “universal” spin excitation spectrum independent of materials-specific details Pai04 ; Chr04 ; Tra04 ; Hay04 ; Rez04 . The dispersion surface of the spin excitations comprises upward- and downward-dispersing excitation branches merging at the wave vector Q characterizing antiferromagnetic order in the undoped parent compounds. The full spectrum thus resembles an “hour glass” in energy-momentum space.
Some features of this spectrum agree with calculations for a specific stripe model, according to which nonmagnetic charge stripes separate a set of weakly coupled spin ladders in the copper oxide layers Uhr04 ; Voj04 ; Sei05 . A key prediction of these models is a pronounced in-plane anisotropy of the magnetic spectrum. This prediction can, in principle, be tested if a crystallographically unique in-plane axis pins the stripe propagation vector. In YBa2Cu3O6+x for instance, the CuO chains along the -axis define such a direction. In practice, however, crystallographic twinning (that is, the formation of micron-scale domains in which - and -axes are interchanged) limits our ability to extract information about the in-plane anisotropy from data on the large specimens typically used for neutron scattering Ara99 ; Fon00 ; Dai01 ; Sto04 ; Sto05 . In a recent neutron scattering study of arrays of small, twin-free YBa2Cu3O6+x single crystals with x = 0.85 and 0.6, we have provided detailed information about the in-plane anisotropy of the dynamical spin susceptibility in the superconducting (SC) state at low energies Hin04 . The results disagree with the predictions of the static stripe model and have stimulated calculations based on fluctuating stripe arrays Voj05 .
However, whereas the neutron data were taken in the SC state, none of the stripe models consider the presence of superconductivity. In order to provide stringent experimental constraints for theories based on fluctuating stripes, as well as competing theories based on anisotropic Fermi liquids and spiral states Yam00 ; Ere05 ; Zho04 ; Lin05 , we have carried out experiments on the spin dynamics in the normal state of twin-free YBa2Cu3O6.6. Previous work on twinned samples was unable to resolve the in-plane anisotropy in the normal state, and the results appeared to indicate that the NS spin excitation spectrum is simply a broadened version of the spectrum in the SC state Dai99 ; Sto04 . Our new data now show that both spectra are in fact qualitatively different. Specifically, the singularity at , which gives rise to the characteristic “hour glass” shape of the spectrum, disappears in the NS, and the spectrum exhibits an unusually steep dispersion with marked in-plane anisotropy. The low-energy spectral weight is strongly reduced upon heating above a characteristic temperature K. These results will be discussed in the light of recent theoretical work.
The experiments were performed on an array of 180 individually detwinned YBa2Cu3O6.6 samples with superconducting transition temperatures (midpoint) of K and width K. The crystals were co-aligned on three Al-plates with a mosaicity of . The volume of the entire array was mm3, and the twin domain population ratio was 94:6. Measurements were performed at the IN8 spectrometer at the Institut Laue Langevin (Grenoble, France) and the 2T spectrometer at the Laboratoire Léon Brillouin (Saclay, France). Scans along a∗ and b∗ were carried out under identical instrumental resolution conditions by working in two different Brillouin zones. No collimators were used in order to maximize the neutron flux, and graphite filters extinguished higher order contamination of the neutron beam.
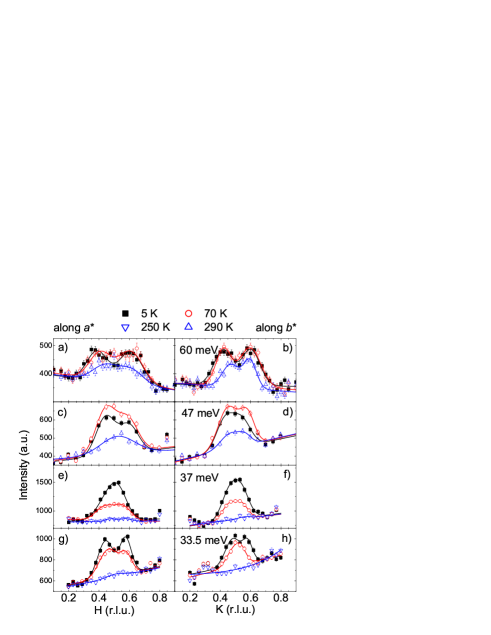
Fig. 1 shows representative raw data in three temperature regimes: deep inside the SC state at 5 K, just above at 70 K, and at room temperature. The incommensurability (that is, the deviation of the peak position from ) and the spectral weight of the constant-energy cuts are generally different in the two in-plane directions in reciprocal space, and , rlu and show a complex dependence upon energy and temperature. A synopsis of the entire data set is shown in Fig. 2 at two temperatures above and below . In the following we will discuss the salient features of the spectrum and its temperature evolution by referring to Fig. 2 for overall trends, and to Fig. 1 for more subtle details.
The central result of this paper is the change of the topology of the dispersion surface from the SC to the normal state. First, we focus on the spectrum deep in the SC state (Fig. 1, 5 K). Starting from low excitation energies, first decreases with increasing energy, so that the IC peaks merge at Q at an energy of meV. For , increases again, so that the spectrum forms the “hour-glass” dispersion (Fig. 2) already familiar from previous work Bou00 ; Hay04 ; Tra04 ; Rez04 . In the NS, however, the singularity at is no longer present, and the incommensurability is only weakly energy-dependent over a wide energy range including (Fig. 2c,d). As a consequence, the NS spectrum no longer shows the “hour glass” shape that is characteristic of the magnetic spectrum below , and that has been the subject of much recent debate. This constitutes a qualitative difference of the spectra in the SC and normal states.
A second major difference between the SC and normal states is manifested in the in-plane anisotropy. In the SC state, the dispersion is found to be steeper along b∗, the direction of the CuO chains (Fig. 1). The in-plane spectral weight is moderately anisotropic for , that is, the peak intensity of cuts along a∗ is higher than that along b∗. As pointed out before Hin04 , the anisotropy decreases with increasing energy approaching . A new aspect revealed by the data in Fig. 1 is that for the spectral weight anisotropy disappears within the experimental sensitivity. Apart from the slight difference in along the two in-plane directions, the spectrum is thus fully two-dimensional at high energies.
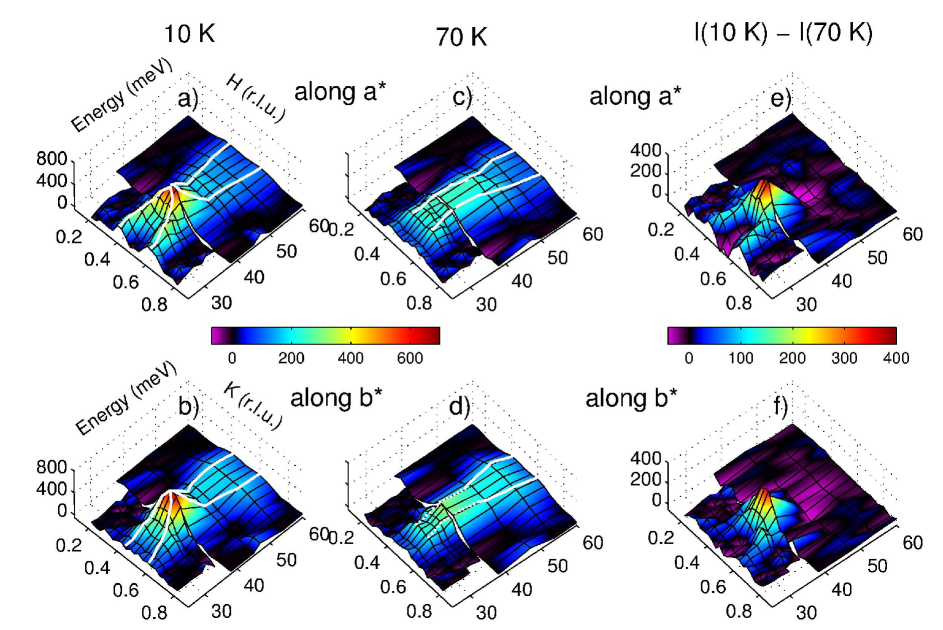
In the NS, the in-plane anisotropy increases strongly for (70 K profiles in Figs. 1 and 2). Upon heating through , and the overall extent of the signal in Q-space shrinks by about 30% along b∗, but only by 10% along a∗. The constant-energy profiles become flat-topped, and if these profiles are fitted to two peaks displaced from Q the resulting anisotropy of is nearly 40%, compared to 15% in the SC state. At energies up to , the geometry of the NS spectrum is thus more anisotropic than the one in the SC state. In contrast, hardly any difference between spectra in the normal and SC states is discernible at excitation energies significantly exceeding . This distinction is highlighted in Fig. 2e-f, where the difference between the magnetic spectra in the SC and normal states is shown. The difference signal comprises the downward-dispersing branch below , which draws its spectral weight from a limited range above and a more extended range below (negative signal in Figs. 2e,f). It is significantly less anisotropic than the NS spectrum itself (Fig. 2c-d), with respect to both and the spectral weight distribution. Notably, the difference spectrum is very similar to its analogue in almost optimally doped , which was shown to exhibit a nearly circular geometry Hin04 . This suggests that the main characteristics of the SC state (such as the gap anisotropy) are similar at both doping levels.
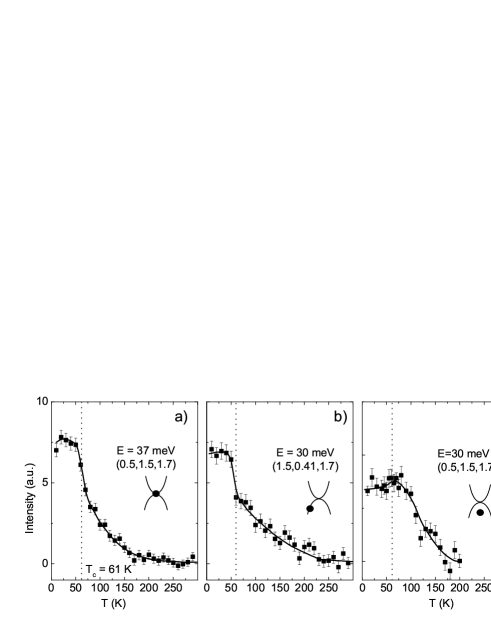
The spectral rearrangement associated with the formation of the downward-dispersing branch at results in a sharp upturn of the intensity at points along this branch (Fig. 3a-b), while at Q and 30 meV there is only a broad maximum at (Fig. 3c). Upon further heating, however, the spectral weight at energies at and below declines uniformly at all Q-values and vanishes (to within the experimental sensitivity) at a characteristic temperature 200 K. This is a further manifestation of the qualitative difference of the SC and normal state spectra. is comparable to the temperature below which various observables exhibit a “pseudogap” in this doping range Tim99 . Corresponding constant-energy cuts show that for , the low-energy spectral weight is severely depleted over the entire Brillouin zone below a characteristic energy meV (Fig. 1 e-h, see also Ref. Dai99 ). (Within our experimental sensitivity, the magnetic spectral weight for is indistinguishable from zero. However, it is unlikely that represents a true gap, because YBa2Cu3O6.6 is metallic at room temperature, and significant Korringa relaxation has been observed in NMR experiments.) At energies above , in contrast, the spectral weight is only moderately reduced upon heating above (Fig. 1 a-d). We can thus distinguish a third temperature regime above , with a magnetic excitation spectrum differing distinctly from the spectra deep inside the SC state and just above . The intriguing question whether or not the approximate coincidence of and is accidental should be addressed by theory.
We now discuss the implications of our observations for stripe models of the cuprates. On a qualitative level, the large additional low-energy spectral weight below and the substantial in-plane NS anisotropy appear compatible with incipient stripe order. Moreover, recent STM experiments in the NS of underdoped have revealed low-energy charge excitations with a “vertical” dispersion akin to corresponding features observed in our neutron experiment Ver04 . (A related correspondence has recently been pointed out for the SC state of , Ref. Chr04 .)
However, the calculations of the spin excitation spectra of striped phases reported thus far do not provide a satisfactory description of our data. In static stripe models, is determined by the interaction of spins in adjacent stripes and represents a saddle point separating a low-energy regime of anisotropic two-dimensional (2D) excitations from a high-energy regime with purely 1D excitations Uhr04 ; Voj04 ; Sei05 . At , the neutron cross section is expected to take the form of streaks in the wave vector direction perpendicular to the stripes, and only one of the two orthogonal in-plane scans is expected to show IC peaks, in contradiction to our data in Fig. 1a–d. This definitively rules out static stripe scenarios for YBa2Cu3O6.6, in agreement with previous conclusions based on low-energy excitations in untwinned crystals Hin04 and high-energy excitations in partially twinned crystals Sto05 in the SC state.
The spin excitation spectra of dynamic stripe phases have recently been computed numerically Voj05 . For slowly fluctuating stripes, the constant-energy cuts exhibit a quasi-2D intensity distribution, as experimentally observed, but the spectrum retains its overall “hour glass” shape. However, since the influence of superconductivity has thus far not been considered, predictions of these models should be compared to our new NS-data, where the “hour glass” shape is no longer present. If both SC- and normal-state spectra were found to be amenable to an interpretation based on fluctuating stripes, our data imply that the stripe fluctuation rate would have to change dramatically upon crossing . To our knowledge, such a scenario has not been predicted. Similar considerations apply for other recently proposed models according to which the “hour glass” shape of the magnetic spectrum is a consequence of spiral spin correlations Lin05 or other types of modulation Bat05 .
A natural explanation of the qualitative difference between the magnetic excitation spectra in the SC and normal states is provided by models that regard the downward-dispersing branch as an excitonic mode in the spin-triplet channel below the SC energy gap Esc05 . If the downward dispersion is a manifestation of the d-wave symmetry of the gap, its disappearance in the normal state is not surprising. Quantitative calculations of the spin excitation spectrum associated with the triplet exciton have been carried out mostly in the framework of weak-coupling schemes. It is questionable whether such models are capable of describing the strong temperature evolution we have found for . Even in the absence of detailed calculations, however, the qualitative difference between the spectra above and below appears inconsistent with the proposal Sto04 ; Dai99 that the low-energy spin excitations observed for should be regarded as an incoherent precursor of the triplet exciton below .
A microscopic explanation of the unusual dispersion and the strong in-plane anisotropy we have observed in the normal state, as well as its strong temperature evolution for , remains an important challenge for theoretical work. An interesting analogy is offered by the spin-1 chain compound , which exhibits a Haldane gap for . For nonzero density of mobile charge carriers, x, additional spin excitations with a “vertical” dispersion develop below the Haldane gap Xu00 . The similarity with the temperature-driven development of spin correlations below the characteristic energy in YBa2Cu3O6.6 provides hope that the doped Haldane chain could serve as a simple model system for a theoretical description of this behavior.
Acknowledgements: We thank C. Bernhard, G. Khaliullin, D. Manske, W. Metzner, M. Vojta, and H. Yamase for stimulating discussions.
References
- (1) S. Pailhès et al., Phys. Rev. Lett. 93, 167001 (2004).
- (2) N. B. Christensen et al., Phys. Rev. Lett. 93, 147002 (2004).
- (3) J. M. Tranquada et al., Nature 429, 534 (2004).
- (4) S. M. Hayden et al., Nature 429, 531 (2004).
- (5) D. Reznik et al., Phys. Rev. Lett. 93, 207003 (2004).
- (6) G. S. Uhrig, K. P. Schmidt, and M. Grüninger, Phys. Rev. Lett. 93, 267003 (2004).
- (7) M. Vojta and T. Ulbricht, Phys. Rev. Lett. 93, 127002 (2004).
- (8) G. Seibold and J. Lorenzana, Phys. Rev. Lett. 94, 107006 (2005).
- (9) M. Arai et al., Phys. Rev. Lett. 83, 608 (1999).
- (10) H. F. Fong et al., Phys. Rev. B 61, 14773 (2000).
- (11) P. Dai, H. A. Mook, R. D. Hunt, and F. Doǧan, Phys. Rev. B 63, 054525 (2001).
- (12) C. Stock et al., Phys. Rev. B 69, 014502 (2004).
- (13) C. Stock et al., Phys. Rev. B 71, 024522 (2005).
- (14) V. Hinkov et al., Nature 430, 650 (2004).
- (15) M. Vojta, T. Vojta, and R. K. Kaul, cond-mat/0510448 (2005).
- (16) H. Yamase and H. Kohno, J. Phys. Soc. Jpn. 69, 332 (2000).
- (17) I. Eremin and D. Manske, Phys. Rev. Lett. 94, 067006 (2005).
- (18) T. Zhou and J.-X. Li, Phys. Rev. B 69, 224514 (2004).
- (19) P.-A. Lindgård, Phys. Rev. Lett 95, 217001 (2005).
- (20) P. Dai et al., Science 284, 1344 (1999).
- (21) The wave vector is quoted in units of the reciprocal lattice vectors a∗, b∗ and c∗ where , and . We choose its out-of-plane component , integer, to probe magnetic excitations that are odd under the exchange of two layers within a bilayer unit. As even excitations show a gap of meV and are much less T-dependent, they are presented elsewhere (S. Pailhès et al., cond-mat/0512634) .
- (22) P. Bourges et al., Science 288, 1234 (2000).
- (23) T. Timusk and B. W. Statt, Rep. Prog. Phys. 62, 61 (1999).
- (24) M. Vershinin et al., Science 303, 1995 (2004).
- (25) C. Batista, G. Ortiz, and A. V. Balatsky, cond-mat/0511303 (2005).
- (26) for a review cf. M. Eschrig, cond-mat/0510286 (2005) .
- (27) G. Xu et al., Science 289, 419 (2000).