‘Magic Melters’ Have Geometrical Origin.
Abstract
Recent experimental reports bring out extreme size sensitivity in the heat capacities of Gallium and Aluminum clusters. In the present work we report results of our extensive ab initio molecular dynamical simulations on Ga30 and Ga31, the pair which has shown rather dramatic size sensitivity. We trace the origin of this size sensitive heat capacities to the relative order in their respective ground state geometries. Such an effect of nature of the ground state on the characteristics of heat capacities is also seen in case of small Gallium and Sodium clusters indicating that the observed size sensitivity is a generic feature of small clusters.
pacs:
31.15.Qg,36.40.Sx,36.40.Ei,82.20.WtThe finite temperature behavior of clusters has shown many interesting and intriguing properties Na-expt ; Jar-tin1 ; Ga-expt ; Ga-JACS ; Al-expt . Recently the calorimetric measurements reported by Jarrold and coworkers found that small clusters of Tin and Gallium in the size range of 17-55 atoms have higher than bulk melting temperatures (Tm[bulk]) Jar-tin1 ; Ga-expt . A striking experimental result from the same group showed extreme size sensitivity in the nature of the heat capacity for Ga clusters in the size range of 30-55 atoms Ga-JACS . It turns out that addition of even one atom changes the heat capacity dramatically. For example, Ga has a rather flat specific heat curve whereas heat capacity of Ga has a well defined peak and has been termed as ‘magic melter’. A similar size sensitive feature has also been observed in the case of Al clusters Al-expt .
The explanation and understanding of various experimental observations have come from the first principles Density Functional (DF) simulations tinthermo ; Chacko-PRB ; Ga-theo ; sailaja-Ga ; snsi . For example, the higher than bulk melting temperature for Sn and Ga clusters is understood as due to the difference in the nature of bonding between the cluster and the bulk tinthermo ; Ga-theo ; snsi . However, the extreme size sensitivity displayed in Gallium and Aluminum clusters is still an unexplained phenomena. The present work addresses this issue by employing first principles DF methods. In this letter we report our results of ab initio molecular dynamical (MD) simulations carried out on Ga30 and Ga31. It is of some interest to note that similar size sensitive heat capacities have been observed in case of Gan () sailaja-Ga and Nan () Lee-JCP clusters. In both these cases addition of few atoms changes the nature of heat capacities significantly. By analyzing the geometry of the ground state, we establish a definitive correlation between the nature of the ground state and the observed heat capacity. Our detailed calculations show that an ‘ordered’ ground state leads to a heat capacity with a well defined peak while a cluster with ‘disordered’ ground state leads to a flat heat capacity with no distinct melting transition. In what follows we will make the meaning of ‘order’ and ‘disorder’ precise and provide explanation for the size sensitive heat capacities.
We have carried out isokinetic Born-Oppenheimer MD simulations using ultrasoft pseudopotentials within the generalized gradient approximation (GGA) vasp . For all the clusters reported here we have obtained at least 200 equilibrium structures. For computing heat capacities of Ga30 and Ga31 the MD calculations were carried out for 16 different temperatures, each with the duration of 150 ps or more, in the range of K, which results in a total simulation time of 2.4 ns. In order to get converged heat capacity curves especially in the region of coexistence, more temperatures were required with longer simulation times. The resulting trajectory data has been used to compute the ionic specific heat by employing the Multiple Histogram (MH) method MH ; amv-review .
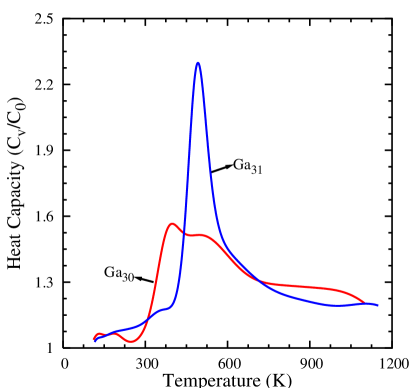
Fig. 1 shows the calculated heat capacity of Ga30 and Ga31. Evidently the dramatic difference in the heat capacities of Ga30 and Ga31, observed in the experiments is well reproduced in our simulations. Thus Ga31 has a well defined peak in the heat capacity whereas the heat capacity for Ga30 is rather flat. We also note that both Ga30 and Ga31 becomes ‘liquid-like’ at temperatures much higher than Tm[bulk] (303 K) i.e. around 500 K, consistent with the experiments.
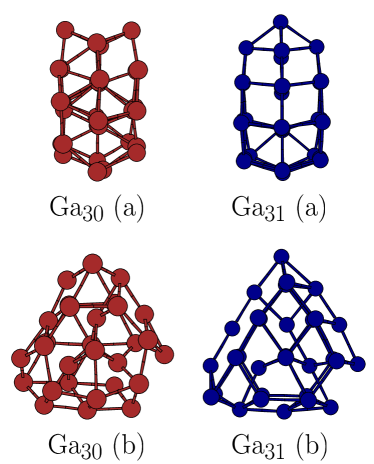
In order to gain insight in to these observations we analyze the ground state of Ga30 and Ga31. In Fig. 2 we show the ground state geometries of Ga30 and Ga31 with two different perspectives. A cursory analysis of Fig. 2-a may lead to the conclusion that the only difference between Ga30 and Ga31 ground states is the presence of the capped atom in Ga31. However, a different view obtained by rotating the cluster by 900 brings out the significant differences in Ga30 and Ga31, clearly indicating that Ga31 is more ordered. A careful examination of Fig. 2-b shows the presence of well ordered planes in Ga31. Such planes are only in a formative stage and considerably deformed in Ga30. In fact an addition of just one atom in Ga30 displaces all the atoms by a significant amount which makes Ga31 more ordered. That a single atom makes a substantial change is also seen by the fact that there is noticeable difference in the coordination number in these two clusters. In Ga30, 5 atoms have 4 or more coordination number whereas in Ga31, 14 atoms have 4 fold or more coordination. Therefore we termed Ga30 as a ‘disordered’ structure relative to Ga31.
Thus when the system is disordered or amorphous each atom (possibly a group of atoms) is likely to have different local environment. That means different atoms are bonded with the rest of the system with varying strength. Consequently, their dynamical behavior as a response to temperature will differ. Some of the atoms may pickup kinetic energy at low temperatures while the others may do so at higher temperatures. In a given structure if a large group of atoms are bonded together with a similar strength forming an island of local order it is reasonable to expect that they will ‘melt’ together. In this case the cluster can be considered as (at least partially) ordered and will show a well defined peak in the heat capacity. However, if the system is disordered in the sense that there are no such islands of significant sizes having local order then we expect a very broad continuous phase transformation. Indeed, our analysis of mean square displacements (MSDs) for individual atoms brings out this fact clearly. The MSDs for individual atoms is defined as
| (1) |
where is the position of the th atom and we average over different time origins spanning the entire trajectory.
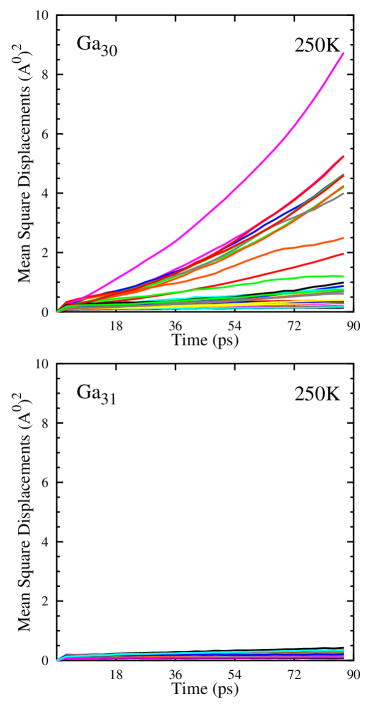
In Fig. 3 we show MSDs of individual atoms for Ga30 and Ga31 at 250 K. The contrast between the kinetic response of individual atoms in Ga30 and Ga31 is very clear. For Ga30, the MSDs of individual atoms show that some of the atoms (at least 10) have picked up more kinetic energy compared to others and hence have significantly higher displacements (9.0 Å2 as compared to 0.45 Å2) whereas in Ga31 all atoms are oscillating about their mean positions and exhibit small values of MSDs (0.45 Å2). Thus MSDs clearly indicate that in Ga30 different atoms have different mobilities. This wide distribution of MSDs in Ga30 indicates that the cluster is in coexistence phase around 250 K and is continuously evolving. This is precisely what is expected if the cluster is disordered in the sense described above. This phenomena has also been observed in the extended systems and a similar analysis has been used to characterize the nature of spatial inhomogeneities with considerable success. Chandan-PRL
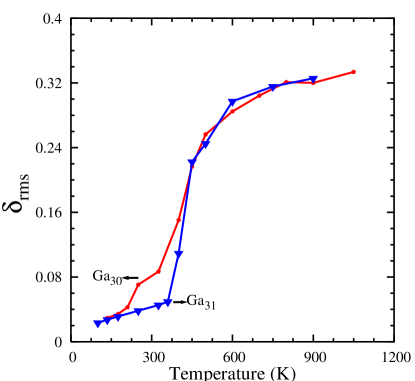
The difference in the mobilities of individual atoms in these two clusters is also reflected in the root-mean square bondlength fluctuations () shown in Fig. 4. shows a clear signal for the beginning of the change of phase around 450 K for Ga31. However, in case of Ga30 the transition is spread over a much broader range of temperatures. In fact the coexistence region for Ga31 is over 175 K (from 425 K to 600 K) and for Ga30 it extends over 425 K. It is interesting to note that in Ga30 the isomerization begins around 175 K and continues till 600 K.
The nature of the ‘order’ can also be brought out by examining the Electron Localization Function (ELF). ELF has been found to be extremely useful for elucidating the bonding characteristics of a variety of systems elf . For a single determinantal wavefunction built from KS orbitals , the ELF is defined as,
| (2) |
where
| (3) | |||||
| (4) |
with is the valence-electron density. ELF is defined such that values of approaching unity indicate a strong localization of the valence electrons and covalent bonding. ELF partitions the molecular space into regions or basins of localized electron pairs or attractors. At very low values of the ELF all the basins are connected. In other words, there is a single basin containing all the atoms. As the value of the ELF is increased, the basins begin to split and finally we will have as many basins as the number of atoms. The value of the ELF at which the basins split is a measure of the strength of interaction between the different atoms.
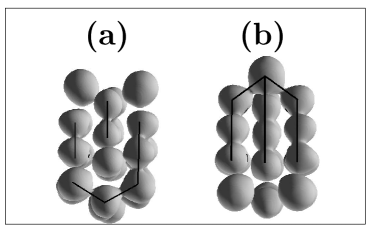
Fig. 5 shows the isosurface of ELF taken at = 0.68, for Ga30 and Ga31. It can be noted that for Ga31, 26 atoms are connected via a single basin whereas for Ga30 the largest basin contains 12 atoms with other ‘fragmented’ basins. This supports our earlier observation that Ga31 has significantly more similarly bonded atoms than Ga30. Further evidence for the disordered or amorphous nature of Ga30 comes from the comparison of entropies of these systems (Fig. not shown). As expected the entropy of amorphous structure (Ga30) rises rather sharply as compared to Ga31 (which is more ordered). Quite clearly, the amorphous nature leads to substantially large number of accessible states in case of Ga30 and is more by a factor of ten as compared to Ga31 in the low energy region.
As mentioned earlier this size sensitive behavior is not unique to the Gallium clusters reported here and has been observed in small Ga sailaja-Ga , Al Al-expt , and Na Lee-JCP clusters. As an example we show the heat capacities of Nan () clusters in Fig. 6. The change in the nature of heat capacity as the cluster grows from Na40 to Na55 is quiet evident from Fig. 6.
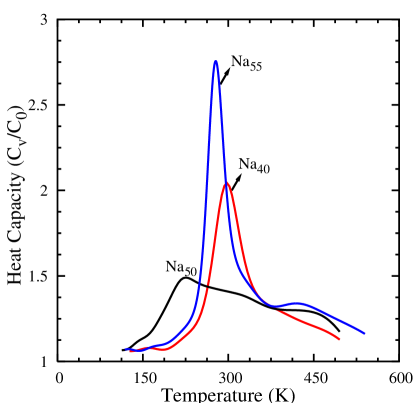
Our detailed analysis of the ground state geometries shows a direct correlation between the nature of the ground state and calculated heat capacities. It may be noted that Na55 is highly symmetric and very well ordered. Na40 is also ordered and has basin containing substantially large number of atoms but Na50 is relatively disordered which is clearly reflected in their heat capacities footnote1 .
The main contribution of the present work is to bring out a definitive relationship between the local order in the cluster and its finite temperature behavior. As the cluster grows in size it is very likely that it will evolve through a succession of such ordered and disordered geometries. In such cases addition of one or few atoms is likely to change (as demonstrated in this work) the nature of the ground state abruptly. Thus, the size sensitive nature of heat capacities is generic to small clusters and related to the evolutionary pattern seen in their ground states. The evidence for this comes not only from Gallium clusters but also from clusters of Sodium and Aluminum having very different nature of bonding.
Partial support from IFCPAR-CEFPRIA (Project No. 3104-2) New Delhi and super computing facility from C-DAC is gratefully acknowledged.
References
- (1) H. Haberland, T. Hippler, J. Dongres, O. Kostko, M. Schmidt, B. von Issendroff Phys. Rev. Lett., 94 035701 (2005) and references therein.
- (2) A. Shvartsburg and M. F. Jarrold, Phys. Rev. Lett. 85, 2530 (2000).
- (3) G. A. Breaux, R. C. Benirschke, T. Sugai, B. S. Kinnear, M. F. Jarrold, Phys. Rev. Lett., 91 215508 (2003).
- (4) G. A. Breaux, D. A. Hillman, C. M. Neal, R. C. Benirschke, M. F. Jarrold, J. Am. Chem. Soc., 126 8628 (2004).
- (5) G. A. Breaux, C. M. Neal, B. Cao, M. F. Jarrold, Phys. Rev. Lett. 94 173401 (2005).
- (6) K. Joshi, D. G. Kanhere, and S.A. Blundell, Phys. Rev. B 66 155329 (2002),ibid Phys. Rev. B 67 235413 (2003)
- (7) S. Chacko, D. G. Kanhere, and S. A. Blundell Phys. Rev. B. 71 155407 (2005).
- (8) S. Chacko,K. Joshi, D. G. Kanhere, and S. A. Blundell Phys. Rev. Lett. 92 135506 (2004).
- (9) S. Krishnamurty, S. Chacko, D. G. Kanhere, G. A. Breaux, C. M. Neal, and M. F. Jarrold Phys. Rev. B (in print)
- (10) S. Krishnamurty, K. Joshi, and D. G. Kanhere, Phys. Rev. B (in print)
- (11) M-S. Lee, S. Chacko, D. G. Kanhere, J. Chem. Phys. 123, 164310 (2005).
- (12) Vienna ab initio simulation package, Technische Universität Wien (1999); G. Kresse and J. Furthmüller, Phys. Rev. B 54, 11169 (1996).
- (13) A. M. Ferrenberg and R. H. Swendsen, Phys. Rev. Lett. 61, 2635 (1988); P. Labastie and R. L. Whetten, Phys. Rev. Lett. 65, 1567 (1990).
- (14) D. G. Kanhere, A. Vichare, and S. A. Blundell, Reviews in Modern Quantum Chemistry, Edited by K. D. Sen, World Scientific, Singapore (2001).
- (15) A. W-Cooper, P. Harrowell, and H. Fynewever, Phys. Rev. Lett. 93 135701 (2004)
- (16) B. Silvi, and A. Savin, Nature (London), 371, 683 (1994).
- (17) It may be noted that these are predicted heat capacities and await experimental confirmation.