Characterizing the stepwise transformation from a low-density to a very-high-density form of supercooled liquid water
Abstract
We explore the phase diagram of TIP4P-Ew [J. Chem. Phys. 120, 9665 (2004)] liquid model water from the boiling-point down to at densities ranging from to . In addition to the low-density/high-density (LDL/HDL) liquid-liquid transition, we observe a high-density/very-high-density (HDL/VHDL) transformation for the lowest temperatures at . A Van der-Waals type loop suggest the presence of a first order HDL/VHDL transition. In addition, we identify a pre-transition at , suggesting the experimentally detected HDA/VHDA-transformation to be a two-step process. For both pre- and main- HDA/VHDA-transition we observe a step-wise increase of the oxygen coordination number for interstitial water molecules.
Experimental and theoretical studies conducted over the past 14 years have provoked the interpretation that water’s anomalies stem from a transformation between two major liquid forms of water buried in the deeply supercooled region (see reviews by H.E. Stanley and P.G. Debenedetti Debenedetti and Stanley (2003); Debenedetti (2003)). The two different liquids have their counterparts in the glassy state: The high density (HDA) and low density amorphous (LDA) ice forms Mishima et al. (1984). However, it is still an open question how exactly the different amorphous ice forms and supercooled liquid water are connected, since the “no man’s land” region largely prohibits direct experimental access Debenedetti (2003). Therefore, starting with the work of P.H. Poole et al. in 1992, basically computer simulation studies have established a picture of a first order liquid-liquid phase transition between two liquids ending up in a metastable critical point Poole et al. (1992); Tanaka (1996). Although singularity free scenarios might as well explain the properties of supercooled water Debenedetti (2003), there is experimental support for the liquid-liquid critical point hypothesis from the changing slope of the metastable melting curves observed for different ice polymorphs Mishima and Stanley (1998); Mishima (2000).
Meanwhile, also a very high density form (VHDA) of amorphous ice was observed and shown to be distinct from HDA Loerting et al. (2001). Neutron scattering data reveals that the transformation between HDA and VHDA is related to an increasing population of interstitial water molecules in an O-O distance-interval between and Finney et al. (2002). Simulation studies indicate, that VHDA should be considered as the amorphous solid counterpart to the high density liquid water phase at ambient conditions, and not HDA Giovambattista et al. (2005a, b). Koza et al. Koza et al. (2005) have demonstrated by using inelastic neutron scattering that HDA and VHDA appear to be heterogeneous at the length-scale of nanometers and that different forms of HDA are obtained, depending on the exact preparation process Koza et al. (2005). Tulk et al. find by annealing of HDA at normal pressure Tulk et al. (2002) evidence for the presence of a multitude of (metastable) amorphous ice states. Finally, a very recent experimental study by Loerting et al. suggest the presence of a well established first order phase transition between the HDA and VHDA amorphous ices Loerting et al. (2005). In this context we would like to emphasize, that the computer simulations of Brovchenko et al. Brovchenko et al. (2003, 2005) were the first to conclude that there might exist even more than one liquid-liquid transition in supercooled water.
Here we present extensive thermophysical data on the deeply supercooled liquid state of the TIP4P-Ew water model Horn et al. (2004). TIP4P-Ew seems to be an ideal candidate, since it not only reproduces well the thermodynamic and structural properties of the liquid phase Horn et al. (2004) (including a boiling point at Horn et al. (2005)), but the TIP4P family of models also describe amazingly well the different ice polymorphs Sanz et al. (2004); Vega et al. (2005a, b), qualitatively reproducing the entire phase diagram of crystal solid water up to about . Recently, also attempts have been undertaken to study the HDA to VHDA transition by computer simulations, suggesting a continuous structural transformation Martoňák et al. (2005). However, facing the low temperature conditions, these studies, although quite long on computer simulation time scales, suffer certainly from equilibration problems. To overcome these limitations, we present parallel tempering simulations of an extended ensemble of states Marinari and Parisi (1992), applying the technique of volume-temperature replica exchange molecular dynamics simulation (VTREMD) Paschek (2005). The Replica exchange molecular dynamics scheme (REMD), is a parallel tempering variant Sugita and Okamoto (1999), based on the MD simulation technique, enhancing sampling by about two orders of magnitude Yamamoto and Kob (2000).
For our simulation VTR we consider a grid of 644 (,)-states TIP . Starting from a set of equilibrated initial configurations obtained at ambient conditions, the imulation tec was conducted for , providing a total worth of trajectory data. The average time interval between two successful state-exchanges was obtained to be about . The overall shape of the phase diagram presented here is already well established after only simulation time. However, since the configurational sampling of the lower- states happens almost only by exchange with replicas coming from higher temperatures, the resolution of fine details of the -diagram requires a long simulation run. The simulation took about 100 days on 20 Processors of our Intel Xeon 3.05 GHz Linux cluster. All data reported here were averaged over the final of the simulation.
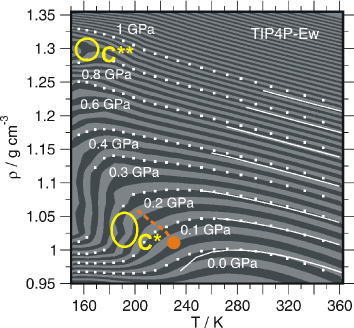
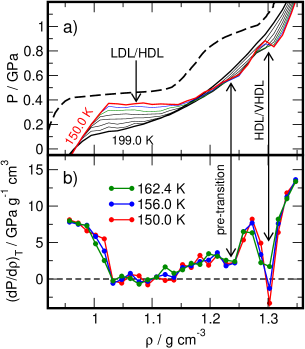
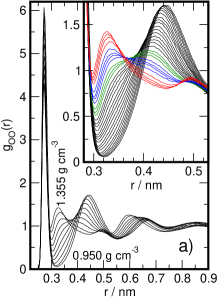
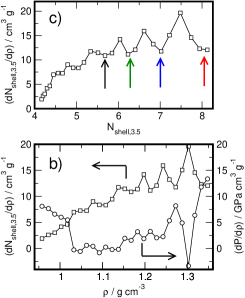
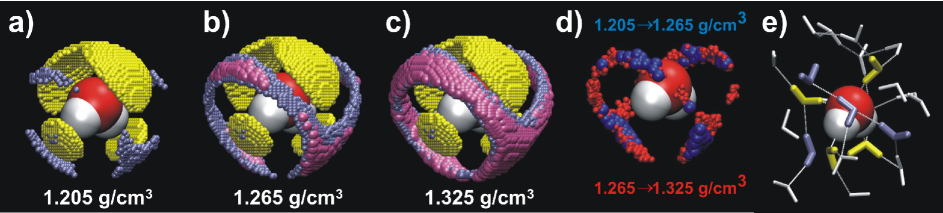
Figure 1 shows the phase diagram of liquid TIP4P-Ew water as contour plot of the -data. The TIP4P-Ew phase diagram exhibits a first order low-density/high-density liquid-liquid phase transition, ending in a metastable critical point . The ellipse denotes the region where LDL/HDL-critical point is apparently located. Due to a finer -grid at lower temperatures, and longer simulation times, we have improved the sampling of the low- states, compared to our recent study on the five-site TIP5P-E model Paschek (2005). Figure 1 demonstrates that TIP4P-Ew reproduces the experimental phase diagram of liquid water much better than the TIP5P-E model Paschek (2005), almost quantitatively matching waters compressibility and thermal expansivity up to pressures in the GPa-range. Figure 1a indicates, that the Van der Waals-loop like overshooting of the -isotherm, as observed in the HDL/LDL coexistence region of the TIP5P-E model Paschek (2005), is found to be almost completely flattened out in the case of TIP4P-Ew. Also shown in Figure 1 is the LDL/HDL-transition line and critical point as obtained by O. Mishima Mishima (2000) for . Since the densities of the experimental coexistence line are essentially not known, we have projected the pressures reported by Mishima on the TIP4P-Ew -surface. We find a temperature difference between the two metastable critical points by about . We would like to point out that this value corresponds roughly to the temperature difference between the Ice- melting-lines of TIP4P-Ew and Vega et al. (2005a).
In addition to the LDL/HDL-transition, we denote the appearance of another (HDL/VHDL) liquid-liquid-transition at at about . The second metastable critical region, denoted by , is identified by a van der Waals type of behavior of vs. shown in Figure 2a. Moreover, Figure 2b presents the derivative of the lower- isotherms characterizing the HDL/VHDL-transition by a pronounced dip. In addition to the fully developed first order transition at , we would like to point out the appearence of a shoulder at about (Figure 2a), corresponding to a less well pronounced dip in Figure 2b. Both curves indicate the emergence of a not yet fully developed transition around , which we refer to as the HDL/VHDL pre-transition. We find that our simulations are in qualitative agreement with the experimental compression curve of amorphous water obtained at shown in Figure 2a. However, there is a shift of about between the experimental and simulated data-sets. The elastic compression of VHDA as obtained by Loerting et al. with Loerting et al. (2005) is comparable to the (Figure 2b) of the VDHL-phase observed here. The larger elastic compression found for HDA ( Loerting et al. (2005)) is also qualitatively in accordance with our simulation data. Moreover, the slightly asymmetric shape of HDA/VHDA the transition observed by Loerting et al. Loerting et al. (2005) over the density interval between does not seem to rule out the presence of a softer transition or pre-transition in the density range of to and a sharper transition at about .
Figure 3 shows how the observed transitions are related to structural changes in the local environment of the water molecules. Figure 3a depicts the O-O pair correlation functions for water at as a function of density. The insert given in Figure 3a focuses primarily on the changes in the so called interstitial water region between and . In line with structural data obtained from neutron scattering experiments Finney et al. (2002), we observe the appearence of a peak in the interstitial region as pressure increases. Moreover, with increasing density we denote the occurrence undulations in the water coordination number. In the insert in Figure 3a these undulations appear as larger gaps between the individual -curves. For better visibility these increased gaps are indicated by a changing color. The magnitude of the variation in the local density is shown in Figure 3b by plotting derivative of waters O-O coordination number for with respect to the density . Comparing this data with the -line (Figure 3b) we find that the observed HDL/VHDL transitions are exactly accompanied by a step-wise increase of water’s coordination number. Moreover, Figure 3b presents the data as a function of the coordination number . The diagram indicates that the HDL/VHDL transition is accompanied by an increase from seven to eight water molecules in the sphere of around a central water molecule. At the HDL/VHDL pre-transition we find only a fractional increase of about water molecules on average. Further wiggles in suggest that there is at least one more step in the occupation number at even lower densities.
Figure 4 illustrates the structural changes of the local water environment along the HDL/VHDL pre- and main-transitions. In line with experimental finding, waters first coordination shell () is found to consist of four tetrahedrally arranged water molecules Finney et al. (2002). With increasing pressure, water is penetrating the interstitial region () arranging in a lobes around the positions occupied by the first-shell water molecules. However, even at the highest densities there are not more than about four water molecules filling the interstitial positions, indicating that the lobe-type positions can be only partially occupied. Figure 4a indicates that for HDL-water the interstitial molecules are preferentially located on the “anti-tetrahedral” positions, being located on the centers of faces of the tetrahedron formed by the first-shell water molecules. Figure 4b and 4d indicate that along the pre-transition interstitial water is also predominantly inserting into these “anti-tetrahedral” positions, whereas during the HDL/VHDL main-transition the lobes are getting more and more completed by increasingly filling the gaps between two “anti-tetrahedral” sites. Figure 4e exemplifies this scenario, showing four nearest neighbor water molecules and three water molecules in “anti-tetrahedral”-coordination. The water molecule representing on the connecting lobe-position is apparently forming a hydrogen bond-bridge between the water molecules.
In conclusion, our simulations indicate the presence of a major HDL/LDL transition in supercooled water, being responsible for the anomalous thermodynamical behavior of water at ambient conditions. However with decreasing temperature, water’s surface becomes increasingly corrugated, developing further step-like transformations: The HDL/VHDL pre- and main-transitions, and possibly more at even lower temperatures. The onset of these transformations is apparently tightly related to a change of the local coordination of the water molecules. Hence we propose a two-region scenario for supercooled-water: A very low-temperature region with several distinct structural transitions, which is typically probed by studies on the amorphous forms of water Loerting et al. (2001, 2005); Koza et al. (2005); Tulk et al. (2002), and a medium temperature region, where due to increased thermal energy these transitions are covered and two major liquid forms of water (LDL and HDL) are found to be in equilibrium.
We gratefully acknowledge support by the Deutsche Forschungsgemeinschaft (FOR 436).
References
- Debenedetti and Stanley (2003) P. G. Debenedetti and H. E. Stanley, Physics Today 56, 40 (2003).
- Debenedetti (2003) P. G. Debenedetti, J. Phys. Cond. Matt. 15, R1669 (2003).
- Mishima et al. (1984) O. Mishima, L. D. Calvert, and E. Whalley, Nature 310, 393 (1984).
- Poole et al. (1992) P. H. Poole, F. Sciortino, U. Essmann, and H. E. Stanley, Nature 360, 324 (1992).
- Tanaka (1996) H. Tanaka, Nature 380, 328 (1996).
- Mishima and Stanley (1998) O. Mishima and H. E. Stanley, Nature 396, 329 (1998).
- Mishima (2000) O. Mishima, Phys. Rev. Lett. 85, 334 (2000).
- Loerting et al. (2001) T. Loerting, C. Salzmann, I. Kohl, E. Mayer, and A. Hallbrucker, Phys. Chem. Chem. Phys. 3, 5355 (2001).
- Finney et al. (2002) J. L. Finney, D. T. Bowron, A. K. Soper, T. Loerting, E. Mayer, and A. Hallbrucker, Phys. Rev. Lett. 89, 205503 (2002).
- Giovambattista et al. (2005a) N. Giovambattista, H. E. Stanley, and F. Sciortino, Phys. Rev. Lett. 94, 107803 (2005a).
- Giovambattista et al. (2005b) N. Giovambattista, H. E. Stanley, and F. Sciortino, Phys. Rev. E 72, 031510 (2005b).
- Koza et al. (2005) M. M. Koza, B. Geil, K. Winkel, C. Köhler, F. Czeschka, M. Scheuermann, H. Schober, and T. Hansen, Phys. Rev. Lett. 94, 125506 (2005).
- Tulk et al. (2002) C. A. Tulk, C. J. Benmore, J. Urquidi, D. D. Klug, J. Neuefeind, B. Tomberli, and P. A. Egelstaff, Science 297, 1320 (2002).
- Loerting et al. (2005) T. Loerting, W. Schustereder, K. Winkel, C. Salzmann, I. Kohl, and E. Meyer, Phys. Rev. Lett. (2005), (in print).
- Brovchenko et al. (2003) I. Brovchenko, A. Geiger, and A. Oleinikova, J. Chem. Phys. 118, 9473 (2003).
- Brovchenko et al. (2005) I. Brovchenko, A. Geiger, and A. Oleinikova, J. Chem. Phys. 123, 044515 (2005).
- Horn et al. (2004) H. W. Horn, W. C. Sope, J. W. Pitera, J. D. Madura, T. J. Dick, G. L. Hura, and T. Head-Gordon, J. Chem. Phys. 120, 9665 (2004).
- Horn et al. (2005) H. W. Horn, W. C. Swope, and J. W. Pitera, J. Chem. Phys. 123, 194504 (2005).
- Sanz et al. (2004) E. Sanz, C. Vega, and J. L. F. Abascal, Phys. Rev. Lett. 92, 255701 (2004).
- Vega et al. (2005a) C. Vega, E. Sanz, and J. L. F. Abascal, J. Chem. Phys. 122, 114507 (2005a).
- Vega et al. (2005b) C. Vega, J. L. F. Abascal, E. Sanz, L. G. MacDowell, and C. McBride, J. Phys.: Condens. Matter 17, S3283 (2005b).
- Martoňák et al. (2005) R. Martoňák, D. Donadio, and M. Parrinello, J. Chem. Phys. 122, 134501 (2005).
- Marinari and Parisi (1992) E. Marinari and G. Parisi, Europhys. Lett. 19, 451 (1992).
- Paschek (2005) D. Paschek, Phys. Rev. Lett. 94, 217802 (2005).
- Sugita and Okamoto (1999) Y. Sugita and Y. Okamoto, Chem. Phys. Lett. 314, 141 (1999).
- Yamamoto and Kob (2000) R. Yamamoto and W. Kob, Phys. Rev. E 61, 5473 (2000).
- (27) State swapping moves between two states and are accepted with a probability . Here, represents the set of scaled coordinates of the entire -particle system belonging to state . denotes the potential energy of configuration at volume , whereas represents the configurational energy belonging to at volume . Whether a state swapping move or an MD move is executed, is chosen at random with a probability of for selecting state swapping moves.
- (28) Temperatures , , , , , , , , , , , , , , , , , , , , , , at densities between and with an increment of .
- (29) Each replica represents a MD simulation of 256 molecules in the ensemble. The electrostatic interactions are treated by Ewald summation Essmann et al. (1995) with a cutoff of and a mesh with 4th order interpolation. Lennard-Jones cutoff corrections for energy and pressure were considered. A timestep was used. The simulations were carried out with GROMACS 3.2 (www.gromacs.org), modified by us to allow -state-swapping. The temperature tiling has been chosen to maintain an acceptance ratio of about for state swapping.
- (30) The -data is available from, URL http://ganter.chemie.uni-dortmund.de/TIP4PEw.html.
- Wagner and Pruß (2002) W. Wagner and A. Pruß, J. Phys. Chem. Ref. Data 31, 387 (2002).
- Essmann et al. (1995) U. Essmann, L. Perera, M. L. Berkowitz, T. A. Darden, H. Lee, and L. G. Pedersen, J. Chem. Phys. 103, 8577 (1995).