Millimeter wave spectroscopy of rocks and fluids
Abstract
One region of the electromagnetic spectrum that is relatively unexploited for materials characterization is the millimeter wave band (frequencies roughly between 40 and 300 GHz). Millimeter wave techniques involve free-space (non-contacting) measurements which have a length scale that makes them ideal for characterizing bulk properties of multicomponent composites where the scale of homogeneity is on the order of millimeters. Such composites include granular materials such as rocks, fluid mixtures, suspensions and emulsions. Here we show measurements on partially saturated rocks and an oil/water mixture, demonstrating that millimeter wave spectroscopy is a sensitive yet rapid measure of changing composition.
The millimeter wave band of the electromagnetic (EM) spectrum lies between radio and optical frequencies. The two broad classes of experimental techniques associated with these frequency ranges become progressively less effective for millimeter waves (MMW). On the one hand, conductive cables become attenuative and stray capacitances build up as frequencies approach a few GHz. On the other hand, conventional optical sources have limited power in the THz regime and far-IR lasers, which use IR pumping of molecular transitions, tend to be large and complex systems. Further, direct electronic measurement of phase is not possible at optical frequencies. Recent advances in mode-locked lasers have allowed for small photo-conductive antennas to be used as THz Hertzian dipoles: a sub-picosecond pulse incident on a suitable photo-conductor will produce electromagnetic radiation in the terahertz range. This technique has received a lot of attention recentlymittleman but is not the approach that we will take here.
Our approach is the use a novel type of MMW vector network analyzer (VNA). A VNA is a four-port instrument in that it measures amplitude and phase of the transmitted and reflected EM field at each frequency. A VNA allows one to measure the complete, frequency dependent transfer function of device or material.
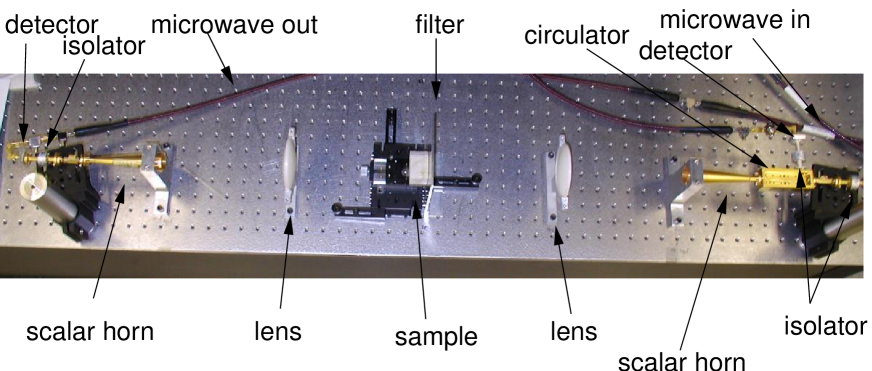
At MMW frequencies, the propagation is via free space or waveguide. Figure 1 shows a bench-top MMW setup involving sources/receivers, lenses, circulators, isolators, transmission through and reflection from small samples. Conceptually, this is no different than an optical measurement, so one uses the term quasi-optical for such experiments. These experiments were performed with the MMW VNA developed by AB Millimetre in Parisabm . The millimeter waves are generated by a sweepable centimeter wave source (i.e., microwaves; in this case from 8-18 GHz), not shown in the figure. These centimeter waves are harmonically multiplied by Schottky diodes, coupled into waveguide and eventually radiated into free space by a scalar horn antenna. A polyethylene lens focuses the beam and a sample is placed in the focal plane. The transmitted field is then collected by an identical lens/horn combination, detected by another Schottky harmonic detector and fed to a vector receiver which mixes the centimeter waves down to more easily manageable frequencies where the signal is digitized. Reflected waves are also collected by the transmitting horn and routed via a circulator and isolator to the vector receiver. The source and receiver oscillators are phase-locked. The experiments described here were performed in the W band (nominally 75-110 GHz); other bands are readily accessible by changing waveguides and sources/detectors. A more complete description of the system is given in mmwspectroscopy and mvna:rsi .
The most common alternative to solid state devices for producing coherent, sweepable MMW is the backward wave oscillator (BWO). A BWO is a periodically loaded electron tube, so named because the matching of the phase and beam velocities gives a negative group velocity. While potentially quite powerful, the BWO requires high voltage, temperature and vacuum for the electron gun, as well as a large permanent magnet and precise machining of the periodic deceleration electrodes. Application of these sources to millimeter and sub-millimeter wave spectroscopy can be found in bwo ; kawate . For our purposes, solid state sources producing a few milliwatts of power are perfectly adequate.
If we use samples that are large in the direction transverse to the beam and with plane parallel faces in the longitudinal direction, then the samples become Fabry-Perot cavities (or etalons) coherentoptics ; ajp . This means that inside the sample standing waves are set up as one sweeps over frequency. Hence the frequency response of the transmitted and reflected EM waves shows the characteristic Fabry-Perot interference fringes. If there is no dispersion over the band of interest, fitting an analytic Fabry-Perot model to the data is straightforward. In fact, this is done by the VNA itself. The use of Fabry-Perot interferometry in open resonators is thoroughly described in fpi .
The model depends on the permittivity and the thickness of the sample; we measure the thickness of the sample and then fit the permittivity. This makes the technique spectroscopic and gives it considerable sensitivity to small changes in the dielectric properties of the sample ajp .
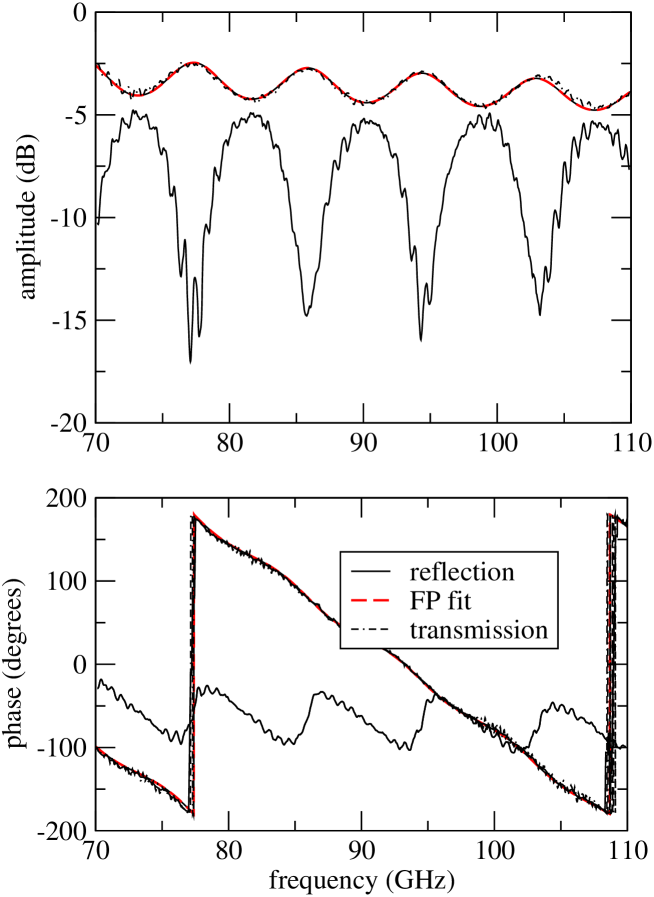
For example, Figure 2 shows a sweep from 75 to 110 GHz in a 7.1mm thick sample of Berea sandstone. The top figure shows the amplitude of the transmitted E field and the bottom shows the phase. The Fabry-Perot interference fringes are clear and this allows one to quickly extract the dielectric constant given the sample thickness. Here we have fit the transmitted field, but obviously one could also work with the reflected field.
The main advantages of MMW over microwaves are the smaller wavelengths and shorter time scales. Smaller wavelengths translate into smaller antennae (better diffraction properties for a given size) and higher spatial resolution for heterogeneous samples. The smaller wavelengths also allows for easier construction of models of spatially complex systems such as photonic crystals. And for dynamical processes (e.g., measuring charge mobility), MMW frequencies correspond to a picosecond time scale rather than the nanosecond scale of microwaves.
Next we show several applications of this MMW spectroscopy, both related to the water content of soft samples. This is certainly not a new idea. Pioneering work in the applications of millimeter waves to materials characterization has been carried out for more than 40 years in the former Soviet Union. The paper bwo has an interesting history of the developement and use of the BWO for millimeter and submillimeter work. And at the Institute of Radio Engineering and Electronics in Moscow, the group of V. Meriakri has done very interesting work on the application of these techniques to characterization of a wide variety practically important materials, including petroleum (e.g., meriakri:oil ; meriakri:water ). Similar techniques were used to assess dielectric measurements as a means to monitor fluid flow around waste repositories frasch .
But advances in both solid state sources/detectors and in mode-locked femtosecond lasers make the experimental methods more accessible now than ever before. In particular, our measurements with the VNA allow us to sweep the entire W-band at several thousand frequencies in less than a minute and dynamically monitor the slowly changing properties of the sample.
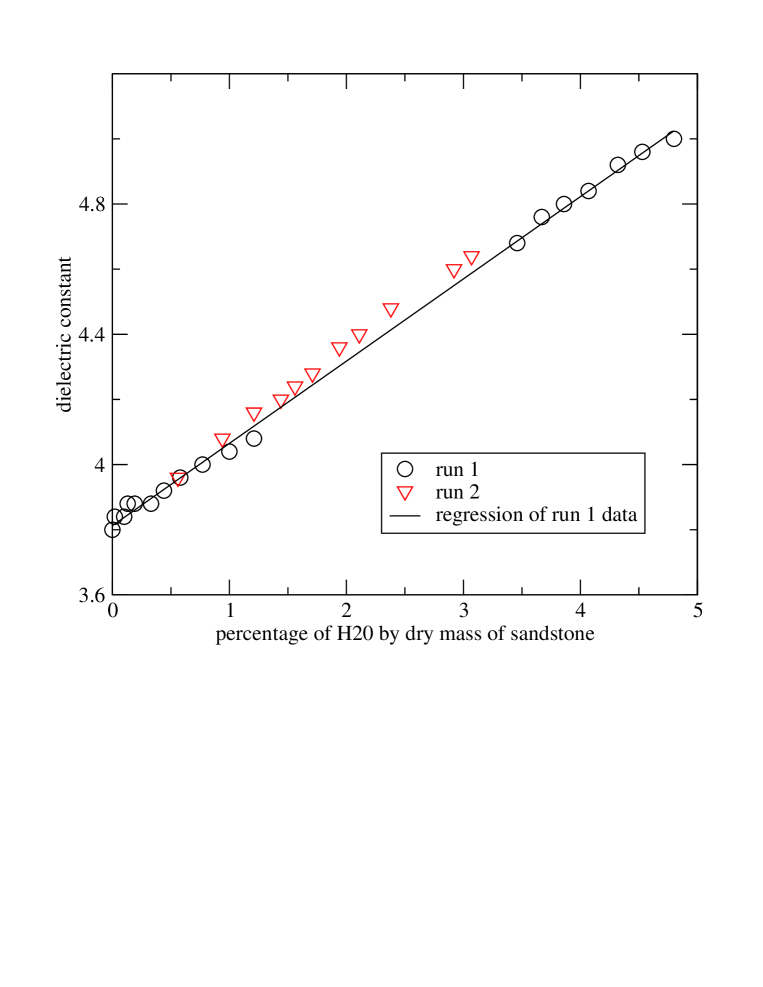
In all these applications we measured the dielectric permittivity as a function of the water content in the sample. In the first case the sample was a porous rock (Berea sandstone). The room-dry sample was partially saturated by allowing it to sit in distilled water. A 5% mass increase due to this simple water imbibition translates into approximately 50% saturation of the pore volume (this sandstone has a porosity of approximately 20%); or a 10% fraction of water by total volume. Over the course of several hours the dielectric constant and mass were measured every few minutes, with one break in the middle (Figure 3). The relatively low laboratory humidity resulted in a decreasing water saturation with time due to evaporation from the sample surface. Under ambient conditions it took about two hours for the rock to dry out to its original state. The measurement was repeated 24 hours later to check the reproducibility. Note that the dielectric constant of liquid water is much lower at millimeter wave frequencies than at RF. For example, at 100 GHz is 7.72 at 20 C and 8.16 at 30 C.liebe
The repeatability of the permittivity shown in Figure 3 suggests an experimental uncertainty of less than a percent. This means that by calibrating a known rock in this way we should be able to use the permittivity to infer the fluid saturation. The speed of the technique means that we can study dynamical processes such as evaporation and flow.
In order to apply this technique to fluids we used Spectrocil quartz cells from Starna. These had an interior thickness of 9.5 mm along the beam direction and where much larger than the beam diameter. The calibration techniques associated with the VNA we use allow one to make a baseline measurement with no sample present. This calibrates out the instrument response. But in addition, we used this capability to calibrate out the presence of an empty cell. Then we make sweeps over the W band with the cell filled with oil. This gives us the response of just the fluid in the cell. For an oil sample with no water present we get an index of 1.52 (permittivity 2.31). This agrees with published values at 2 mm wavelength meriakri:water .
To see how sensitive our technique is to the presence of water, we prepared two additional samples, by mixing distilled water with the oil and agitating to form a fine suspension. One sample had 5% water and one 10%. For these we got permittivities of, respectivley, 2.43 and 2.66. Over the course of several weeks, permittivity meaurements were repeatable to better than half a percent. These results are consistent with those in meriakri:water who looked at oil/water emulsions with water content of .5% and 1%. Both of these sets of measurements are well-fit by the Maxwell-Garnett mixing modelmaxwell :
where and are the permittivities of the water and oil, respectively and is the fraction of water.
For example, this model predicts 5% and 10% water/oil emulsion permittivities of 2.46 and 2.62 respectively, assuming a water permittivity at 100 GHz of 7.72liebe .
Thus adding 5% water to the oil results in an easily measurable increase in the dielectric constant. Hence by calibrating the samples beforehand for a range of water saturations, it may be possible to use the bulk permittivity to deduce the water of unknown samples. These results are consistent with those measured on Basalt in frasch .
Finally we looked at three samples of oil shale taken from the same well location but with different composition and, evidently, permeability. After measuring the permittivity of the dry samples, these were weighed, placed in a vacuum chamber and vacuum applied for 1 hour. Then distilled water was injected to 6.9 MPa pressure (without reexposure to air) and allowed to soak overnight, then reweighed.
Samples 1 (dry ) and 2 (dry ) saturated to 9.7% and 8.1% by mass, respectively, and showed slightly more than a 2% increase in their dielectric permittivity. On the other hand, sample 3 (dry ) took on only .4% water and showed a correspondingly small increase in permittivity of .8%. While these results indicate an approximately linear relation between water content and permittivity, the Maxwell-Garnett does a poor job in this case, predicting much smaller changes in permittivity. But since this mixing model neglects the chemical interaction of the water with the rock matrix, this may not be too surprising for shales, which have significant clay content.
In conclusion, we have shown how use of a state-of-the-art millimeter wave vector network analyzer allows one to quickly perform dielectric spectroscopy on soft materials such as rocks and fluids. The technique has many applications in the study of composite mixtures. The short wavelength gives good spatial resolution, while the speed of the measurement allows one to observe dynamical processes such as evaporation and capilary motion of fluids.
Acknowledgements.
We are grateful for technical assistance and discussions with Philippe Goy of the Laboratoire Kastler Brossel, Ecole Normale Superieure and AB Millimetre in Paris. This work was partially supported by the National Science Foundation (EAR-041292).References
-
(1)
AB Millimetre,
http://www.abmillimetre.com. - (2) R.N. Clarke and C.B. Rosenberg, J. Phys. E: Sci. Instrum. 15, 9–24, (1982).
- (3) L.L. Frasch, S.J. McLean and R.G. Olsen, IEEE Trans. Geoscience and Remote Sensing, 36, 754–766, (1998).
- (4) C. Dahl, P. Goy and J.P. Kotthaus, 221–282, in Millimeter and submillimeter wave spectroscopy in solids, edited by G. Grüner, (Springer, Berlin, 1998).
- (5) E. Kawate and K. Ishii, Appl. Phys. Lett. 84, 4878-4880 (2004).
- (6) G. Kozlov and A. Volkov, Coherent source submillimeter wave spectroscopy, 51–109, in Millimeter and submillimeter wave spectroscopy in solids, edited by G. Grüner, (Springer, Berlin, 1998).
- (7) W. Lauterborn and T. Kurz, Coherent Optics (Springer, Berlin, 2003), 2nd ed.
- (8) H.J. Liebe, G.A. Hufford and T. Manabe, Int. Journal of Infrared and Millimeter Waves, 12, 659–675 (1991).
- (9) J. C. Maxwell-Garnett, Philos. Trans. R. Soc. London, 203, 385-420 (1904).
- (10) V.V.Meriakri, E.E.Chigrai, M.P.Parkhomenko, Moisture content monitoring in crude oil using millimetre electromagnetic waves, Communications of the 2nd Instrumentation and Measurement in Petroleum Applications Conference (IMPAC), Boumerdes, Algeria, October, 2002.
- (11) V.V.Meriakri, E.E.Chigrai, M.P. Parkhomenko, Millimeter waves for water content monitoring in materials and media, 11 Feuchtetag 2002, Vortrage, Weimar, Germany, Sept. 2002, pp. 13-22.
- (12) M. Mola, S. Hill, P. Goy and M. Gross, Rev. Sci. Inst., 71, 186-200, (2000).
- (13) D. Mittleman (editor), Sensing terahertz radiation, (Springer, Berlin, 2002).
- (14) B. Zadler, A. Gret, J.A. Scales, Am. J. Phys, 79, 837–844, (2005).
Figure Captions
Figure 1: Quasi-optical setup for the dielectric measurements. Centimeter waves (8-18 GHz) are created by a sweapable source; the millimeter waves are then created by a harmonic multiplier (not shown in the picture). These MMW are couopled into waveguide and then radiated into free space. The waveguide shown is for the W-band (75-110 GHz) and the holes on the optical bench are 25 mm apart. The sample is placed in the focal plane of the transmitter lens.
Figure 2: Amplitude and phase of the transmitted and reflected electric field as a function of frequency from 75-110 GHz. The sample is a 7.1 mm thick piece of standstone. The low frequency variations are the Fabry-Perot interference fringes. The dashed line is the fit to the FP model.
Figure 3: A 55g sample of Berea stand-stone was partially saturated with distilled water and then allowed to dry out in the lab. As it dried out, we measured the dielectric constant by sweeping over 75-110 GHz. To check the repeatability of the measurements a second run was performed 24 hours later. The horizontal axis shows amount of water saturated in the sample as a fraction of the total dry mass of the sample.