Surface effects on the statistics of the local density of states in metallic nanoparticles: manifestation on the NMR spectra.
Abstract
In metallic nanoparticles, shifts in the ionization energy of surface atoms with respect to bulk atoms can lead to surface bands. Within a simple Tight Binding model we find that the projection of the electronic density of states on these sites presents two overlapping structures. One of them is characterized by the level spacing coming from bulk states and the other arises from the surface states. In very small particles, this effect contributes to an over-broadening of the NMR absorption spectra, determined by the Knight shift distribution of magnetic nuclei. We compare our calculated Knight shifts with experiments on aluminum nanoparticles, and show that the deviation of the scaling law as a function of temperature and particle size can be explained in terms of surface states.
1 Introduction
Several NMR experiments on metallic nanoparticles have shown [1, 2, 3] quantum size effects: the absorption spectra becomes quite broad and asymmetric when either temperature or particle size diminishes. Studies of relaxation time [3] indicate that the spectra is inhomogeneous, implying phenomena of a local nature. This inhomogeneity has been interpreted [4] considering a strictly local description for the electron polarization in the presence of a magnetic field . Given the Bohr magneton, , and r, the local density of s states at the Fermi level , the local Pauli susceptibility is written as:
| (1) |
This equation expresses that, due to the finite size effects and interference phenomena proper of the mesoscopic systems, the electronic spin polarization is inhomogeneous. The hyperfine coupling between nuclear spins and electronic spins produces different shifts in the resonance frequency for each nucleus in the nanoparticle:
| (2) |
Therefore, an inhomogeneously broadened NMR absorption line is the key to indirectly measure the fluctuations of the local density of states (LDOS).
In previous works [5] we have calculated the NMR line shape in metallic nanoparticles within a Tight Binding model with orbitals accounting for the fluctuations of the LDOS. A remarkable outcome, consistent with many experimental results [1, 6], is a universal scaling behavior of the line position and shape with respect to the variation of the thermal energy and the mean spacing level . This results in a universal scaling law for the Knight shifts and the Pauli susceptibility [6] whose relevant parameter is
| (3) |
However, in very small crystalline particles, the experimental line shape presents an anomalous over-broadening at intermediate temperatures [7] . In addition, a.c. conductivity measurements show that tunneling among particles plays a relevant role in the electronic properties [8]. This suggests the need to explore for additional sources of fluctuations on the statistics of energy levels, particularly the effects of surface states. It is known that self consistent calculations of metal surfaces [9, 11] give different ionization energies for surface and bulk sites. This fact is expected both in metallic particles with clean surfaces and as well as those with chemisorbed atoms. In our previous calculation we made no attempt to consider surface states. However the natural connectivity of the surface orbitals caused slight departures from the universal scaling law [5].
In the present work we use a Tight Binding Hamiltonian with an ad hoc shift in the surface site energies [10, 11]. This produces surface states, and as a consequence, large fluctuations on the LDOS distribution. According to the Eqs. 1 and 2, this leads to a modified distribution of Knight shifts detected as a wider NMR absorption lines. We compare our calculations of the Knight shift as a function of the scaling parameter with experimental values on aluminum nanoparticles and show that the observed deviation of the scaling law is a manifestation of surface effects.
2 Model Hamiltonian
A metal particle with atoms can be modeled with the Hamiltonian
| (4) |
where is the energy of an state centered at site of a cubic lattice. is the kinetic energy involved in hopping between nearest neighbors sites and . To represent shape and crystal inhomogeneities, the sites energies are taken in the range and (Anderson’s disorder). We define surfaces sites as the sites which being at the surface of the cube, have an additional energy shift . The rest of the sites are bulk sites, even though they may belong to the faces of the cube with un-shifted site energies. This allows to model different surface to bulk ratios maintaining constant. Tunneling among particles produces an inhomogeneous broadening [12] of the atomic energy levels (i), taking its higher values at particular sites (contacts) at the surface. Assuming that and neglecting localization effects we can assume for all sites in the nanoparticle. As shown in the Ref. 4 finite temperature effects are included by an additional broadening on the energy levels, . Properties of the single particle excitation spectrum are contained in the retarded (advanced) Green’s function
| (5) |
where and are the exact eigenfunctions (molecular orbitals) and eigenenergies for the isolated particle, respectively. is a natural broadening of the electronic states and the sign corresponds to the retarded Green’s function. The local density of states per atom (LDOS) at the -th site is evaluated as:
| (6) |
from which the relevant contribution to the density of states per unit volume at the -th nucleus, is obtained. The evaluation of the local Green’s function in Eq. 5 is obtained via the Matrix Continued Fraction method [13]. Its basic idea is to exploit the short range interactions in the Hamiltonian (4) by indexing states in a way that subspaces representing layers interact through nearest neighbor subspaces. In matrix form:
| (7) |
where ’s are null matrices, ’s in the diagonal represent intra-layer interactions while the only non-zero off-diagonal matrices connect nearest neighbor layers. Detailed structure of the sub-matrices depends on the lattice, for the cubic structure , with the identity matrix. The local retarded Green’s functions connecting sites and within the -th layers are arranged in a matrix
| (8) |
where the matrix self energies and are calculated in terms of Matrix Continued Fractions (MCF) defined through the recurrence relations:
| (9) |
which are calculated with the boundary conditions: , where denotes the number of layers.
Model parameters. Parameters that model an -band are [14]: , which is consistent with a bandwidth of Ry a shift , consistent with a shift of Ry estimated for metal clusters and a Fermi energy of , which measured from the band bottom gives a ratio , close to typical values of metals [14]. In this work we use , which assumes that the main contribution to the level broadening comes from tunneling i.e. which is consistent with the conductivity measurements [8].
The statistical distribution of the LDOS is calculated taking an ensemble of ten Fermi energies in a range around For each energy ten disorder configurations are considered. Each LDOS is normalized to the bulk value , which is evaluated at the central site of a particle with orbitals. The normalized LDOS is defined as and occurs with a probability . According with Eqs. 1 and 2, is also the absorption at normalized frequency shifts: Here is the bulk metal frequency and the frequency of metal nuclei in dielectric materials (i.e. salt). Due to this correspondence, from now on, will refer indistinctly to either the distribution of the normalized LDOS at the Fermi energy or the Knight shift NMR spectrum. Quantum size effects manifest as shifts of the NMR line maximum: as the particle size or temperature decreases, the shift goes from (metal bulk) to (salt) while the line broadens and turns asymmetrical [4, 5]. It is important to emphasize that the simple model used in this work only attempts to provide physical insight into the quantum size effects as manifested in the LDOS distribution, as well as a qualitative description of surface effects.
3 Results
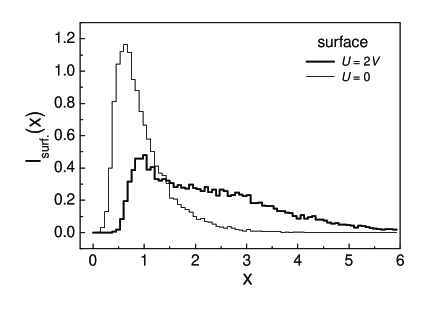
To model small surface to volume ratios proper of a big particle, the surface sites (with mean site energy ) were chosen on a single face of a cube, i.e. are surface sites and are bulk sites. In this case the ratio of level spacing is . Results for this particle can be extrapolated to an actual particle with orbitals having roughly the same surface to bulk ratio. Figure 1 shows the Knight shift spectrum obtained from the LDOS occurrence distribution at surface sites (thick line).
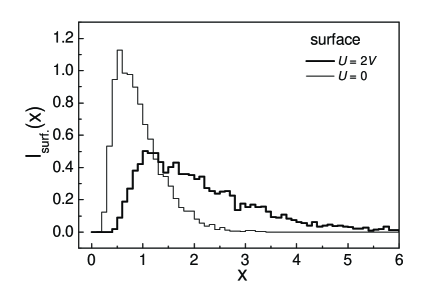
It shows that the shift in the site energies produces an over-broadening with respect to the Knight shift distribution from the same sites for the homogeneous configuration with (thin line). The over-broadening suggests the existence of multiple fluctuation scales in the NMR spectrum. To clarify this, Figure 2(a) shows the projection of the density of states (DOS) at surface sites, . It reveals two structures, one corresponding to surface sites with a typical spacing and another one with typical spacing corresponding to bulk sites. Notice that the structure of bulk states (Fig. 2.b), characterized by a mean level spacing of , enters into the surface DOS as a substructure. These bulk states have a small weight on the surface band because provides a barrier that prevents the mixing between states with the same kinetic energy () parallel to the surface.
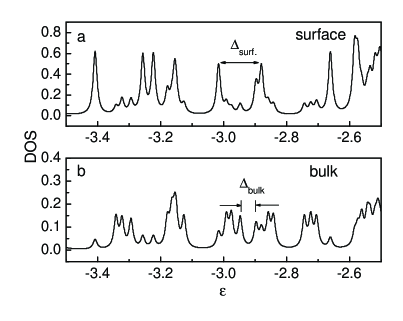
The isolated surface and bulk bands and provide a rationale to understand the structure of the surface DOS, and consequently the multiple fluctuation scales in the NMR spectrum. Typically . Within a perturbative calculation, and . The main peaks in (Fig. 2.a) arise from those in They produce a wide range of high LDOS values with low probability (tail in the , Fig. 1). The valleys of the global structure will produce lower density values with high probability (peak in the ). In the same way, the denser spectrum of the bulk band , which contributes with small weight, provides a lower scale fluctuations to .
Again, the peaks and valleys of produce an asymmetric distribution with a maximum. Therefore, the superposition of these two LDOS will cause the over-broadening in the distribution of Knight shifts for the surface sites roughly represented by:
| (10) |
Even without attempting a fitting, this shows that the predictions of numerical results are consistent with the spectral analysis.
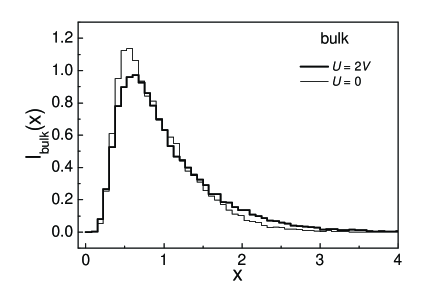
In order to evaluate the effect of surface states on bulk NMR signal of big particles, Figure 3 shows the Knight shift spectrum (thick line) for the bulk sites together with a case with unperturbed surfaces represented by the thin line. does not present much over-broadening with respect to the homogeneous configuration. The reason for this can be understood by analyzing the DOS projection on bulk sites. The relevant scale in (Fig. 2.b) is . Since surface states enter into the bulk with small weight, and since (), the relevant scale is dictated by spacing of bulk levels. Therefore, the surface band does not affect the statistics of the LDOS of bulk sites.
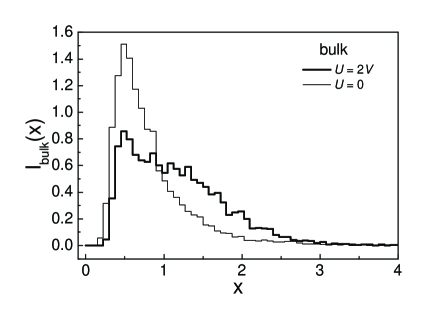
The previous analysis suggests that if the surface to volume ratio is big, as in very small particles where the over-broadening should occur on the LDOS distribution of bulk sites. The cluster configuration must be such that the surface sites are in higher proportion with respect to the bulk sites. This situation can be obtained for a structure with orbitals, taking all faces of the cube with shifted site energies ( and ). In this case . Figure 4 shows the Knight shift spectrum of bulk sites for this new configuration. The distribution (thick line) is broader than the corresponding homogeneous case (thin line). The reason is the same as the one discussed in connection with Fig. 1 provided that the relation is now inverted. However, the NMR spectrum of surface sites (Fig. 5) exhibits a considerable over-broadening, unlike the case presented in Fig. 3. This is due to the fact that, because of the topology of surface sites, completely surrounding bulk sites, there is a strong mixing between surface states and interior states, which also produces two fluctuation scales on the LDOS distribution at the surface.
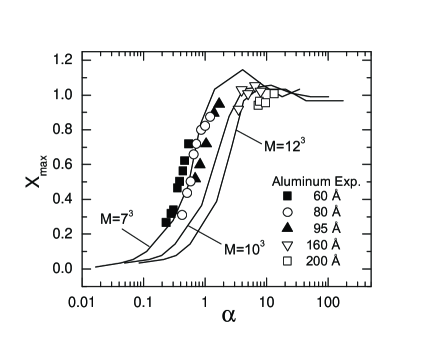
We now discuss the surface effects on the scaling law. Fig. 6 shows the relative Knight shift as a function of the scaling parameter . The solid lines correspond to our results for particles of various sizes with surface energies on all faces of the cube. These curves correspond to particles of , and sites. Experimental results by Kobayashi [15] et al on aluminum nanoparticles are also shown. The qualitative dependency of the relative knight shift with agrees very well with our result. In addition, a deviation of the scaling law is clearly observed in both, simulations and experiment. Large particles lie further to the right than small particles. This can be interpreted as follow: due to the existence of surface states, the mean spacing level at the Fermi energy is no longer , since this last spacing is defined according to the density of states of the bulk. Therefore, is no longer the scaling parameter. If we define as the mean spacing level at the Fermi energy in presence of surface states and the corresponding scaling parameter, then, according to Eq. 3, . Since bulk states and surface states become uncorrelated and consequently the repulsion of levels around the Fermi energy decreases, . Therefore, the factor counts for the deviation of the scaling law. It is smaller for smaller particles than for larger particles which is consistent with the experimental and predicted results in Fig. 6.
4 Conclusions
According to our results, we expect that the NMR spectra of either surface or bulk nuclei in small metallic nanoparticles, manifest the existence of surface states as an over-broadened line which could also be interpreted as a strong disorder. In fact, the deviation of the scaling law shown in the experiment on aluminum nanoparticles [15] is an indication of different distributions of energy spacings coming from bulk and surface states. Additionally to the over-broadening of crystalline Ni particles [7] which is consistent with this view, there are other ways in which these effects might be observed and tested: the NMR technique SEDOR (spin echo double resonance) consists of simultaneous irradiation of resonances of nuclei of two different species which are coupled either by direct dipolar interaction or through the conduction electrons. With this method the contribution to the resonance spectra of the nuclei from the surface can be inferred. A very interesting application [16] is the test of Platinum nanoparticles using Carbon as a local probe. The last is chemisorbed on the Pt surface as CO. There, the presence of a second peak in the Pt SEDOR line might be interpreted as the coexistence of surface and bulk states.
Also based on the CO chemisorption at the surface of a metallic nanoparticle, it has been observed [17, 18, 19] that Carbon NMR presents a shift toward a metallic nature. Not only the Korringa equation for the relaxation time is verified () but the line shape presents the inhomogeneity proper of quantum size effects. That is, due to the mixing between the conduction band of the metal and the CO molecular orbitals, the frequency shift of the C nuclei contains information of the LDOS on the surface nuclei . Eventually an NMR study of chemisorbed molecules also would give evidence of anomalous fluctuations in surface LDOS.
5 Acknowledgments
This work was performed in part at LANAIS de RMN (UNC-CONICET) with financial support from SeCyT-UNC, CONICOR, CONICET and FUNDACION ANTORCHAS. The authors thank discussions with V. N. Prigodin, H. B. Brom, K. Efetov, A. Bonivardi, M.V. Ganduglia-Pirovano and J. Guevara as well as correspondence with J. J. van der Klink and L. R. Becerra.
References
- [1] W. P Halperin, Rev. Mod. Phys. 58, (1986) 533; H. B. Brom, D. van der Putten and J. L. de Jongh, in Physics and Chemistry of Metal Clusters, edited by L. J. de Jongh (Kluwer Academic Publishers, Dordrecht, Netherlands, 1994).
- [2] H. E. Rhodes, P. K. Wang, H. T. Stokes, C. H. Slichter and J. H. Sinfelt, Phys. Rev. B 26, (1982) 3559.
- [3] J. P. Bucher and J. J. van der Klink, Phys. Rev. B 38, (1988) 11038.
- [4] K. B. Efetov and V. N. Prigodin, Phys. Rev. Lett. 70 , (1993) 1315.
- [5] H. M. Pastawski and J. A. Gascón, Phys. Rev. B 56, (1997) 4887; H. M. Pastawski, J. A. Gascón and E. Medina, Anal. Asoc. Quím. Arg. 84, (1996) 397.
- [6] Y. Volokitin, J. Sinzig, L. J. de Jongh, G. Schmid, M. N. Vargaftik and I. I. Moiseev, Nature 384, (1996) 621.
- [7] H. B. Brom, J. J. van der Klink, F. C. Fritschij, L. J. de Jongh, R. Della Pergola and A. Ceriotti, Z. Phys. D 40, (1976) 559.
- [8] F. C. Fritschij, H. B. Brom, L. J. de Jongh, ans G. Schmid, Phys. Rev. Lett. 82 (1999) 2167.
- [9] J. Guevara, E. Parisi, A. M. Llois, M. Weissmann,Phys. Rev. B 55, (1997) 13283; J. Guevara (private comm.)
- [10] D. Kalkstein and P. Soven, Surface Science 26, (1971) 85; J. R. Schrieffer and P. Soven, Phys. Today, 29 (4) (1975) 24.
- [11] M. V. Ganduglia-Pirovano and M. H. Cohen, Phys. Rev. B 50, (1994) 11142.
- [12] H. M. Pastawski, Phys. Rev. B 46, (1992) 4053; J.L. D’Amato and H. M. Pastawski, Phys. Rev. B. 41, (1990) 7411.
- [13] H. M. Pastawski, J. F. Weisz and S. Albornoz, Phys. Rev. B 28, (1993) 6896.
- [14] S. H. Yang, M. J. Mehl, and D. A. Papaconstantopoulos, Phys. Rev. B. 57, (1998) 2013, and references therein.
- [15] S. Kobayashi, T. Takahashi, and W. Sasaki, J. Phys. Soc. Japan 31, (1971) 1442.
- [16] C. D. Makowka, C. P. Slichter and J. H. Sinfelt, Phys. Rev B 31, (1985) 5663.
- [17] L. R. Becerra, C. P. Slichter and J. H. Sinfelt, Phys. Rev B 52, (1995) 11457.
- [18] S. E. Shore, J. P. Ansermet, C. P. Slichter and J. H. Sinfelt, Phys. Rev Lett. 58, (1987) 953.
- [19] K. W. Zilm, L. Bonneviot, G. L.Haller, O. H. Han and M. Kermarec, J. Phys. Chem. 94, (1990) 8495.