Simulated ion-sputtering and Auger electron spectroscopy depth profiling study of intermixing in Cu/Co
Abstract
The ion-bombardment induced evolution of intermixing is studied by molecular dynamics simulations and by Auger electron spectroscopy depth profiling analysis (AESD) in Cu/Co multilayer. It has been shown that from AESD we can derive the low-energy mixing rate and which can be compared with the simulated values obtained by molecular dynamics (MD) simulations. The overall agreement is reasonably good hence MD can hopefully be used to estimate the rate of intermixing in various interface systems.
Low-energy ion beams are commonly used in surface analysis and for film growth [3, 4]. The use of ion-sputtering in the controllable production of nanostructures and self-assembled nanoppaterns have also become one of the most important fields in materials science [4, 5, 6, 7, 8, 9].
The future of nanotechnology ultimately rests on the controllable fabrication, integration, and stability of nanoscale devices. However, the understanding of the fundamental phenomena leading to the formation, stability, and morphological evolution of nanoscale features is lacking [10]. As the dimensions of the surface features is reduced to the nanoscale, many classical macroscopic (continuum and mesoscopic) models for morphological evolution lose their validity. Therefore the understanding of the driving forces and laws governing mass transport involved in the synthesis and organisation of nanoscale features in solid state materials is inevitable. Unfortunately the fundamental understanding and the nanoscale control of interdiffusion is not available yet [11, 12]. In order to get more insights in the atomic relocation processes during postgrowth low-energy ion-sputtering, it is important to measure and to calculate accurately the rate of intermixing at the interface.
In this Letter we will show that using a newly developed code for simulated ion-sputtering based on molecular dynamics we are able to get mixing rates. We will also show that it is possible to extract the mixing rate data from AESD. It turns out that the agreement of the two methods is reasonably good. In this way we also could check the reliability of molecular dynamics simulations.
The Auger electron spectroscopy depth profiling analysis (AESD) [13, 14] measurements were carried out on a Cu/Co multilayer system. The sample was made by sputter deposition on polished single-crystal (111) silicon substrates in a plasma beam sputter deposition system. It was characterized by XTEM and RBS and flat interfaces have been found [14]. AESD depth profiling was carried out using a dedicated device [15] by applying Ar+ ions of energy of 1 keV and angle of incidence of with respect to the surface of the crystal (grazing angle of incidence). The sample was rotated during ion bombardment.
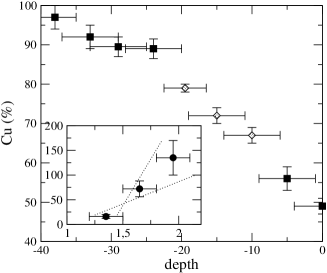
The depth profiles were measured as a function of the sputtering time keeping the bombarding ion current constant. A STAIB DESA 100 pre-retarded CMA with fixed energy resolution was used to record the AES spectra. The following AES peaks were detected Cu (60 eV), Cu (920 eV) and Co (656 eV, to avoid overlapping). A part of a typical depth profile is shown in Fig 1. For clarity only the copper is shown in Fig 1. To calculate the concentration the intensity of the copper Auger current was normalized to that of the pure copper. The depth scale was calculated from the known thickness of the sample [14].
It is generally supposed that during ion mixing the atomic movements are similar to that of the usual diffusion and thus the occurring broadening can be described by the same equations [16]. Accordingly in case of a bilayer system the concentration distribution formed due to ion bombardment of the interface by a given fluence can be described by the function. The variance, , of the function determines the extent of ion mixing. In many cases is linearly dependent on the bombarding ion fluence . In these cases the ratio called as mixing rate characterizes the mixing for a given ion bombarding condition. Important advantage of using the term mixing rate is that it can be in principle directly derived from the experiments.
In the case of AESD we measure the Auger current of the elements present. The measured Auger current depends on the in-depth distribution as follows: , where is the measurable Auger current of element , is the Auger current of element emitted by the atomic layer , and gives the attenuation of the Auger current crossing an atomic plane. , where is the concentration of element in layer , while is the number of atoms of the -th atomic plane. It is evident that in general from a single measured one cannot determine the values. On the other hand this equation can be used to simulate the measured Auger current during the depth profiling procedure if we assume an in-depth distribution.
We do not know any experimental measurement of the in-depth distributions formed during AESD applying low ( keV) ion energy. It seems, however, that dynamic TRIM simulation can reliably be used to describe AESD [17]. This calculation also provides the in-depth distribution during the procedure. It turns out that at the beginning of the depth profiling procedure, when the interface is still far from the surface the in-depth distribution can be approximated by the function. For the evaluation of the experimentally determined depth profile we will suppose that (i) the interface has an intrinsic surface roughness, which can also be approximated by an function of . (ii) ion mixing is the only process contributing to the broadening of the interface at least in the beginning part of the depth profiling, which will be studied. Thus for any measured copper Auger current we should find (the distance of the interface from the surface) and (the measured variance) values of the erf function. Then the variance due to the ion bombardment induced mixing is . We derived at three depths (indicated in Fig 1.) to be , , and . To proceed we must know the number of ions causing the broadening at the interface. In our experimental arrangement we cannot measure the ion fluence. On the other hand we can measure accurately the removed layer thickness. Taking the sputtering yield from the literature to be [14], we can derive the curve vs. fluence which is shown in inset Fig. 1. Inset Fig. 1 also
shows the two limiting slopes; thus we can derive the mixing rate being .
Classical constant volume molecular dynamics simulations were also used to simulate the ion-solid interaction (ion-sputtering) using the PARCAS code [18]. The computer animations can be seen in our web page [19]. Further details are given in ref. [18, 20, 21]. We irradiate the bilayer Cu/Co (9 monolayers, (ML) film/substrate) with 1 keV Ar+ ions repeatedly with a time interval of 5-20 ps between each of the ion-impacts at 300 K which we find sufficiently long time for the termination of interdiffusion, such as sputtering induced intermixing (ion-beam mixing) [21]. The initial velocity direction of the impinging atom was with respect to the surface of the crystal (grazing angle of incidence) to avoid channeling directions and to simulate the conditions applied during ion-sputtering.
To describe homo- and heteronuclear interaction of Cu and Co, the Levanov’s [22] tight-binding potentials are used [23]. The cutoff radius is taken as the second neighbor distance.
We randomly varied the impact position and the azimuth angle . In order to approach the real sputtering limit a large number of ion irradiation are employed using automatized simulations conducted subsequently together with analyzing the history files (movie files) in each irradiation steps. In this article we present results up to 100 ion irradiation which we find suitable for comparing with low to medium fluence experiments. 100 ions are randomly distributed over a Å2 area. The size of the simulation cell is including 62000 atoms.
Chanelling recoils are left to move outside the cell and in the next step these energetic and the sputtered particles are deleted.
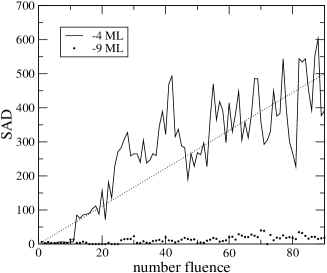
Unfortunately the realistic simulation of the layer-by-layer sputter-removal is beyond the performance of the computers available. Just to give a hint of the difficulties, the simulation of few thousands of ion impacts and subsequent relaxations should be treated. To reduce the computational demand, we carried out two types of simulations. In the first case ions are initialized from the surface (9 ML far from the interface). ions corresponds to ion/ (the removal of ML). If the ion is initialized e.g. 5 ML below the free surface (-4 ML far from the interface), than we can simulate high dose experiments, when nearly 4 ML is sputter-removed. Although, the removal of the upper 4 ML has not been done, we expect that this kind of an artificial setup of ion-sputtering can simulate the real experiment. This is because, we expect that the main source of interfacial mixing is the progressive enhancement of energy deposition at the interface with respect to the depth position of the ion-impacts.
In Fig 2 the evolution of the sum of the square atomic displacements (SAD) along the depth direction of all intermixing atoms , where is the depth position of atom at time , can be followed as a function of the number of ions. Using the relation it is possible to calculate the mixing rate () from the slope of the fitted straigh line on the vs. curve in Fig 2. The contribution of intermixed atoms to is excluded in a given layer if the in-layer concentration of them is less then %. AESD can not measure intermixed atoms which has very low concentration and which are below the treshold sensitivity of AESD. In the 2nd and 3rd Co layers below the interface we find less then and % Cu which are below the sensitivity of AESD measurements. Ion-sputtering in the 1st (-9 ML) and in the 5th (-4 ML) layers and , are obtained, respectively. The corresponding fluences are ion/ and ion/ (the artificial removal of 4 ML corresponds to ion/ using the ion/atom), respectively. It must also be noted that Cai et al. obtained using 1 MeV Si+ ions and x-rax scattering techniques in Co/Cu multilayer [24]. Since the ion mixing occur at the low energy end of the cascade process, e.g. the high energy collisional cascades split into low energy subcascades (see e.g. refs. in [20]), an agreement is expected for. We also give the measured and calculated mixing efficiencies of , where is the deposited ion-energy/depth. We get /eV both by experiment and by simulations. On the basis of this value we can characterize low-energy ion-sputtering induced intermixing in Cu/Co as a ballistic interdiffusion process.
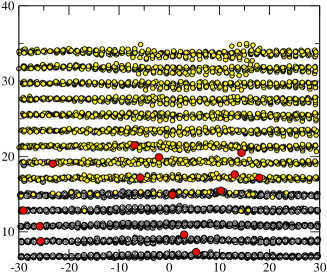
The crossectional view of the ion-sputtered system can be seen in Fig 3 as obtained by MD simulations. The interface is only weakly intermixed. The incorporated ions are also shown in Fig 3. The simulation can also be seen as an animation [19].
In this Letter we have presented that the combination of atomistic simulations with Auger electron spectroscopy depth profiling might be a new efficient method to depth profiling analysis of multilayered materials. Also, the reasonably good agreement between experiment and simulations provides us the possibility of predicting interdiffusion properties for various multilayers for which no experimental results are available.
I acknowledgement
This work is supported by the OTKA grant F037710 from the Hungarian Academy of Sciences. The work has been performed partly under the project HPC-EUROPA (RII3-CT-2003-506079) with the support of the European Community using the supercomputing facility at CINECA in Bologna. The help of the NKFP project of 3A/071/2004 is also acknowledged.
REFERENCES
- [1]
- [2]
- [3] S. E. Donnelly, R. C. Birtcher, and K. Nordlund, Engineering Thin Films and Nanostructures with Ion Beams, edited by E. J. Knystautas (Marcel Dekker, New York, 2005)
- [4] A. R. Gonzáles-Elipe, F. Yubero, J. M. Sanz, Low Energy Ion Assisted Film Growth, (Imperial College Press, Singapore, 2003).
- [5] H. H. Chen, O. A. Urquidez, S. Ichim, L. H. Rodriquez, M. P. Brenner, and M. J. Aziz, Science 310, 294 (2005).
- [6] A. I. Persson, et al., Nature Materials, 3, 677 (2004).
- [7] R. Timm, et al., Appl. Phys. Lett., 85, 5890 (2004).
- [8] S. Facsko, T. Dekorsy, C. Koerdt, C. Trappe, H. Kurz, A. Vogt, and H. L. Hartnagel, Science, 285, 1551 (1999).
- [9] L. Gómez, C. Slutzky, J. Ferrón, Phys. Rev. B71, 233402 (2005).
- [10] V.A. Schukin, N. N. Ledentsov, D. Bimberg, Epitaxy of Nanostructures, Springer (2004).
- [11] D. Adamowich, et al., Appl. Phys. Lett., 86, 211915 (2005).
- [12] P. F. Ladwig, et al., Appl. Phys. Lett., 87, 121912-1 (2005).
- [13] S. Hofmann, Prog. Surf. Sci., 36, 35 (1991).
- [14] A. Barna, M. Menyhard, G. Zsolt, A. Koos, A. Zalar and P. Panjan, J. Vac.Sci. Tech. A21, 553 (2003).
- [15] A. Barna and M. Menyhard, Phys.Stat Sol. (a) 145, 263 (1994).
- [16] W. Bolse, Mat. Sci. Eng. A253, 194 (1998).
- [17] M. Menyhard, Surf. Interface Anal. 26, 100 (1998).
- [18] K. Nordlund, Comput. Mater. Sci, 3, 448. (1995).
- [19] P. Süle, http://www.mfa.kfki.hu/sule/animations/cuco.htm.
- [20] P. Süle, M. Menyhárd, Phys. Rev., B71, 113413 (2005).
- [21] P. Süle, M. Menyhárd, K. Nordlund, Nucl Instr. and Meth. in Phys. Res., B226, 517 (2004).
- [22] N. Levanov, V. S. Stepanyuk, W. Hergert, O. S. Trushin, K. Kokko, Surf. Sci., 400, 54 (1998).
- [23] F. Cleri and V. Rosato, Phys. Rev. B48, 22. (1993),
- [24] M. Cai, et al., J. Appl. Phys., 95, 1996 (2004).
- [25]