Finding the structure of phosphorus in the phase IV
Abstract
We have explored the unknown structure of the phosphorus in the phase IV (P-IV phase) based on the first-principles calculations using the metadynamics simulation method. Starting from the simple cubic structure, we found a new modulated structure of a monoclinic lattice. The modulation is crucial to the stability of the structure. Refining further the structure by changing the modulation period, we have found the structure which shows the X-ray powder pattern in the best agreement with the experimental one. We can not exclude the possibility that the unknown structure of the phase IV of phosphorus is an incommensurately modulated one.
pacs:
61.50.Ah,62.50.+p,64.70.KbRecent progress in high-pressure physics strengthened our recognition on the variety of structures of materials. Unexpectedly interesting structures were found in the high-pressure experiments. The modulated structure is one of curious structures often found in the high-pressure phases of elements. Improvement of the high-pressure techniques has also made it possible to specify the structure stabilized only in a narrow pressure range. The modulation of a crystal was found in the group Vb elements including As, Sb and Bi McMahon et al. (2000); Shwartz et al. (2003) and in group VIb elements including S Hejny et al. (2005), Se McMahon et al. (2004) and Te Hejny and McMahon (2003). Modulated structures were also reported in halogens, I Takemura et al. (2003) and Br Kume et al. (2005).
Non availability of sufficient experimental data under very high pressure constrains high pressure study. There, people often encounter difficulties in determination of the lattice structure only from the experimental data. The theoretical approach gives alternative information on the same problem, where accuracy in the determination of a crystal structure is known to be enough, if one utilizes the first-principles calculation. However, limitation in computational resources sometimes prohibits us to perform full search of the true structure.
The phase IV of the phosphorus (P-IV) is one of the examples in which the structure has not been determined. Observation of the phase was first reported by Akahama et al. Akahama et al. (1999) in 1999. They showed an appearance of the simple hexagonal (sh) phase, i.e. the phase V (P-V), which is stabilized above 137GPa. The third phase (P-III) appearing in the sequence of pressure-induced transformations at low temperatures is the simple cubic (sc) phase. As an intermediate phase between sc and sh, the P-IV was detected in the X-ray diffraction data. Experimentally, however, the structure has not been identified. The ordinary Rietveld analysis starting from the knowledge only of the monoclinic symmetry has not been successful owing to a probable complexity of the lattice. The bcc structure (phase VI) is theoretically predicted Hamada et al. (00) and identified at even higher pressure 262GPa Akahama and Kawamura (00). We need a guess of the lattice structure or a pseudo crystal.
Several structures have been tested as candidates for the P-IV. Ahuja considered a structure of space group Imma Ahuja (2003). Ehlers and Christensen studied relative stability of Ba-IV structure of P, which is a kind of modulated structure, in the pressure range from 100 to 200 GPa Ehlers and Christensen (2004). In spite of these intensive studies, the structure of the P-IV has not been identified.
To explore the P-IV, we adopted the following strategy in our theoretical study and used the metadynamics simulation in the first-principles calculations. This trial was done with a relatively small simulation cell to reduce the computational time. The simulation was planned, however, to be able to detect possible signal of the structural phase transformation. For the obtained structure, we checked the relative stability against the sc and sh phases. Next we considered some model structures to find more refined structure. The structural optimization was done for each model structures. The calculated X-ray powder patterns of the optimum structure are compared with that of the experimental one.
In the study of the metadynamics simulation, which was first introduced by Laio and Parrinello Laio and Parrinello (2002); Martoňák et al. (2003), we use the Gibbs free energy (GFE) depending upon a shape of a simulation cell. Following the prescription by Martoňák Martoňák et al. (2003), we consider the GFE, , where is the artificial potential defined by the following Gaussian-type function,
| (1) |
The superscripts and denote the current meta-step and the previous one, respectively. The quantities and represent the weight and the width of the Gaussian-type function, respectively. The matrix is defined by the vectors defining the simulation cell and , where , and are lattice vectors. To eliminate the free rotation of the system, only the symmetric part of the matrix is updated, which reduces the number of the independent variables to 6.
The update of the matrix is made by the steepest descent method using the driving force and regarding as stepping parameter. The driving force is obtained as the sum of the original driving force , and the Gaussian driving force . The force can be expressed by an internal pressure tensor , external pressure , and the matrix Martoňák et al. (2003). One step of updating is defined as one meta-step.
At each meta-step, in order to equilibrate the system and to estimate , the conventional molecular dynamics (MD) simulations have to be done with the shape of the simulation cell fixed. The internal pressure tensor and the atomic positions at each meta-step can be taken from the output of any constant-pressure MD codes of the first-principles calculation Baroni et al. .
The above artificial potential means that if the current has been visited time after time, which occurs when the system is fluctuating around the local minimum of the GFE surface, accumulates to a large value and the well is gradually filled with the artificial potential .
For the simulation of phosphorus, we used the density functional theory in a local density approximation and a norm-conserving pseudopotential, where we employed the expression of Perdew and Zunger Perdew and Zunger (1981) for the exchange and correlation energy functional. We checked the pseudopotential comparing the calculated equation of states with the experiments in other phases Akahama et al. (1999); Akahama and Kawamura (00); Hamada et al. (00). We started with the cubic simulation cell whose edge was 4.26 Å and 8 phosphorus atoms are set at the positions which make the sc lattice. We performed the k-space integration using 8 8 8 mesh points in the first Brillouin zone and set the energy cut-off of the plane wave basis at 40 Ry. We set the external pressure at 120 GPa in the conventional constant-pressure MD, since the P-IV is observed at this pressure. In order to equilibrate the system, we ran this MD simulation for 200 steps at each meta-step and we calculated the average internal pressure tensor from the latter half of 100 steps. In order to perform this metadynamics simulation, we used the cluster machines.
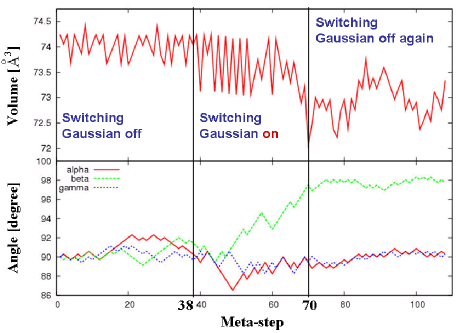
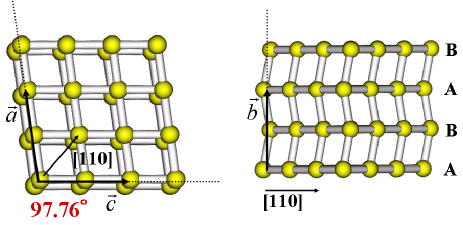
Figure 1 shows the evolution of the cell volume and the three angles among the lattice vectors of the simulation cell. First we ran the simulations with the Gaussian potential off, by setting 0 mRy, for 38 meta-steps in order to check whether the sc structure is stable or not. During these initial meta-steps, the values of the angles and the volume were nearly maintained at those of the sc lattice. This means that the sc structure resides on a local minimum and it is separated from the other local minima by some barriers. We note that the metadynamics simulation with the Gaussian-type potential switched off is nearly equivalent to the conventional variable-cell MD simulations.
In order to explore the metastable structures beyond the potential barrier we switched the Gaussian-type potential on at 39th meta-step with of 1 mRy and of 20 mÅ. As a result, one of the three angles started to increase after around 50th meta-step and the volume began to decrease dramatically. After those changes, we switched the Gaussian-type potential off at 71st meta-steps again in order to check whether the system had already surmounted the barrier and had moved to a neighboring local minimum. If the system had not crossed the barrier yet, the angle and the volume would have returned to the starting values of the sc lattice, which are approximately and 74 Å3, respectively. After 71th meta-step, however, the volume fluctuated around 73 Å3 and three angles also continued to fluctuate around , and . This behavior shows that the sc structure transformed into another metastable one.
Figure 2 shows the structure obtained by the above run, where , and are the lattice vectors of the simulation cell. This structure has a unit cell with the lattice parameters Å, Å, Å, , and . The left hand side figure is the projection onto the plane. It shows the distortion of the simulation cell from the cubic into the cell with an angle . When we look the lattice from a side, we find a zigzag modulation of the plane along the -axis with displacement in the direction of [110] as is shown in the ABAB.. in the right hand side figure. This is an important feature. The ABAB modulation pattern is crucial for the stability of the distortion of the angle . When we removed the zigzag modulation pattern and performed the simulation for the relaxation of the structure, we observed that the structure returned to the initial sc structure.
| Structure | Total energy [Ry/atom] |
|---|---|
| M1 | -13.1624 |
| M2 | -13.1638 |
| M4 | -13.1642 |
| M8 | -13.1637 |
The structure obtained by the metadynamics is a modulation pattern with period consisting of two planes. Our simulation, however, was performed using the system with 8-atoms in a simulation cell, and with the periodic boundary condition. Hence there remains a question that the small simulation cell may limit the modulation period to a shorter one. In fact, the X-ray powder pattern of the zigzag modulated structure and that of the experimental one show some discrepancies. To answer this question, we tried some more first-principles calculations for the refinement of the structure.
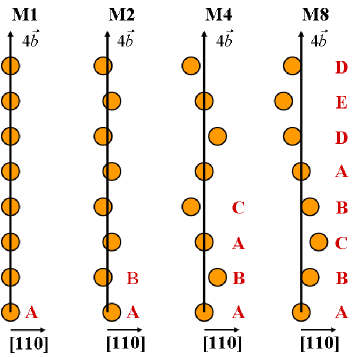
We extended our study to two more structures which have commensurate modulations: an ABAC and an ABCBADED. The modulation period of the ABAC and that of the ABCBADED are twice and four times as long as that of the ABAB, respectively. These structures are denoted as M4 and M8 and shown in Fig. 3. The pattern M1 is a non-modulated structure, and M2 is the structure obtained by the metadynamics simulation. We calculated the total energies and the X-ray powder patterns.
To compare the total energy among these structures, we used the same unit cell with the lattice vectors, , and , where , and are those of the simulation cell obtained by the metadynamics simulation. The 8 atoms were located only along the axis in the unit cell with displacements corresponding to the modulation pattern (Fig. 3). This choice of the unit cell avoids the numerical errors coming from the use of the different size of the unit cells. For the k-space integration, we used 16 4 16 mesh points in the first Brillouin zone. Amplitude of modulation for each structure was optimized by the relaxation of the atomic positions.
Calculated total energies are listed in Table 1. All modulated structures, M2, M4, and M8 have lower energy per atom than the unmodulated structure, M1, which shows any modulation periods from M2 to M8 are more favorable than the M1. Among the above three modulated structures, the energy of the M4 is the lowest in our study of the commensurate approximation. Though the enthalpy of the M4 is very close to that of the sc, it is in fact lower than that of the sc at 120GPa, according to our results. If we plot the total energy as a function of the modulation period and optimize the period as was done by Ehlers et al. Ehlers and Christensen (2004), an incommensurately modulated structure is expected.
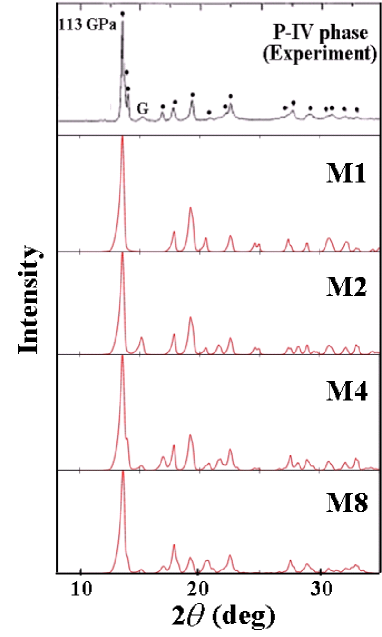
In figure 4 we compare the X-ray powder patterns of our structures with that of the experimental one. The experimental pattern of the P-IV (top figure) was obtained from Akahama et al.’s Akahama et al. (1999). It shows the feature that the splits of the strongest peak at and the three peaks in the range from to are observed. In our M2 structure, these features are missing and unnecessary peaks exist at and . However, this disagreement is much improved with increase of the modulation period. Intensities of the unnecessary peak at in the M2 structure, which was brought about by the zigzag modulation, and another unnecessary one at in the same M2 structure, which appeared owing to the distortion of the simulation cell from the cubic, are decreased in the M4 and M8 structures and the split of the strongest peak appears also in the M4 and M8 structure. About the intensity of the three peaks in the range from to , the X-ray powder pattern of the M4 shows most improved agreement with the experimental one among the 4 patters studied. From the comparison of the total energies and the X-ray powder patterns, we conclude that the modulation period is close to that of the M4 structure in the P-IV.
In this study, we explored the structure of phosphorus in the phase IV using the first-principles metadynamics simulation and identified the new structure. This structure is the monoclinic with the modulation pattern. Furthermore we found the refined structure showing the best agreement with the X-ray powder pattern. Although we have not fully studied the possibility of the incommensurate modulation, we conclude that phosphorus takes the modulated structure with possible incommensurate modulation. The simple idea of Akahama et al. Akahama et al. (1999) stating that the structure of the P-IV may be on the path from the sc to sh via monoclinic distortion along the [110] direction is partly supported because the unmodulated structure is of space group and of one atom per unit cell. The structure of the P-IV is not so complicated as one suggested by and Ehlers et al Ehlers and Christensen (2004). The modulation stabilizes the monoclinic distortion of the lattice. It is highly probable that the Vb, VIb, and VIIb group elements commonly show modulated structures in a narrow pressure range when they undergo the pressure induced structural transition between simple stable structures.
Acknowledgements.
The authors thank Dr. Nakamoto and Dr. Morimoto for valuable discussion on the X-ray powder patterns. Computations were done on the machines at the Institute for Molecular Science, Okazaki, Aichi, Japan. This work was partially supported by a Grant-in-Aid for Scientific Research in Priority Areas “Development of New Quantum Simulators and Quantum Design” (Nos.17064006 and 17064013) and by a Computational Nanoscience program “-Grid Application Research in Nanoscience-National Research Grid Initiative (NAREGI)” of The Ministry of Education, Culture, Sports, Science, and Technology, Japan.References
- McMahon et al. (2000) M. I. McMahon, O. Degtyareva, and R. J. Nelmes, Phys. Rev. Lett. 85, 4896 (2000).
- Shwartz et al. (2003) U. Shwartz, L. Akselrud, H. Rosner, A. Ormeci, Y. Grin, and M. Hanfland, Phys. Rev. B 67, 214101 (2003).
- Hejny et al. (2005) C. Hejny, L. F. Lundegaard, S. Falconi, and M. I. McMahon, Phys. Rev. B 71, 20101 (2005).
- McMahon et al. (2004) M. I. McMahon, C. Hejny, J. S. Loveday, and L. F. Lundegaard, Phys. Rev. B 70, 54101 (2004).
- Hejny and McMahon (2003) C. Hejny and M. I. McMahon, Phys. Rev. Lett. 91, 215502 (2003).
- Takemura et al. (2003) K. Takemura, K. Sato, H. Fujihisa, and M. Onoda, Nature 423, 971 (2003).
- Kume et al. (2005) T. Kume, T. Hiraoka, Y. Ohya, S. Sasaki, and H. Shimizu, Phys. Rev. Lett. 94, 065506 (2005).
- Akahama et al. (1999) Y. Akahama, M. Kobayashi, and H. Kawamura, Phys. Rev. B 59, 8520 (1999).
- Hamada et al. (00) I. Hamada, T. Oda, and N. Suzuki, XXXXXXX nn, **** (00).
- Akahama and Kawamura (00) Y. Akahama and H. Kawamura, Phys. Rev. B 61, 3139 (00).
- Ahuja (2003) R. Ahuja, Phys. Status Solidi B 235, 282 (2003).
- Ehlers and Christensen (2004) F. J. H. Ehlers and N. E. Christensen, Phys. Rev. B 69, 214112 (2004).
- Laio and Parrinello (2002) A. Laio and M. Parrinello, Proc. Natl. Acad. Sci. U.S.A. 99, 12562 (2002).
- Martoňák et al. (2003) R. Martoňák, A. Laio, and M. Parrinello, Phys. Rev. Lett. 90, 75503 (2003).
- (15) S. Baroni, A. D. Corso, S. de Gironcoli, and P. Giannozzi, eprint We used the PWSCF code which is available from: http://www.pwscf.org/ .
- Perdew and Zunger (1981) J. P. Perdew and A. Zunger, Phys. Rev. B 23, 5048 (1981).
- Izumi and Ikeda (2000) F. Izumi and T. Ikeda, Mater. Sci. Forum 321-324, 198 (2000).