Can buckling account for the features seen in graphite’s Raman spectra?
Abstract
Raman scattering data were collected on graphite monochromator. Spectra were interpreted in terms of the space group , a subgroup of space group . The latter has commonly been used for the interpretation of Raman scattering data. Space group corresponds to the buckling of graphene sheets and is consistent with many spectral features. Both the first and second order scattering were considered. Many first order results (most notably the assignments of the band at 1350 and the peak at 1620 cm-1) were found to agree with previous observations [Y. Kawashima and G. Katagiri, Phys. Rev. B 66, 104109 (2002)] carried out on highly oriented pyrolytic graphite samples. To check the consistency of the model, symmetry analysis was applied to the second order spectra. Also a simple test for buckling model was done.
I Introduction
Despite its nominally simple crystal structure the interpretation of the Raman and infrared spectra of graphite has been an active and controversial topic. The crystal symmetry of graphite is reported to be either (No. 194) or (No. 186) Wyckoff . A more rare form, with rhombohedral space group symmetry (No. 166) was also reported in ref. Wyckoff, . The symmetries of these different forms increase in order : these symmetry groups share group-subgroup relationships. It is well known that, despite its virtually simple structure, a large number of features which seem to contradict the space group symmetry , have been observed in Raman spectra Reich . Partially the problem has been that rather different types of ’graphites’ were studied, as far as crystallite size and defects are considered. Despite that Raman spectra were commonly interpreted in terms of space group .
Still, the puzzling features of the Raman spectra of graphite are (i) the peak(s) at around 1355 cm-1 (often labelled by ), (ii) peak at around 1620 cm-1 (often labelled by ) (iii) the first overtones of the aforementioned modes (often labelled by and , respectively). If symmetry is assigned to graphite, the Brillouin zone centre modes transform as the irreducible representation (IRREP) , where and representations are infrared active, is silent and is the only Raman active representation. Thus, only two peaks, observable at , , and geometries, are expected (i.e., modes can only be observed if the polarization vectors of both the incoming and scattered light are perpendicular to the hexagonal axis). They were reported to appear at 42 and 1580 cm-1 (the latter is commonly labelled as ’G’ mode) Sinha . However, the number of observed peak is generally greater. Now, it is interesting to note that in the case of symmetry the Brillouin zone centre modes transform as the IRREP , where and symmetry modes are Raman and infrared active, mode is silent and mode is Raman active.
The first attempt to explain the band were based on disorder, which was interpreted to cause an appearance of a totally symmetric mode Tuinstra . As is discussed below, this mode(s) is not totally symmetric and its origin is still not clear. Recent explanations are based on double resonance idea Thomsen ; Reich ; Saito . The merits of the double resonance model are its ability to take the laser beam wavelength dependent positions of and bands into account. The first attempt to explain the band were based on an idea that, due to the disorder, a Raman inactive mode became active Tuinstra . The intensity of this mode was reported to be dependent on particle size Tuinstra . In addition, the frequency of this mode was reported to increase with increasing laser light frequency Vidano . The corresponding changes occurred in the first overtone of the band. To explain these features a double resonance Raman scattering model was developed Thomsen ; Reich ; Saito . Several weak peaks were observed in Raman spectra, the most notable at 867 cm-1, which was reported to correspond to the out-of-plane vibration Kawashima1 ; Kawashima2 . This model assumes that the and bands are transverse optic Brillouin zone boundary ( point) and zone centre near Brillouin zone centre modes. The double resonance model further necessitates that the atom displacements occur in graphene sheets (in-plane vibrations) Thomsen . Occasionally, double resonance theory has been merited to take the slight difference in the anti-Stokes and Stokes positions into account. In this context once should bear in mind that, in order to observe the high frequency overtones in anti-Stokes spectra, exceptionally high laser beam power densities were used in these studies (the highest powder densities were approximately 5000 times larger than the one used in this study) Tan1 . Although this type of considerations are interesting, we note that, in the case of the anti-Stokes spectra, the reported differences between the Stokes and corresponding anti-Stokes frequencies were, for different modes, positive, almost zero and negative, as was pointed out in ref. Tan1, .
The purpose of this work was to reinvestigate a high quality graphite sample by Raman scattering technique. The first goal was to check if the buckling model can explain the first and second order spectra. The second goal was to consider to which extent the proposed double resonance model is consistent with the observed symmetry properties of and bands.
II Experimental
A pyrolytic graphite monochromator (Advanced Ceramics) sample was used in this study. Raman measurements were performed using a Jobin-Yvon T64000 spectrometer consisting of a double monochromator coupled to the third monochromator stage with 1800 grooves per millimeter grating (double substractive mode). Prior to measurements, spectrometer was calibrated with Ne lamp. Acquisition time was adjusted to have a sufficient signal-to-noise-ratio. CCD detector was used to count photons. Backscattering measurements were carried out under the microscope. Also 90-degree scattering angle experiments (the angle between the incoming and scattered light was 90 degrees) were carried out. Raman spectra were excited using an argon ion laser. In the case of backscattering experiments, the laser beam power on the sample surface was 200 W and the diameter of the laser beam spot was approximately 2 m (the spot diameter was approximately 100 m in 90-degree scattering angle measurements, and the power was 50 mW, so that the powder density was smaller than in the case of backscattering measurements). In a backscattering geometry the wavelength was 514.532 nm and in a -degree scattering angle measurements it was 487.986 nm.
III Results and discussion
Selected regions of Raman spectra collected on -basal plane with an polarizer set parallel (labelled as ) and perpendicular (labelled as ) with respect to the incoming polarization direction are shown in Fig. 1 (a), (b) and (c). Particular attention was paid on the , , , , and modes. Here and refer to the incoming and scattered light propagation direction. Although the light propagation direction can be rather accurately determined at backscattering geometries, incoming light polarization direction with respect to hexagonal and axes was not known. The corresponding regions, obtained through right-angle geometry, are shown in Fig. 1 (d), (e) and (f).
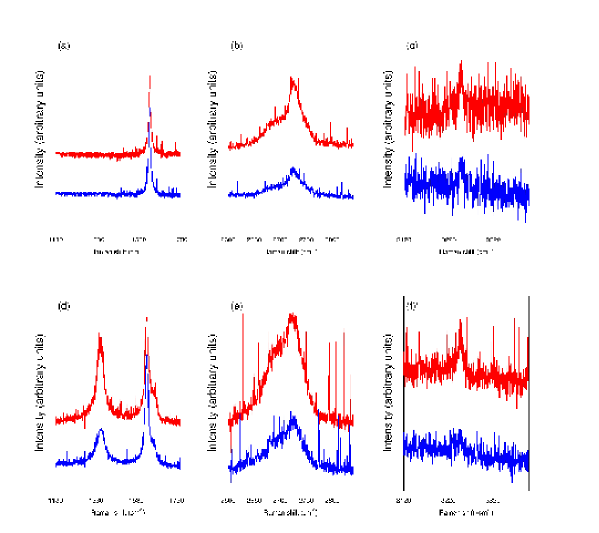
The intensity of mode at around 1580 cm-1 was the same for and geometries (see Fig. 1 (a)), consistently with the idea that it belongs to the symmetry (space group ) or symmetry (space group ). In contrast to the earlier reports (see, e.g., ref. Sinha, ), we could not see any other mode below 1580 cm-1. Fig. 1 (b) shows the broad band centered at around 2750 cm-1. We note that this band is consisted of several peaks and the intensity differs from zero in , , and geometries. Now, it is of interest to consider the symmetries of the first overtones (second order scattering) in the case of the fundamentals belonging to the point group symmetries and . Only two-dimensional IRREPs need to be considered, since the first overtone of a one dimensional IRREP is always totally symmetric and can be distinguished by depolarization measurements. Now, the first overtone of the , , and modes transform as and the first overtone of the mode transforms as . Thus, if this band is due to the second order scattering of the Brillouin zone centre mode, it must belong to (space group ) or to symmetry (space group ). To check if either assignment is correct two other experimental geometries were used. First one is the geometry where light propagates perpendicularly to the hexagonal -axis, Fig. 1 (d)-(f). Consistently, mode was significantly weaker (if the polarization direction of the incoming or scattered light is strictly parallel to the hexagonal axis, the mode should have zero intensity. Deviations might be because of the folding of graphene sheets). The appearance of the mode at around 1355 cm-1 is consistent with the space group . Basically, if this mode belongs to the symmetry, it should only be observed at the and geometries. Thus, this mode should not be observable at geometry, in constrast to the experimental observations. Although partially this might be due to the aforementioned folding we decided to carry out 90-degree measurements.
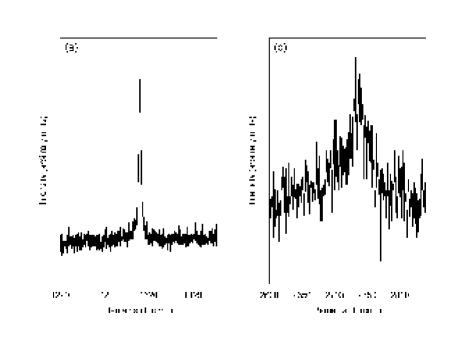
If the buckling model alone is sufficient for explaining the appearance of and bands (instead of the disorder, which activates non-Brillouin zone centre modes), one should see them at 90-degree measurements carried out on large graphene sheets (so that the effect of disorder as a dominant factor can be eliminated). Now, the phonon propagates parallel to the graphene sheet, by momentum conservation rule. The mode was observed (Fig. 2), since both the incoming and right-angle scattered light have a polarization component parallel to the plane. The more interesting point is that now also the modes belonging to the symmetry modes should be observed. Thus, this experiment served as a test to clarify whether and/or modes are due to the Brillouin zone centre modes or if they correspond to the disorder activated modes. As Fig. 2 reveals, and bands were not observed, but was observed.
Rather common opinion is that mode is related to the Brillouin zone point mode (sometimes assigned to the totally symmetric mode), whereas mode has sometimes been considered to belong to symmetry with wavevector close to zero (Brillouin zone centre), see for example ref. Reich, . Now, the problem is that these assignments do not comfort with the polarization measurements. The first overtone of these modes should also be totally symmetric, in contradiction with the experiments. Now, the selection rules for phonons which can participate on double resonance scattering state that only totally symmetric modes can resonantly couple electrons within the same non-degenerate bands Reich . The second possibility is that the phonon involved in the process should belong to the symmetry.
IV Conclusions
The Raman spectra collected on graphite monochromator were interpreted in terms of two space group symmetries. The only observed first order lines were mode, and and modes. It was concluded that although the weak, additional lines reported in literature probably do correspond to the buckling of graphene sheets, the and modes are probably not due to the buckling. The latter feature was confirmed by -degree angle experiments. However, the situation is different for smaller crystal size materials. It was also confirmed that and modes do not belong to the totally symmetric representation.
References
- (1) R. W. G. Wyckoff Crystal Structures (John Wiley and Sons, New York, London, 1963).
- (2) S. Reich and C. Thomsen, Phil. Trans. R. Soc. Lond. A 362, 2271 (2004).
- (3) K. Sinha and J. Menéndez, Phys. Rev. B 41, 10845 (1990).
- (4) F. Tuinstra and J. L. Koenig, J. Chem. Phys. 53, 1126 (1970).
- (5) R. P. Vidano, D. B. Fischbach, L. J. Willis and T. M. Loehr, Solid State Commun. 39, 341 (1981).
- (6) C. Thomsen and S. Reich, Phys. Rev. Lett. 85, 5214 (2000).
- (7) R. Saito, A. Jorio, A. G. Souza-Filho, G. Dresselhaus, M. S. Dresselhouse and M. A. Pimenta, Phys. Rev. Lett. 88, 027401 (2002).
- (8) P. Tan, Y. Deng and Q. Zhao, Phys. Rev. B 58, 5435 (1998).
- (9) Y. Kawashima and G. Katagiri, Phys. Rev. B 52, 10053 (1995).
- (10) Y. Kawashima and G. Katagiri, Phys. Rev. B 66, 104109 (2002).