Anomalous electronic Raman scattering in
Abstract
Raman scattering experiments on single crystals show a broad electronic continuum with a pronounced peak around 100 and a cutoff at approximately 560 over a wide range of doping levels. The electronic Raman spectra in superconducting and non-superconducting samples are similar at room temperature, but evolve in markedly different ways with decreasing temperature. For superconducting samples, the low-energy spectral weight is depleted upon cooling below K, indicating a opening of a pseudogap that is not present in non-superconducting materials. Weak additional phonon modes observed below suggest that the pseudogap is associated with charge ordering.
pacs:
72.80.Ga, 75.30.-m, 71.30.+h, 78.30.-jThe hydrated cobaltate has recently been in the focus of research on correlated electron systems, because it enables investigations of the relationship between superconductivity (SC) takada03 and magnetic ordering on a triangular lattice jorgensen03 ; lynn03 . Electronic correlations can be tuned either by changing the Na content, leading to long-range antiferromagnetic order for ( K) motohashi03 ; bayrakci04 and a metal-insulator transition at x=1/2 huang04 ; hwang04 , or by hydration leading to superconductivity takada03 ; schaak03 in Na-poor samples with and .
For Na-rich cobaltates, angle-resolved photoemission experiments hasan04 ; yang04 show a large hole-like, hexagonal Fermi surface dominated by Co states of symmetry singh00 ; koshibae03 ; johannes04 . Several anomalies are observed in this doping range and for temperatures below approximately 150 K. Among them are a break in a weakly dispersing quasiparticle band at an energy of 70 meV 560 , which was attributed to a bosonic mode of electronic or lattice origin hasan04 ; yang04 ; a T-linear resistivity; a colossal thermopower wang03 ; an anomalous linear frequency/energy dependency of the electronic scattering rates caimi05 ; and a polaronic mode bernhard04 . With increasing temperature the low-energy quasiparticle peaks broaden substantially and become incoherent hasan04 ; yang04 . Under such circumstances the nested Fermi surface with a flat-band feature is expected to be susceptible to electronic instabilities, and indeed charge ordering has been reported around x0.5 ning04 . Furthermore, SC states with unconventional/anisotropic order parameters may be expected johannes04 ; tanaka03 ; baskaran03b ; motrunich04 . It is therefore important to note that in Na-poor, but still non-hydrated cobaltates (x0.3), charge is more delocalized and the Fermi liquid character of the quasiparticles appears to be recovered with noticeable mass enhancement hasan04 .
However, very little spectroscopic information has thus far been reported on hydrated, SC cobaltates. Here we report the observation of pronounced electronic Raman scattering (RS) over a wide range of doping levels comprising the SC regime of the phase diagram. This feature uncovers strong carrier scattering by bosonic modes, similar to that observed in underdoped high temperature cuprates. The electronic RS continua in SC and non-SC samples are similar at room temperature, but evolve in a markedly different way as the temperature is lowered. Specifically, a pseudogap opens up below K in SC, but not in non-SC samples. Weak additional phonon modes observed below T∗ indicate that the pesudogap may be associated with charge ordering.
Single-crystal samples were prepared in an optical travelling-solvent floating-zone furnace chen04 ; chou04 . This is to our knowledge the first systematic RS study of such single crystals that are advantageous due to their easy cleavability and size note . The experiments (=514 nm, 6 mW, =100m diameter laser focus with parallel, in-plane light polarization) were performed in quasi-backscattering geometry on the ab surface of freshly cleaved single crystals. After cleavage, the samples were instantaneously cooled down in He contact gas, in order to prevent dehydration foo03 or Na ordering at elevated temperatures huang04 ; zandbergen04 . We present RS data on four well characterized samples: Three non-SC samples with and , 0.83, and 1, and one SC sample with and .
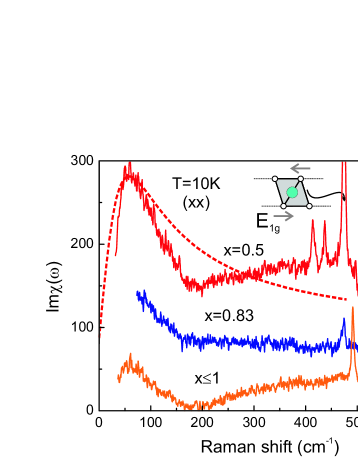
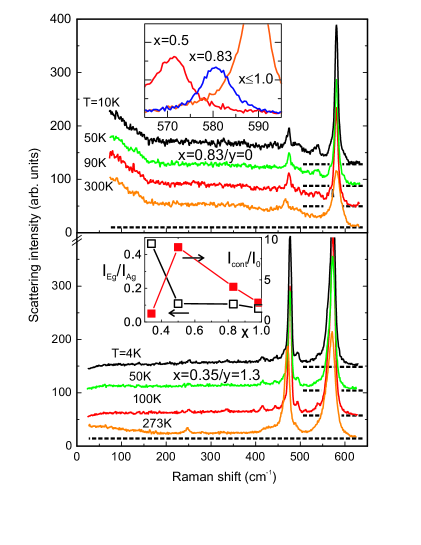
Figure 1 shows the low temperature RS response (the measured RS cross section corrected for the Bose thermal population factor) of three non-SC samples with Na content , 0.83, and . All spectra show two strong phonon modes around 580 and 480 , which can be attributed to Raman-active out-of-plane and in-plane vibrations, respectively, of oxygen in the octahedra iliev03 ; lemmens04b . The eigenvectors are shown as insets in Fig. 1. (Co sites do not contribute to Raman-active lattice vibrations due to their inversion site symmetry.) The sharpness of the higher-frequency mode, whose frequency softens systematically with decreasing x (inset in Fig. 2), testifies to the homogeneity of the samples. The sample with , for which Na ordering and a metal-insulator transition have been reported huang04 ; hwang04 , shows additional modes at 413, 437, and 497 , close to the energy of the in-plane phonon. This demonstrates the sensitivity of this phonon to structural and electronic ordering processes. In contrast, the sample with exhibits weak modes around 485 and 540 that might be due to an admixture of inter-plane polarizations, attributable to an mode involving both Na and O motions. Further, note that no anomalous behavior of the phonon modes is observed in frequency and temperature beyond lattice anharmonicities.
The most striking aspect of the spectra shown in Fig. 1 is a continuum with a pronounced, broad peak around . Above the peak, the intensity levels off, and a plateau extends up to about 550 . Since the crystals are of high quality and show sharp phonon spectra, phonon density-of-states effects can be ruled out as the origin of the continuum. The upper cutoff of the continuum remains at roughly the same energy of 550 irrespective of Na contents. This is in excellent correspondence with the width of the quasiparticle band determined by photoemission spectroscopy hasan04 ; yang04 as well as with the knee in the reflectance seen by optical spectroscopy hwang04 . We hence attribute our observations to electronic RS. Noticeably, the continuum intensity increases nearly monotonically with increasing hole hoping, corresponding to decreasing Na content (lower inset in Fig. 2). This effect corresponds to the increase of the Fermi surface with hole doping that fulfills the Luttinger theorem yang04 . Deviation seen in the SC sample will be discussed below.
Figure 2 shows in the upper panel the temperature evolution of the RS intensity of antiferromagnetic (=19.8 K). The data are intentionally presented as raw, non-Bose corrected RS intensity. The weak temperature dependence of the spectra demonstrates that the temperature dependence of the RS scattering cross section approximately compensates the Bose thermal population factor. The lower panel displays electronic Raman scattering in the superconducting sample of composition and superconducting transition temperature =4.6 K. The overall shapes of the continua are similar at room temperature.
A similar temperature dependence has been observed in RS on high temperature superconductors. The nearly flat, frequency- and temperature-independent continuum has been discussed in the framework of a marginal Fermi liquid state with a linear dependence of the scattering rate on temperature and energy/frequency varma89 . Thus, the unusual temperature dependence of the RS appears to be a consequence of strong electronic correlations as in the high-Tc cuprates. A linear temperature dependence of the scattering rate has also been observed in IR and photoemission experiments on cobaltates hasan04 ; caimi05 . However, there is some important difference. In the cuprates both the electronic RS and the anomalous IR reflectance extend to 0.75 eV. In contrast, the electronic RS of the cobaltates is strongly restricted to a low-frequency region below ( eV). Notwithstanding the generally smaller energy scale, this implies that the observed RS in the cobaltates strongly relies on a mode having an energy scale of . Remarkably, photoemission and IR spectroscopy measurements give evidence for a bosonic mode of electronic, lattice, or magnetic origin in the same energy range hwang04 ; hasan04 ; yang04 . Although further work is necessary to pin down its exact origin, it is clear that the interaction of charge carriers with a bosonic mode puts constraints to their scattering frequency range. This might be responsible for the low transition temperature in the cobaltates.
We will now focus on the sharply enhanced scattering seen below . This energy scale corresponds to the temperature scale at which the quasiparticle dynamics observed by photoemission becomes incoherent. At low frequencies, the lineshape of the RS response of metals and semiconductors can often be approximated by a Lorentzian as function of frequency and electronic scattering rate : zawadowski90 . This form provides a reasonable description of the broad low-frequency peaks in the non-hydrated samples (Fig. 1) with a single, frequency independent scattering rate , not strongly dependent on doping.
We note that similar observations have been made in ferromagnetic semiconductors, e.g. in , where the origin of the peak was identified as a magnetic polaron excitation rho02 . Further, a similar peak was observed in the infrared spectra of (albeit at a somewhat larger frequency of ) and also interpreted as a magneto-polaron mode bernhard04 . We hence tentatively ascribe the low-frequency peak in to electronic RS on polarons based on the states of Co. This may indicate that the scattering rate in the samples with lower hole content originates from short-range charge and spin fluctuations, rather than impurities as in conventional semiconductors. Recent neutron scattering data have shown a marked broadening of the spin excitations in a sample with and , consistent with this idea bayrakci_SW .
We next address the temperature dependence of the electronic Raman scattering of SC samples. The overall intensity of the continuum (referenced to the intensities of the dominant phonon modes, see lower inset in Fig. 2) is significantly weaker in the hydrated, SC composition than in the non-SC samples. The strong intensity reduction points to a reduced electronic scattering rate, which seems to be inconsistent with more metallic behavior with higher hole doping. This should be ascribed to the fact that Raman spectroscopy is sensitive to the low frequency carrier dynamics and scattering processes without charge conservation. Thus, our Raman data can be interpreted in terms of charge localizations, confirmed below.
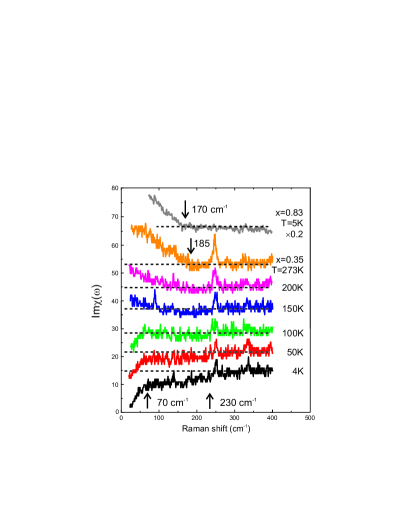
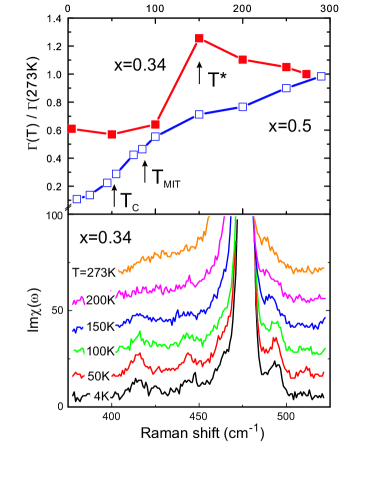
The spectra of SC and non-SC samples show a very different evolution as the temperature is lowered. This is highlighted in Fig. 3, where the low-energy Im is presented for samples with x=0.35 and x=0.83. At high temperatures both spectra show similar kinks at 185 and , respectively. While the kink position is temperature independent in the non-SC sample (Fig. 2a), it shifts to lower energies with decreasing temperature in the SC sample. For T150 K, the low-energy spectral weight is sharply suppressed, opening up a “pseudogap” that is not present in samples with . At 4 K, the spectral depletion is most pronounced at energies below , but extends up to 230 , only a factor of two smaller than the high-energy cutoff of the continuum. This implies that the pseudogap energy is not only large compared to the SC transition temperature, but that it constitutes a significant fraction of the energy scales characterizing the electronic structure. The upper panel of Fig. 4 shows that the low-energy scattering rate / determined from the inverse of the slope forms a maximum at K and decreases sharply below this temperature, indicating that the charged quasiparticles become decoupled from the collective excitations. Na ordering and metal-insulator transition for x=0.5 huang04 ; zandbergen04 lead to a much more gradual decrease of .
The experiments presented here are among the first to address electronic excitations in SC cobaltates. The reduced intensity of the RS continuum in SC compared to non-SC samples is in general agreement with prior photoemission experiments indicating a crossover from strongly to weakly renormalized quasiparticles with decreasing Na content. Our observation of a pseudogap is also consistent with a recent high-resolution photoemission experiment that has revealed hints of a partial spectral weight depletion in in a similar temperature range as that covered by our experiment shimojima04 .
A clue to the microscopic origin of the pesudogap is provided by the phonon spectrum in the lower panel of Fig. 4. Below , weak sidebands develop close to the in-plane phonon, in a manner similar to the charge-ordered state in (Fig. 1). In contrast, the out-of-plane mode does not couple strongly to the electronic states in the plane. In analogy to the latter material, this effect indicates the formation of a superlattice due to charge ordering. The weak intensity of these modes in the SC sample and their gradual onset point to a very small order parameter in the presence of strong fluctuations additional-modes . A related anomaly is observed as an enhanced intensity ratio of the in-plane with respect to the out-of-plane mode (see lower inset of Fig. 2). This is due to a renormalization of the phonon intensity by a shielding effect of charge carriers and is indeed reciprocal to the intensity of the electronic RS itself. Thus, the origin of the charge ordering instability appears to be predominantly of electronic nature. Evidence of charge ordering has thus far not been reported in SC samples. However, based on model calculations charge ordering has been proposed to be an instability competing with SC schaak03 ; baskaran03b ; chen04 . In the charge ordered state, the low energy electronic fluctuations related to the Co states at the Fermi energy are expected to be partially suppressed, consistent with our observation koshibae03 .
In conclusion, our observation of a low-energy spectral-weight depletion of the electronic RS continuum in SC cobaltates provides evidence for the formation of a pseudogap at temperatures below K. Weak phonon anomalies point to the formation of a charge-ordered state below . It is interesting to note that a pseudogap has recently also been observed in the manganite and attributed to polaron dynamics manella05 . With respect to the cobaltates, however, further experiments are required to assess whether charge order coexists microscopically with SC, or whether the material phase-segregates into SC and charge-ordered states.
We acknowledge discussions with C. Varma, R. Hackl, G. Blumberg, T. P. Devereaux, G. Khalliulin, C. Bernhard, R. Kremer, and Yu. Pashkevich. This work was supported by DFG SPP1073, ESF program Highly Frustrated Magnetism (ESF-HFM) and the MRSEC Program of the NSF DMR 02-13282.
References
- (1) K. Takada et al., Nature 422, 53 (2003).
- (2) J. D. Jorgensen et al., Phys. Rev. B 68, 214517 (2003).
- (3) J. W. Lynn et al., Phys. Rev. B 68, 214516 (2003).
- (4) T. Motohashi et al., Phys Rev. B 67, 064406 (2003).
- (5) S. Bayrakci et al., Phys. Rev. B 69, 100410 (2004).
- (6) Q. Huang et al., J. Phys: Cond. Matter 16, 5803 (2004).
- (7) J. Hwang, et al., Phys. Rev. B 72, 024549 (2005).
- (8) R. E. Schaak et al., Nature 424, 527 (2003).
- (9) M. Z. Hasan et al., Phys. Rev. Lett. 92, 246402 (2004) and cond-mat/0501530 (2005).
- (10) H.-B. Yang et al., Phys. Rev. Lett. 92, 246403 (2004) and Phys. Rev. Lett. 95, 146401 (2005).
- (11) D. J. Singh, Phys. Rev. B 61, 13397 (2000).
- (12) W. Koshibae and S. Maekawa, Phys. Rev. Lett. 91, 257003 (2003).
- (13) M. D. Johannes et al., Phys. Rev. Lett. 93, 097005 (2004).
- (14) I. Terasaki et al., Phys. Rev. B 56, 12685 (1997) and Y. Wang et al., Nature 423, 425 (2003).
- (15) G. Caimi et al., Europhys. Journ. B 69, 213 (2004).
- (16) C. Bernhard et al., Phys. Rev. Lett. 93, 167003 (2004).
- (17) F. L. Ning et al., Phys. Rev. Lett. 93, 237201 (2004).
- (18) A. Tanaka and X. Hu, Phys. Rev. Lett. 91, 257006 (2003).
- (19) G. Baskaran, Phys. Rev. Lett. 91, 097003 (2003).
- (20) O. L. Motrunich and P. A. Lee, Phys. Rev. B 70, 024514 (2004).
- (21) D. P. Chen et al., Phys. Rev. B 69, 024506 (2004).
- (22) F. C. Chou, J. H. Cho, and Y. S. Lee, Phys. Rev. B 70, 144526 (2004).
- (23) Earlier RS investigations extensively discuss the effects of degradation iliev03 ; lemmens04b or show a phonon spectrum that deviates from the present results shi04 .
- (24) M. N. Iliev et al., Physica C 402, 239 (2004).
- (25) P. Lemmens et al., J. Phys.: Cond. Matter 16, S857 (2004).
- (26) Y. G. Shi et al., Phys. Rev. B 70, 052502 (2004).
- (27) M. L. Foo et al., Solid State Commun. 127, 33 (2003).
- (28) H. W. Zandbergen et al., Phys. Rev. B 70, 024101 (2004).
- (29) C. M. Varma et al., Phys. Rev. Lett. 63, 1996 (1989) and A. Virosztek and J. Ruwalds, Phys. Rev. Lett. 67, 1657 (1991).
- (30) A. Zawadowski and M. Cardona, Phys. Rev. B 42, 10732 (1990) and T. P. Devereaux and A. P. Kampf, Phys. Rev. B 59, 6411 (1999).
- (31) H. Rho et al., Phys. Rev. Lett. 88, 127401 (2002).
- (32) S. Bayrakci et al., Phys. Rev. Lett. 94, 157205 (2005).
- (33) M. L. Foo et al., Phys. Rev. Lett. 92, 247001 (2004).
- (34) The modes at 250, 331, 414, 496 show a 80 comparable to a typical optical phonon dispersion. The first mode in the proximity to the edge of the depletion has a modified temperature dependence.
- (35) T. Shimojima et al., Phys. Rev. B 71, 020505 (2005).
- (36) N. Manella et al., cond-mat/0510423, to appear in Nature (2005).