Gas Enrichment at Liquid-Wall Interfaces
Abstract
Molecular dynamics simulations of Lennard-Jones systems are performed to study the effects of dissolved gas on liquid-wall and liquid-gas interfaces. Gas enrichment at walls is observed which for hydrophobic walls can exceed more than two orders of magnitude when compared to the gas density in the bulk liquid. As a consequence, the liquid structure close to the wall is considerably modified, leading to an enhanced wall slip. At liquid-gas interfaces gas enrichment is found which reduces the surface tension.
pacs:
68.08.-p,68.03.-g,68.15.+e,83.50.RpThe precise determination of the hydrodynamic boundary condition, slip vs. no-slip, is currently a matter of active debate. A growing number of studies, experiments lauga ; granickbizonne ; bonaccurso as well as simulations bizonneEPJE ; barrat ; priezjev ; lichter ; andrienko , strongly indicate that the classical no-slip condition, a more than 200 year old dogma, is violated. Though it is difficult to identify clear trends, the investigations suggest that increasing hydrophobicity and an increasing amount of dissolved gas in the liquid favor larger slip. Note, however, that slip has been reported for hydrophilic surfaces as well bonaccurso .
Despite many investigations, slippage behavior and its origin are far from being understood. A possible cause lauga ; degennes is the presence of so-called surface nanobubbles, i.e., nanoscale bubbles located on a solid surface that is immersed in liquid. Many recent experiments support the notion of surface nanobubbles, in particular atomic force microscopy measurements nanobubbles_AFM , but also other techniques nanobubbles_other . Similar to the trends for wall slip, hydrophobicity and dissolved gas favor nanobubbles. For gas-saturated liquid nanobubbles are found on hydrophobic surfaces, whereas usually nanobubbles are not observed for hydrophilic and/or degassed liquid, suggesting gas- rather than vapor bubbles. In spite of growing experimental evidence for their existence, it is unclear how and why they form and why they are apparently stable.
Other examples for the interplay between hydrophobic interfaces and dissolved gases are colloidal suspensions and emulsions alfridssonmaeda , where the stability is considerably influenced by the presence of dissolved gases. Moreover, recent neutron reflectivity measurements doshi reveal a dependence of the width of the hydrophobic wall-water interface on the amount and type of dissolved gas.
Though the above mentioned experiments clearly demonstrate the importance of dissolved gases for the hydrophobic wall-liquid interface, a profound understanding is still lacking. Molecular dynamics simulations are a promising approach to address this issue. However, previous simulations, for instance of slippage bizonneEPJE ; barrat ; priezjev ; lichter , were restricted to pure liquids without dissolved gases. How do gases effect liquid-wall interfaces? How do the effects change with hydrophobicity or for different gases? Is wall slip enhanced? It is the aim of this Letter to address these issues by means of molecular dynamics simulations. Control parameters are the amount of dissolved gas, the hydrophobicity of the wall, and the type of gas. Liquid-gas interfaces, which serve as reference systems and are important in their own right lubetkin , are studied as well.
Simulations are performed for fixed particle number, volume and temperature using the GROMACS code gromacs . Periodic boundary conditions (p.b.c.) are applied in and -direction. Three different particle species (liquid/gas/wall) with mass are simulated. Liquid and wall particles have the same molecular diameter . Particles interact via Lennard-Jones (LJ) 6-12 potentials with a cutoff , which is larger than the value usually applied for bulk liquids, in order to account for inhomogeneities at interfaces. The energy scale for liquid-liquid interactions is fixed to with Boltzmann’s constant . To model an inert gas without wall affinity the energy scales for gas-gas and gas-wall interactions are , which is close to of Argon. The temperature is below (above) the critical temperature of the liquid (gas) particles footnote ; brovchenko . The time step is with the characteristic time . During production runs, the simulations are weakly coupled to a heat bath using the Berendsen thermostat berendsen with a relaxation time . A perfectly stiff wall is simulated by solid particles that are frozen on a fcc-lattice with density . The center of mass velocity is removed, apart from the flow simulations.
Four microscopic control parameters (i)-(iv) are tuned which change the properties of interest. To simulate different gases (i) the energy scale for gas-liquid interactions is varied, as well as (ii) the molecular diameter of the gas particles ( is applied). Expressing and in terms of and , respectively, the combinations and are studied, which are denoted as gas types . To identify effects due to the gas (iii) the number of gas particles is changed from (pure liquid) to the finite value . The hydrophobicity of the wall is varied by (iv) the ratio with the scale for liquid-wall interactions, enabling simulations of hydrophilic and hydrophobic walls. These microscopic parameters (i)-(iv) determine macroscopic properties such as gas solubility, gas concentration, surface tension, and the contact angle.
Before addressing liquid-gas mixtures at walls it is worth discussing liquid-gas mixtures without walls. Initially, liquid and gas particles are located on a lattice (’fluid cube’) in the center of a rectangular simulation box, Fig. 1(a).

After an equilibration period (), which consists of a series of subsequent microcanonical simulations at , the system is in a steady state with a liquid film perpendicular to the -axis, in coexistence with the vapor-gas phase. The total number of particles is . Fig. 2 presents density profiles obtained from time averaging ( after equilibration). One can clearly observe an enrichment of gas in the interfacial region, before the gas density falls off towards its value in the bulk liquid (similar observations have been made for liquid-liquid mixtures salomons with a much stronger attraction between different particle species). A gas particle close to the interface experiences attractive forces from particles in the vapor-gas phase as well as in the liquid film. Since the density in the liquid film is much larger than in the vapor-gas phase, the resulting force is directed towards the liquid film, which leads to the nonmonotonous density profiles, even for gases with small gas-liquid interactions as for . Note that the amount of gas in the bulk of the liquid is similar for all gases, , though the importance of different factors involved in the process of gas solution are expected to differ for the gases . To illustrate this, consider the energy scale of which will facilitate gas solution compared to (A) with its smaller value of , but this is counteracted by the larger size of the particles.
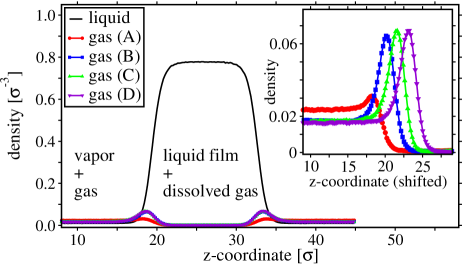
Does gas change the surface tension ? Experiments show that gases decrease (which has been proposed to be crucial for bubble nucleation), but the reason was stated to be unknown lubetkin . Applying the standard Kirkwood-Buff rowlinson formula to calculate , a decrease of due to the gas adsorption is found as well. Expressed in terms of , the average value of for the liquid-vapor interface () is (in agreement to typical values for LJ-fluids salomons ), which is reduced to approximately for . Additional simulations show that the decrease of is enhanced for increasing gas pressure, just as in experiments.
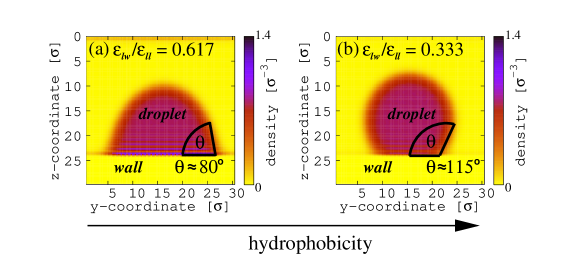
What changes in the presence of walls? Since the contact angle is of vital importance, the walls are first characterized by simulations of droplets at walls. Therefore, a ’fluid cube’ composed of liquid particles is initiated on a wall. After dynamical evolution () the density profiles (obtained by time averaging) allow to estimate numerically, see Fig. 3. The trend of the obtained contact angle with the hydrophobicity parameter is consistent with what one would obtain from the rough estimate barrat (with densities and of wall and liquid) based on the Laplace expression of surface energies rowlinson .
What is the molecular structure of liquids in contact with walls, in particular in the presence of dissolved gas? With well controled walls in place, we proceed to investigate this issue. Therefore a ’fluid cube’ of liquid and gas particles is initiated close to a wall, Fig. 1(b). The effect of hydrophobicity is studied by changing , as discussed above. In order to probe the effect of dissolved gas we compare simulations with (pure liquid) to simulations with for the gases . The number of liquid particles is . After an equilibrating period ( and for the hydrophilic and hydrophobic wall) the system consists of a fluid film in phase coexistence on one side and which is in contact with a wall on the other side. The left part of Fig. 4 shows liquid and gas density profiles ( time averaging) close to the hydrophilic wall.

There is a tiny increase of the gas density at the wall, which is too small to be observed on the scale of Fig. 4. The pure liquid exhibits the usual layering barrat ; brovchenko ; mugele close to the wall, which is hardly altered by the presence of the gas.
How do the density profiles change for a hydrophobic instead of a hydrophilic wall? Fig. 4(b) shows liquid and gas density profiles close to the hydrophobic wall. One immediately observes a dramatic increase of the gas density in the vicinity of the wall. For gas the density increases by a factor when compared to the gas density in the bulk liquid, and the gas enrichment is even more than two orders of magnitude for the gases . Furthermore, the liquid structure close to the wall is drastically changed. The pure liquid exhibits layering, which is less pronounced than for the hydrophilic case, Fig. 4(a). The liquid structure is only slightly altered by gas but it is greatly diminished by the presence of gases . The gas enrichment leads to a considerable reduction of the liquid density in the vicinity of the hydrophobic wall. We stress that for the hydrophobic wall for all gases , which shows that the gas enrichment is not caused by a strong gas-wall interaction. The gas enrichment is associated with a reduced diffusion of the gas perpendicular to the wall. Since the simulations leading to Fig. 4 started with a high gas concentration in the liquid, Fig. 1(b), a proper equilibration is a delicate issue (for gases ). Therefore we confirmed the results by simulations starting from a contrary initial configuration, Fig. 1(c). Here, the gas particles are initially completely separated from the wall by the liquid film. The gas enrichment obtained after equilibration from simulations initiated from Fig. 1(c) is , , and of the gas enrichment for the gases depicted in Fig. 4(b) footnote2 . Hence, the tremendous gas enrichment as well as the considerable reduction of the liquid density at the wall are reproduced even in simulations starting from the configuration Fig. 1(c).
The width of the region of gas enrichment is of the order of , similar to the observations in doshi . Thus, we basically find a monolayer of gas particles adsorbed at the wall. Though the gas enrichment shows some resemblance of surface nanobubbles it is still different from gas bubbles with heights of several nanometers as experimentally observed nanobubbles_AFM . Interesting objectives for future research are to clarify if the gas enrichment constitutes a reservoir for nanobubbles and if the reduced diffusion of gas perpendicular to the wall helps stabilizing them.
What causes the dramatic gas enrichment? Energetically the system benefits from gas-liquid interactions due to , but gas particles in the bulk liquid occupy space due to which is unfavorable (reduction of liquid-liquid interactions). Gases at the liquid interface, however, reduce the energy with little disturbance of the liquid-liquid interactions, and energetic contributions from , which are diminished, are small for hydrophobic walls. According to this explanation, the gas enrichment increases with increasing and (for similar gas concentration in the bulk liquid), just as observed in the simulations.
To probe the effect of the gas on the slippage behavior, we apply a constant force in -direction (parallel to the wall). As usual only the velocity component perpendicular to the flow (-component) is thermostated bizonneEPJE ; barrat (Langevin thermostat with ). The unforced systems after their equilibration phase (initial configuration Fig. 1(c) for ) are further equilibrated () while applying , and hereafter production runs () yield velocity profiles shown in Fig. 5.
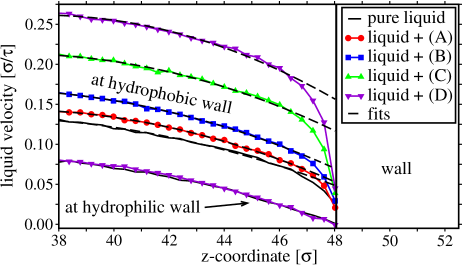
The velocity in the liquid film at the hydrophilic wall is not altered by the gas. Contrarily, at the hydrophobic wall the gas significantly changes the velocity profiles, leading to an increase of the average velocity. Estimates of the slip length lauga using the fits depicted in Fig. 5 (dashed lines) yield for the pure liquid and liquid in the presence of , respectively. Hence, the presence of gas can significantly increase the slip length.
In conclusion, our results support the experimental findings that gases dissolved in liquids, although present only in low concentration in the bulk liquid, can have a strong influence on the structure of the liquid-wall interface, due to gas enrichment at hydrophobic walls. Future studies of phenomena associated with the hydrophobic wall-liquid interface therefore must take dissolved gases into account. This holds, e.g., for the appearance of nanoscale bubbles, the study of slippage, and the breakage of nanofilms jacobs .
We thank the group of D.E. Wolf for technical support, in particular G. Bartels and L. Brendel. S.M.D. acknowledges financial support (research grant DA969/1-1) from the German Research Foundation (DFG).
References
- (1) E. Lauga, M.P. Brenner, and H.A. Stone, in Handbook of Experimental Fluid Dynamics, edited by C. Tropea, J. Foss, and A. Yarin (Springer, New York 2005); C. Neto et al., Rep. Prog. Phys. 68, 2859 (2005).
- (2) S. Granick, Y. Zhu, and H. Lee, Nature Materials 2, 221 (2003); C. Cottin-Bizonne et al., Phys. Rev. Lett. 94, 056102 (2005).
- (3) E. Bonaccurso, M. Kappl, and H.J. Butt, Phys. Rev. Lett. 88, 076103 (2002).
- (4) C. Cottin-Bizonne et al., Eur. Phys. J. E 15, 427 (2004).
- (5) J.-L. Barrat and L. Bocquet, Phys. Rev. Lett. 82, 4671 (1999).
- (6) N.V. Priezjev and S.M. Troian, Phys. Rev. Lett. 92, 018302 (2004).
- (7) S. Lichter, A. Roxin, and S. Mandre, Phys. Rev. Lett. 93, 086001 (2004).
- (8) D. Andrienko, B. Dünweg, and O.I. Vinogradova, J. Chem. Phys. 119, 13106 (2003).
- (9) P.G. de Gennes, Langmuir 18, 3413 (2002).
- (10) J.W.G. Tyrrell and P. Attard, Phys. Rev. Lett. 87, 176104 (2001); A.C. Simonsen, P.L. Hansen, B. Klösgen, J. Colloid Interface Sci. 273, 291 (2004); M. Holmberg et al., Langmuir 19, 10510 (2003).
- (11) M. Switkes and J.W. Ruberti, Appl. Phys. Lett. 84, 4759 (2004); R. Steitz et al., Langmuir 19, 2409 (2003).
- (12) M. Alfridsson, B. Ninham, and S. Wall, Langmuir 16, 10087 (2000); N. Maeda et al., Langmuir 20, 3129 (2004).
- (13) D. A. Doshi et al., PNAS 102, 9458 (2005).
- (14) S.D. Lubetkin, Langmuir 19, 2575 (2003).
- (15) E. Lindahl, B. Hess, and D. van der Spoel, J. Mol. Mod. 7, 306 (2001).
- (16) Typical values of reported in the literature vary between and brovchenko .
- (17) I. Brovchenko, A. Geiger, A. Oleinikova, Eur. Phys. J. B 44, 345 (2005).
- (18) H.J.C. Berendsen et al, J. Chem. Phys. 81, 3684 (1984).
- (19) E. Salomons and M. Mareschal, J. Phys.: Cond. Mat. 3, 3645 (1991).
- (20) J.S. Rowlinson and B. Widom, Molecular Theory of Capillarity, (Dover Publications, Mineola, New York, 2002).
- (21) F. Mugele and M. Salmeron, Phys. Rev. Lett. 84, 5796 (2000).
- (22) Due to long diffusion times, the equilibrium gas enrichment lies between that obtained from the contrary initial configurations, Fig. 1(b,c).
- (23) K. Jacobs and S. Herminghaus, Langmuir 14, 965 (1998).