Simple Model of Sickle Hemogloblin
Abstract
A microscopic model is proposed for the interactions between sickle hemoglobin molecules based on information from the protein data bank. A Monte Carlo simulation of a simplified two patch model is carried out, with the goal of understanding fiber formation. A gradual transition from monomers to one dimensional chains is observed as one varies the density of molecules at fixed temperature, somewhat similar to the transition from monomers to polymer fibers in sickle hemoglobin molecules in solution. An observed competition between chain formation and crystallization for the model is also discussed. The results of the simulation of the equation of state are shown to be in excellent agreement with a theory for a model of globular proteins, for the case of two interacting sites.
1 Introduction
The condensation of globular proteins from solution is a subject
of considerable experimental and theoretical activity. One one
hand, it is important to grow high quality protein crystals from
solution in order to be able to determine protein structure (and
thus function) from X-ray crystallography. On the other hand,
many diseases are known to be caused by undesired condensation of
proteins from solution. In both cases one needs to have a
reasonably detailed model of the protein–protein interactions in
solution in order to predict the phase diagram, condensation rate
and growth kinetics. This is a major challenge to theorists, as
these protein-protein interactions arise from many sources and are
still relatively unknown in most cases.
An important example of undesired protein condensation occurs with
sickle hemoglobin (HbS) molecules in solution. It is known that
deoxygenated sickle hemoglobin molecules in red blood cells can
undergo a two step nucleation process that leads to the formation
of polymer fibers in the cell [1, 2].
These fibers distort the cells and make it difficult for them to
pass through the capillary system on their return to the lung. A
direct determination of the homogeneous nucleation of HbS fibers
in vitro has shown that the nucleation rates are of the
order of and that the induction
times agree with Zeldovich’s theory [3]. These
rates are comparable to those leading to erythrocyte sickling
in vivo. They are also approximately nine to ten orders of
magnitude larger than those known for other protein crystal
nucleation rates, such as lysozyme.
Consequently a goal of current research is to understand at a molecular level this nucleation process and by controlling the conditions on which the nucleation depends, to slow down the nucleation rate such as to prevent the polymerization from occurring while HbS is in its deoxygenated state in the cells. To do this requires understanding the protein-protein interactions, in order to predict the phase diagram and nucleation rate for sickle hemoglobin molecules. The phase diagram for HbS is only partially known experimentally. It is known that there is a solubility line separating monomers and fibers [4, 5] and evidence exists for a spinodal curve with a lower critical point [6]. In a previous publication [7] we obtained a phase diagram that was qualitatively similar to this, namely, a liquid-liquid phase separation with a lower critical point. In addition, we determined the location of the liquidus and crystallization lines for the model, as shown in Figure 1.

However, although yielding a lower solution critical point, this
model was unable to predict the formation of polymer fibers, as it
was based on a spatially isotropic, short range protein-protein
interaction (e.g. a square well or a modified Lennard-Jones
potential energy). Fiber formation clearly requires anisotropic
interactions. In this paper we propose an anisotropic model for
the HbS-HbS interactions, based on an analysis of the contacts for
HbS crystals from the protein data bank. We also define an order
parameter to describe the polymerization of this model. As the
full model is complex and involves several unknown interaction
parameters, we study a simplified version of the model (a two
patch model) in order to gain some insight into the nature of the
fiber formation. We determine some aspects of the phase diagram
for the two patch model via Monte Carlo simulation and biasing
techniques and show in particular that it yields one dimensional
chains that are somewhat similar to the polymer fibers formed in
HbS nucleation. Real HbS fibers, however, have a diameter of about
21 nm. In addition, the strands within the fiber are packed into
double strands. Thus the two patch model is too simple to describe
the polymer fiber phase transition observed in HbS. Future work
will be necessary to obtain reasonable estimates of the
interaction parameters in the full model, in order to obtain a
realistic model for the polymer fiber phase
transition.
The outline of the paper is as follows. In section 2 we propose
an anisotropic interaction model for the pair interactions between
HbS molecules. In section 3 we define an order parameter that
measures the degree of polymerization in the system. In section 4
we present the results of our Monte Carlo simulation for a two
patch approximation to the full model, since we are unable to make
realistic estimates for the interaction parameters for the full
model. A biasing technique is used in order to examine the nature
of the chain formation. In section 5 we summarize the results of a
perturbation theory as applied to an eight patch model and to our
two patch model. In the latter case we show that the simulation
results are is excellent agreement with this theory. In section 6
we present a brief conclusion and suggest directions for future
research on this subject.
2 Anisotropic model for the Hemoglobin S polymerization
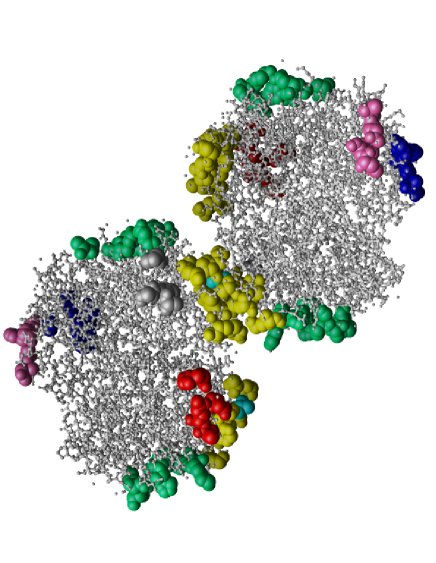
Protein molecules in general, and sickle hemoglobin molecules in particular, are very complicated objects, typically consisting of thousands of molecules. There are many types of forces between protein molecules in solution, such as Coulomb forces, van der Waals forces, hydrophobic interactions, ion dispersion forces and hydrogen bonding. Although these interactions are complex, considerable success in predicting the phase diagrams of several globular proteins in solution has been accomplished by using rather simple models with spatially isotropic interactions. These models share in common a hard core repulsion together with a short range attractive interaction (i.e. the range of attraction is small compared to the protein diameter). However,in general the protein-protein interactions are anisotropic, often arising from interactions between specific amino acid residues on the surfaces of the interacting molecules; i.e., certain areas of a protein surface interact with certain areas of another molecule’s surface. Thus there has been some recent work attempting to model these anisotropic interactions. In such models a given protein molecule is represented by a hard sphere with a set of patches on its surface [8, 9, 10, 11, 12, 13]. Intermolecular attraction is localized on these patches. Typically the models assume that two protein molecules interact only when they are within the range of attractive interaction and when the vector joining their centers intersects patches on the surface of both molecules. The fluid-fluid diagram for such a model was studied by Kern and Frenkel [13] in a Monte Carlo simulation and by Sear theoretically [11]. In these studies all patches are assumed to interact with each other equally. This approximation gives a good qualitative picture of the possible importance of anisotropy in protein phase diagrams. However, when we consider the behavior of a specific globular protein, this approximation is too simple and does not reflect the actual structure of protein aggregates. This is particularly important in the fiber formation of HbS molecules in solution. Figure 2 shows interacting HbS molecules, with the different pairs of interacting regions in the crystal state of HbS. We use this information, in accordance with the contact information in the HbS crystal [14, 15], to develop a model for the anisotropic interactions between the HbS molecules.
To develop an anisotropic model to describe these interacting molecules, we allow for the possibility of different interaction strengths between different pairs of these interacting patches. To characterize such interactions, we introduce an interaction matrix , where is the strength of interaction between the and patches and is the total number of patches on a protein surface. This is a symmetric matrix that describes the strength of interaction between each pair of patches. In our particular model we choose a square well attraction between patches, although this is not a necessary restriction on the interactions. Thus the interaction matrix consists of the well depth values for the different patch-patch interactions. We define the pair potential between two molecules in this case in a way similar to [11, 13], but generalizing to the case of different patch-patch interactions:
| (1) |
Here is the number of patches, is the orientation (three Euler angles, for example) of the molecule, is the square well potential for the unit well depth and is the patch direction in the laboratory reference of frame:
| (2) |
Here is the patch direction in the molecule reference of frame and is a rotation matrix between the molecule and the laboratory reference of frame. in (1) is a step function
| (3) |
where is the half open angle of the patch. In other words, is equal to 1 when the vector joining two molecules intersects the patch on the surface. If patches do not overlap then the sum in equation (1) has at most one term. The radial square well dependence with range is given by
Until now what we have done is valid for any pair of molecules interacting through pairwise patch interactions. We now consider the specific case of the HbS molecule. As noted above, in agreement with contact information for the HbS crystal [14, 15], this molecule has two lateral and two axial patches that are involved in intra double strand contacts and four more patches involved in inter double strand contacts. Thus we have eight possible patches for the HbS molecule (Figure 2). One of the lateral patches contains a valine residue and another lateral patch contains an acceptor pocket for this residue. But it is known [5] that only half the mutated sites are involved in the contacts in the HbS crystal. Thus we have another possible set of 8 patches similar to the first one. The total number of patches is therefore sixteen (two equal sets of eight patches). The interaction matrix can be built assuming that the first lateral patch (of any set) can interact only with the second lateral patch (of any set). The same is true for axial patches. The remaining four patches in each set can be divided into pairs in a similar way, in accordance with [14]. This gives the following interaction matrix (for one set of eight patches):
| (4) |
where is the strength of the lateral contact, is the strength of the axial contact, and are the strength of the inter double strand contacts. We will refer to this model as the ”full model” for HbS.
3 Polymerization order parameter in a system of patchy hard spheres
One of the goals of a study of HbS molecules in solution is to calculate the free energy barrier that separates the monomer solution from the aggregate (polymer chains/fibers) state. For this purpose we have to specify an ”order” parameter that measures the degree of polymerization in the system. The structure of the aggregate depends strongly on the configuration of patches. Therefore, to separate the aggregate state from the monomer state, the order parameter should reflect the configuration of patches. (Note that the order parameter as defined below is only zero in the case in which there are only monomers.) Since in our model the regions on the molecular surface not covered by patches do not interact (except through the hard core repulsion), we can measure the degree of polymerization by measuring the fraction of the patches involved in actual contacts.
We assume that any two particles at any given time can have no more than one contact between each other. This condition is a little stronger than just a non-overlap of the patches. For each pair of particles we introduce a quantity that shows how much these particles are involved in polymerization (basically, showing the presence of the contact between them):
| (5) |
where is a weight of the contact between the patch of the molecule and the patch of the molecule. We choose the weight matrix to be the interaction matrix. is equal to for and is zero otherwise. Due to our assumption of only one contact per pair of particles, the sum in (5) has at most one nonzero term. We next define the order parameter of one particle to be
| (6) |
The term in the denominator is a normalization constant. The order parameter of the whole system is
| (7) |
This choice of order parameter reflects the patch configuration; the magnitude of the order parameter increases as the number of contacts in the system increases. It is also rotationally invariant. However, this construction has its disadvantages. For some choices of weight matrices it is possible that a fewer number of contacts could lead to a larger order parameter if these contacts has significantly larger weights. However, the choice of the weight matrix equal to the interaction matrix seems to be natural.
4 Two-patch model and one-dimensional fiber formation
The full model described earlier for the sickle hemoglobin molecule is complex and has several interaction parameters which have not yet been determined from experiment. Because we are interested in studying the fiber formation, we use a simplified model that still can produce fiber chains. We simplify the original model by reducing the number of contacts. Since one important feature of HbS fibers is the presence of twisted, quasi-one dimensional chains, we consider a system of particles with only two (axial) patches. This model is obviously not an accurate description of interacting HbS molecules, but it can lead to the formation of one dimensional chains. The interaction matrix for the simplified two-patch model is just
| (8) |
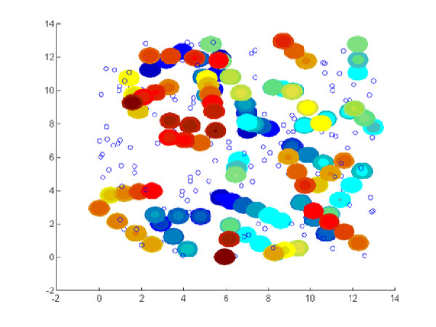
Since there are two patches on each sphere, there is only a fluid-solid phase transition. (The full model described above can have a fluid-fluid phase transition as well.) The formation of the one dimensional chains, therefore, is a gradual transition from the fluid phase as the density of the molecules is increased. Figure 3 shows chains that result in our simulation.
Since the formation of these chains is a gradual transition as one increases the density, they do not arise from homogeneous nucleation. A necessary property of nucleation is the existence of a nucleation barrier in the free energy dependence on the order parameter. This barrier should separate two wells; one well corresponds to the metastable phase, the other to the more stable phase. In our case there will not be such a barrier. To examine the nature of the chain formation, we determined the dependence of the free energy on the patch order parameter by performing two series of umbrella sampling Monte Carlo simulations. The first set of simulations was done at and .
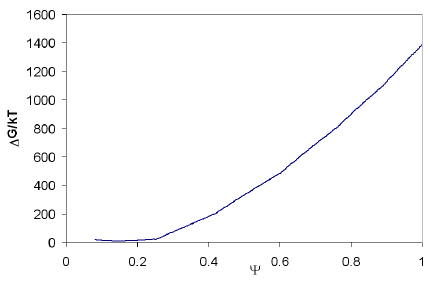
In this case the initial liquid state does not crystallize in the absence of the biasing and remains in the liquid state. The order parameter has only one minimum about , corresponding to a mix of monomers and dimers (Figure 4). As we increase the pressure to the free energy now has a minimum at a lower value of that corresponds to the liquid state (figure 5) and a second minimum at . This second minimum corresponds to a crystal state with all the patches involved in contacts. Thus we see that this double-well free energy describes a liquid-solid phase transition rather than to a monomer-(one dimensional) fiber transition. This liquid-solid transition is what one would expect for this model.
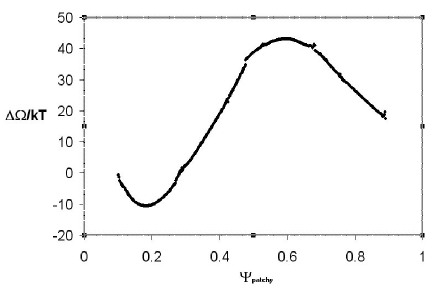
Thus, as expected, there is no nucleation mechanism for the monomer-fiber transformation. In the case of and the system simultaneously crystallizes and increases its number of patch contacts. The system successfully reaches an equilibrium crystal state and the free energy has only one minimum at this state, as seen in Figure 6.
However, at lower temperature the picture is quite different. At and the fibers form before crystallization can occur. The free energy has one minimum at around , but the system is not crystallized. As the set of fibers is formed, the dynamics slows down significantly and the system becomes stuck in a non-equilibrium state. Figure 3 shows an example of a typical configuration for this nonequilibrium state, corresponding to a set of rods in a ”glassy” state.
The umbrella sampling simulations were performed on a system of N particles, with = 500, in the NPT ensemble, with a range of interaction given by The equation of state simulations were also performed in the NPT ensemble with 500 particles. The details of the umbrella sampling technique can be found in [16, 17]. In short, this method is based on a biasing of the original interactive potential in such a way that the system is forced to reach otherwise inaccessible regions of the configuration space. In particular, for simulations starting in a liquid state, the system is forced towards larger values of the order parameter. Since the actual dependence of the free energy on the order parameter (for the entire range of values of ) is not known, the biasing function is chosen to be quadratic:
where the parameters and determine which region of values of would be sampled in the simulation. By changing these parameters we can sample the entire region of values of . An interesting result of the simulations is that at intermediate pressures the system when biased to large values of starting from an initial liquid state has a very large volume. However, if the system is started from an initial (fcc) crystal state, the volume of the system remains small (still in a crystal state), while the order parameter value is around 1. This observation suggests that at not very high supersaturation the biased system started from the fluid ends up by forming a few long fibers, rather than a set of fibers that are packed into a crystal lattice. The fiber formation time therefore is much smaller than the crystallization time at low supersaturation. Starting from aa fcc initial condition, however, the particles just reorient within the crystal lattice to form the fibers, remaining in the crystal state. At higher pressure, and therefore higher supersaturation, (such as in Figure 5), the crystallization occurs in a time comparable with the fiber formation time. While the system is forced to form the fibers, these fibers pack into the crystal lattice.
4.1 Equation of State

The equation of state for the two patch model is shown for the two low temperatures studied in Figures 7 and 8.

Also shown in these figures are results from a theory for the m site model [9] of globular proteins due to Sear [11]. This model is identical to our patch model defined in section 2 for the case in which the various interaction parameters are equal. Sear studied the m-site model (m patches) using the Wertheim perturbation theory [8] for the fluid phase and a cell model for the solid phase [18] and showed that the model exhibits a fluid-fluid transition (for ) which is metastable with respect to the fluid-solid transition for most values of the model parameters. For , however, there is only a fluid-solid transition. As can be seen from Figures 7 and 8, the theory yields results which are in excellent agreement with the results of our simulation. For completeness we show the theoretical prediction for the fluid-solid transition for in Figure 9, assuming a fcc crystal structure.

We also show in Figure 10 the results of the theory for the case , as the model discussed in section 2 has 8 pairs of interacting patches. Since the interactions between the different sites in the model studied by Sear are assumed to be equal, the model lacks the anisotropy discussed in section 2 that is necessary to account for the fiber formation in HbS molecules. Nevertheless, it is quite instructive to know the phase diagram for this case.

The fluid-fluid binodal curve has an upper critical point for (e.g. Figure 10),unlike the case for HbS. In that case experimental measurements by Palma et al [6] display a spinodal curve. Such a spinodal implies the existence of a binodal curve with a lower critical point . However, as shown by Shiryayev et al [7] the lower critical point reflects the crucial role of the solvent in the case of HbS in solution. The solvent is not taken into account in our model, but presumably if one would include a solute-solvent coupling similar to that of [7], this coupling could change the phase diagram shown in Figure 10 to one with a lower critical point, as found by Shiryayev et al [7], e.g. Figure 1.
Finally, we note that Jackson et al [9] used Wertheim’s theory for the two site model to predict that the fraction of molecules that are present in chains of length n is given by
| (9) |
while the average change length, ¡n¿, is given by
| (10) |
Here is the fraction of sites that are not bonded to another site and is given by [11]
| (11) |
where is the contact value of the pair distribution function for a fluid of hard spheres. The quantity is given by the expression
| (12) |
For example, the theoretical prediction for the fraction of dimers and the average chain length as a function of density (at ) is shown in Figures 11 and 12, respectively. Also shown for comparison in Figure 12 is an approximation for the average chain length obtained from our simulation results for the order parameter. Had we chosen to use a function in our definition in section 3 (rather than for ) the order parameter would have been equal to , i.e. the fraction of sites that are bonded to another site. In that case the average chain length would be equal to . As shown in the figure, is in general less than the average chain length, due to our choice of f in section 2.


5 Conclusion
The results obtained in the previous section raise several important questions. For some thermodynamic conditions the system crystallizes and the fibers align along each other to form a fcc like structure. For other thermodynamic conditions the fiber formation prevents the system from crystallizing and it remains in a non-equilibrium glassy state. Is there some boundary between these two behaviors? In protein crystallization science a somewhat similar phenomenon is known as ”gelation”. The boundary between successful crystallization and the nonequilibrium ”gel” state is the ”gelation line”. (This line is obviously not an equilibrium phase boundary.) This ”gel” state is not a gel in the usual sense. It is more like a glassy state in which the aggregates form, but due to their formation the dynamics slows down significantly and the aggregates cannot subsequently form crystals. Thus the system becomes stuck in this glassy state. Recently mode coupling theory has been used to predict the gel line for protein crystallization [19]. It is possible that one can use the same approach for the two patch model.
Another interesting question arises when we compare the behavior of the two-patch model and real sickle hemoglobin . Ferrone’s studies [2, 1] show that the formation of the fourteen strand fibers occurs via a nucleation mechanism. Molecules aggregate into an initially isotropic droplet which subsequently becomes an anisotropic fiber. The kinetics of the transformation of the isotropic droplet into an anisotropic fiber is not well understood. It is believed that this happens through the attachment of molecules to active sites of the molecules in the fiber. At some fiber diameter the number of active sites on the fiber surface is not sufficient to induce layer by layer growth of the fiber in the direction perpendicular to the fiber axis. Thus molecules that attach to the active sites form a droplet that then detaches from the fiber, with the subsequent formation of a new fiber (i.e. the new fiber forms via heterogeneous nucleation from the original fiber). This process explains why an anisotropic fiber does not continue to increase its diameter.
The point of this discussion is to note that one of the main differences between the two-patch model and sickle hemogloblin molecules is that the latter forms fibers through nucleation, whereas the former does not. One way to improve the two patch model is to increase the number of patches. If one includes an additional two active patches, corresponding to the lateral contacts, then most likely this system would form non-interacting double strands. If so, this would not lead to any qualitative difference with the two patch model. Another approach would be to add several relatively weak patches around the particle which can represent inter strand interactions. However, this would not necessarily give two distinct nucleation mechanisms (monomer-fiber and fiber-crystal). Rather, it is more likely that the crystallization would be anisotropic. In order to produce a nucleation from monomers to fibers it might be necessary to have a particular distribution of patches such that at some radius of the anisotropic droplet (pre-fiber) its growth in the radial direction is significantly depressed.
6 Acknowledgements
This material is based upon work supported by the G. Harold Mathers and Leila Y. Mathers Foundation and by the National Science Foundation, Grant DMR-0302598.
References
- [1] F. A. Ferrone, J. Hofrichter, and W. A. Eaton. Kinetics of sickle hemoglobin polymerization. ii. a double nucleation mechanism. J. Mol. Biol., 183:611, 1985.
- [2] F. A. Ferrone, M. Ivanova, and R. Jasuja. Heterogeneous nucleation and crowding in sickle hemoglobin: An analytic approach. Biophys. J., 82:399, 2002.
- [3] O. Galkin and P. G. Vekilov. Mechanism of homogeneous nucleation of polymers of sickle cell anemia hemoglobin in deoxy state. J. Mol. Biol., 336:43, 2004.
- [4] P. D. Ross, J. Hofrichter, and W. A. Eaton. Thermodynamics of gelation of sickle cell deoxyhemoglobin. J. Mol. Biol., 115:111, 1977.
- [5] W. A. Eaton and J. Hofrichter. Sickle cell hemoglobin polymerization. Advan. Protein Chem., 40:63, 1990.
- [6] P. L. San Biagio and M. U. Palma. Spinodal lines and flory-huggins free-energies for solution of human hemoglobins hbs and hba. Biophys. J., 60:508, 1991.
- [7] A. Shiryayev, D. L. Pagan, J. D. Gunton, D. S. Rhen, A. Saxena, and T. Lookman. Role of solvent for globular proteins in solution. J. Chem. Phys., 122:234911–1, 2005.
- [8] M. S. Wertheim. Thermodynamic perturbation theory of polymerization. J. Chem. Phys., 87:7323, 1987.
- [9] G. Jackson, W. G. Chapman, and K. E. Gubbins. Phase equilibria of associated fluids: Spherical molecules with multiple bonding sites. Mol. Phys., 65:1, 1988.
- [10] N. Asherie A. Lomakin, , and G. B. Benedek. Aeolotopic interactions of globular proteins. Proc. Natl. Acad. Sci. USA, 104:9465, 1999.
- [11] R. P. Sear. Phase behavior of a simple model of globular proteins. J. Chem. Phys., 111:4800, 1999.
- [12] R. A. Curtis, H. W. Blanch, and J. M. Prausnitz. Calculation of phase diagrams for aqueous protein solutions. J. Phys. Chem. B, 105:2445, 2001.
- [13] N. Kern and D. Frenkel. Fluid-Fluid Coexistence in Colloidal Systems with Short-Ranged Strongly Directional Attraction. J. Chem. Phys., 118:9882, 2003.
- [14] E. A. Padlan and W. E. Love. Refined crystal structure of deoxyhemoglobin s. ii. molecular interactions in the crystal. J. Biol. Chem., 260:8280, 1985.
- [15] D. J. Harrington, K. Adachi, and W. E. Royer Jr. The high resolution crystal structure of deoxyhemoglobin s. J. Mol. Biol., 272:398, 1997.
- [16] J. S. van Duijneveldt and D. Frenkel. Computer Simulation Study of Free Energy Barrier in Crystal Nucleation. J. Chem. Phys., 4655:4655, 1992.
- [17] P. R. ten Wolde, M. J. Ruiz-Montero, and D. Frenkel. Numerical Calculations of the Rate of Crystal Nucleation in a Lennard-Jones System at Moderate Undercooling. J. Chem. Phys., 104:9932, 1996.
- [18] C. Vega and P. A. Monson. . J. Chem. Phys., 109:9938, 1998.
- [19] A. M. Kulkarni, N. M. Dixit, and C. F. Zukoski. Ergodic and non-ergodic phase transitions in globular protein suspensions. Faraday Discuss., 123:37, 2003.