Compaction dynamics in ductile granular media
Abstract
Ductile compaction is common in many natural systems, but the temporal evolution of such systems is rarely studied. We observe surprising oscillations in the weight measured at the bottom of a self-compacting ensemble of ductile grains. The oscillations develop during the first ten hours of the experiment, and usually persist through the length of an experiment (one week). The weight oscillations are connected to the grain–wall contacts, and are directly correlated with the observed strain evolution and the dynamics of grain–wall contacts during the compaction. Here, we present the experimental results and characteristic time constants of the system, and discuss possible reasons for the measured weight oscillations.
pacs:
81.05.Rm, 83.80.Fg, 83.50.RpI Introduction
The stress distribution in dry granular media have been studied for more than a century. The German engineer Janssen studied the apparent weight at the bottom of a silo as function of its filling height Janssen (1895). Janssen found that the pressure at the bottom of a container of granular material increases linearly with small filling heights, but approaches a constant level exponentially slowly for large filling heights. That the measured weight at the bottom is less than the total weight of grains is referred to as a screening effect. It is well known that the screening effect is due to the grain–wall friction and how the stress distributes in a granular ensemble Duran (1999). Janssen’s mathematical expression for this, the Janssen law, compares surprisingly well to experiments Arroyo-Cetto et al. (2003); Vanel et al. (2000), in spite of its crude assumptions regarding friction and stress distribution de Gennes (1999). Over the last decade, various aspects of the stress distribution in static granular media have been studied. Experiments have shown that the stress distribution is sensitive to the deposition history Vanel et al. (1999), the shape and size distribution of grains Geng et al. (2001), elastic properties of the base Brockbank et al. (1997) and grains Erikson et al. , and that an exponential size distribution of forces is found at the bottom of a container for forces larger than the average h. Liu et al. (1995); Løvoll et al. (1999).
The stress distribution in dynamic systems has been investigated in pushed columns of granular media inside a cylinder Arroyo-Cetto et al. (2003); Bertho et al. (2003); Ovarlez et al. (2003); Ovarlez and Clément (2003) by measuring the normal force at the bottom for constant driving velocities. At small velocities, the measured force has a stick–slip behavior Nasuno et al. (1998); Ovarlez and Clément (2003) that is related to aging of the grain–wall friction due to capillary condensation and shear strengthening of the contacts at the walls Ovarlez and Clément (2003). These dynamic systems consist of elastic particles, and the time dependence studied relate to other properties than the particle rheology. In Nature, and in many technological processes, slowly compacted or sheared systems are dominated by the deformation of particles. The time dependence in these systems is mainly given by the plastic properties of the grains.
Here, the results from experiments on granular media consisting of plastically deforming grains in a cylinder are presented. This system deformed slowly under its own weight, compacting 10% in a week, while the normal force at the bottom (the apparent mass mis (a)) was measured. The initial expectation was that the system would show a granular Janssen type stress distribution in the initial stage, but that due to the viscous rheology of the grains a stress distribution close to the hydrostatic would develop. Thus, the apparent mass was expected to increase. Instead, the apparent mass developed unexpected (non-harmonic) oscillations, resembling the stick–slip behavior observed in hard granular media Nasuno et al. (1998); Ovarlez and Clément (2003), except that it decreased initially, and the time scale of a “slip” could be up to an hour. No overall increase was observed in the apparent mass after a week of compaction. The strain development and wall contact dynamics were also studied during the compaction, both showing behavior related to the weight oscillations. The wall interaction between grains and cylinder was varied significantly in a few experiments, and proved crucial to the oscillations, as these disappeared when wall friction was increased or decreased. The experiments and results are described in the following two sections, while some proposed mechanisms for the oscillations are discussed in section IV.
We propose that the observed oscillations are due to two competing effects: Grain–wall interaction opposing motion and the slow flow and relaxation of the grains inducing motion.
II Experiments
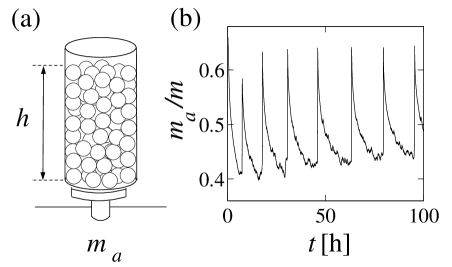
We performed 30 experiments in which an ensemble of deformable grains were left to compact in a Plexiglas cylinder of diameter . The system was studied in several ways, but mainly by measuring the apparent mass at the bottom of the cylinder in order to follow the overall evolution of the stress distribution in the compacting ensemble. A Mettler PM4800 balance was used to measure the apparent mass. This balance operates by an induction mechanism that keeps the vertical position of the measurement area constant mis (b), and thus does not affect the compaction procedure. The weight was measured to a precision of 0.03 g, and was typically a fraction (2–3) of the total mass of the grains. The cylindrical container was mounted outside of the measurement area. Spherical grains were prepared manually from Play-Doh (Hasbro International Inc., UK) to a diameter mm, and poured into the cylinder approximately ten at a time. The initial packing fractions were in the range –0.6. The material is viscous mis (c) over a large range of strain rates, – s-1, with a viscosity of Pa s. A schematic illustration of the setup is shown in Fig. 1(a) along with the typical result of the observed weight as a function of time. The measured apparent mass presented in Fig. 1(b) has been normalized by the total mass of the grains in the cylinder. The apparent mass was found to oscillate in a quasi periodic manner. The period depended on details of the packing, and could increase or decrease slightly over the duration of each experiment.
The filling height at was varied between 1–4 times the cylinder diameter, and the cylinder diameter was varied between 3.4 and 15 times the grain diameter.
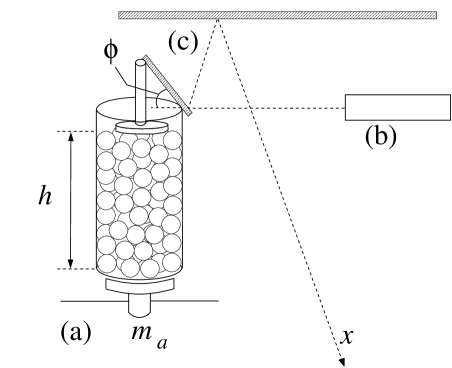
In two experiments the total height of compacting (granular) ensembles were measured using two different setups: A camera was used in one experiment to take pictures of the compaction process at various times. Image analysis was then used to extract the height of the ensemble based on the position of the uppermost 6 grains, to a resolution of 46 m. In another experiment, the height in the middle of the granular column was recorded by the use of a laser and two mirrors. A small, light weight piston was placed on top of the central grains and allowed to move only vertically. A small mirror was hinged onto the top of the piston, its lower end resting on the upper cylinder rim. As the grains compacted, the mirror was tilted, reducing its angle to the horizontal plane. A laser beam was reflected in the small mirror, and again in another, larger, mirror so that the beam was visible as a point on the floor. The position of this point was recorded manually with time, and the height of the granular ensemble calculated to a precision of 3 m. The piston was positioned along the central axis of the container, and followed the motion of the internal grains that did not touch the wall. Figure 2 illustrates the second strain measurement method.
From the measurements of the total height the global strain, , was found as .
The dynamics of the grain contacts at the cylinder wall was studied using a camera (AstroCam, Capella, LSR Life Science Resources, UK) in one experiment. The camera had a spatial resolution of 20003000 square pixels, and 14 bit intensity resolution. The contrast between the intensity inside and outside of a contact area was within an 8 bit subset of the 14 bit dynamic range. The rim of a contact was established within two pixels with the spatial and intensity resolutions as specified. The uncertainty that one extra rim of pixels introduced to the area of a contact could be as high as 20% for the smallest contact areas. The precision of the center of mass position was, however, much better, as it does not depend on the exact choice of thresholding for the contact area.
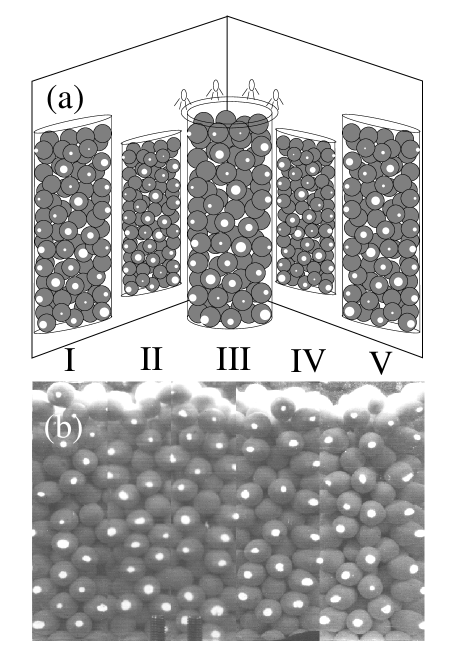
The cylinder containing the ductile ensemble was placed in front of two mirrors which were set in an angle of to each other. The cylinder was reflected twice in each mirror, thus the camera view held five versions of the cylinder (I–V), capturing it from all sides. The grains’ contacts to the wall were literally highlighted by shining light down the Plexiglas wall of the cylinder. The light only reflected out of the wall in areas where the difference in refraction indices were smaller than that between Plexiglas and air, thus the contacts between grains and wall were bright in contrast to the pore space. Figure 3(a) illustrates the setup. Each of the five cylinder images I-V (see Fig. 3) was then ‘unwrapped’ mis (d) and scaled according to the geometry of the setup, then put together to form a continuous image of the surface area of the cylinder. An example of the resultant image is shown in Fig. 3(b).
The spatial resolution in these images were 160 m. Images were recorded every 10 or 20 minutes for two days in order to capture several oscillations.
A total of 90 contacts were recovered, and 79 of these were used in the analysis. The remaining 11 contacts were discarded because of some mismatch of their area across boundaries between cylinder images.
An increase of the contact area of 70% was observed during the 60 hours that images were recorded, 60% during the first 20 hours of compaction, and 10% in the time interval h. A contact diameter was defined as for each contact area , and found as a function of time. The average contact diameter, , was found by first taking the average value of each contact diameter over the series of time steps in , and then find the average of this set, mm.
III Results
The typical behavior of the apparent mass in an experiment is as follows: At time all grains have been poured into the cylinder. The apparent mass increases slightly over a period of a few minutes, reaches its maximum (often a global maximum) and then starts to decrease. Weight oscillations mostly initiate during this decrease. When oscillations have developed, their minima decrease toward a global minimum of , before they increase slowly toward a plateau. The plateau varies between experiments in the range 45%–88% of the total mass of the grains, but are mostly in the range 60%–80%.
Figure 4 illustrates the definition of the periods, intervals, and amplitude of an oscillation, which will be referred to in the following. The period of one oscillation is defined as the time between peaks and (). This period can be further divided into intervals and of overall decrease and increase, respectively, of the apparent mass. The point of minimum apparent mass between peaks and () marks the transition between the regions and , see Fig. 4(b).
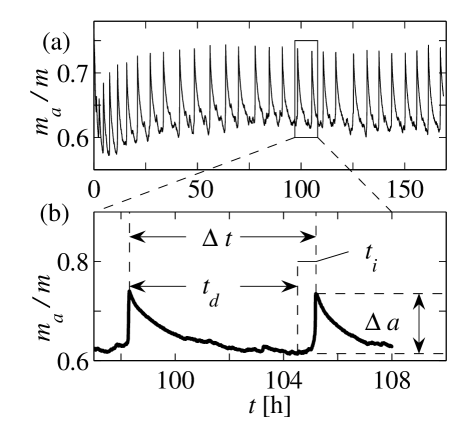
The amplitude of one oscillation is the change in normalized apparent mass during .
The weight oscillations initially have small amplitudes, , which increase toward a maximum after typically 3–16 oscillations. The amplitudes reduce somewhat after this maximum value; In some experiments they nearly disappear after 100 hours, while in others they are still at their maximum value after 200 hours. The period of an oscillation also tends to increase initially, and then stabilize at a constant value after typically 17–80 hours. In a few cases the period only stabilized after 150 hours, or not at all in the time span of the particular experiment. During , irregularities larger than the typical noise level occur in in most of the experiments, see Fig. 5, curve B. These irregularities are referred to as “micro-slips” in the following. Technically, a micro-slip, , is defined as the increase of in time intervals where the time derivative of is positive.
The observed oscillations in the apparent mass measured under the ductile granular ensemble was seen for all cylinder diameters and filling heights, and proved very robust to most perturbations applied to the system. Varying the cylinder diameter and the filling height of grains did not affect the amplitudes and periods in any consistent manner. Amplitudes spanned 3%–24% of the total mass and the periods were in the range –47) h when all experiments are considered. Two otherwise equal experiments could produce different characteristics, in one case producing amplitudes of 6% and 20%, and periods of 3.8 and 7.3 hours, respectively. The variability is probably due to details of the random packings that is beyond experimental control.
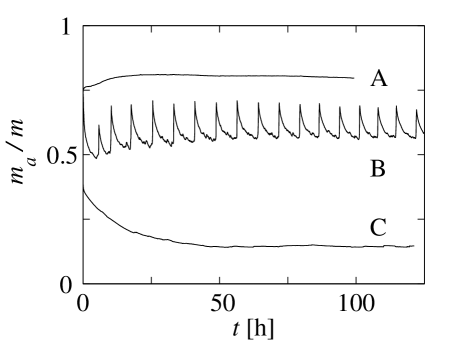
Changing the surface properties on the cylinder wall was the only perturbation that dramatically affected the oscillations. Figure 5 shows results from experiments in which the surface friction was reduced by Teflon (curve A), and enhanced by (400 grit) sandpaper (curve C). In the following these experiments are referred to as ‘the Teflon-’ and ‘the sandpaper experiment’, respectively. No alteration was done to the surface of the wall in the experiment that produced curve B, which, apart from the surface, was identical to the Teflon- and sandpaper experiments. As can be seen from the figure, reducing or enhancing the wall friction both removed the weight oscillations. By reducing the friction on the wall the apparent mass increased slightly from the initial value (curve A, Fig. 5). Although Teflon reduced friction considerably, it did not remove it fully, which would have made the apparent mass equal to the total mass of the grains.
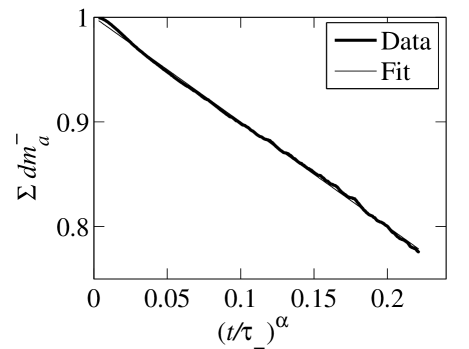
By increasing wall friction another behavior emerged, as the apparent mass decreased, apparently toward a constant level (curve C, Fig. 5). Curve C was fitted excellently by
| (1) |
where g, g, and is a characteristic time constant of h. The uncertainties are the likely error in the best fit parameters. Figure 6 shows the deviations between the data and the fit, .
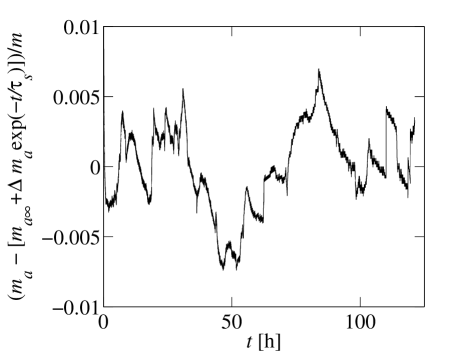
The exponential decay fits the observation exceptionally well, and the deviations are within the range of the normalized data. Nevertheless, micro-slips are easily recognizable above the experimental noise, which is of the order of (0.03 g/142.6 g) of the normalized apparent mass, while the slips are of the order of . The experimental noise is not visible in the figure.
A fit has also been made to the decreasing part of each oscillation in the curve of Fig. 4(a), which is consistent with logarithmic decay with time:
| (2) |
Here, is the apparent mass of the -th oscillation, and , and are best fit parameters to the equation, calculated for each oscillation separately. is the best fit value of at the start of the decrease, based on the first 2.5 h of the decreasing . g is the median value of , with the quartile deviations in brackets. is the median of the set of dimensionless constants , and h is the median and quartiles of the set of . Figure 7 shows the collapse of the weight data when plotted according to Eq. 2.
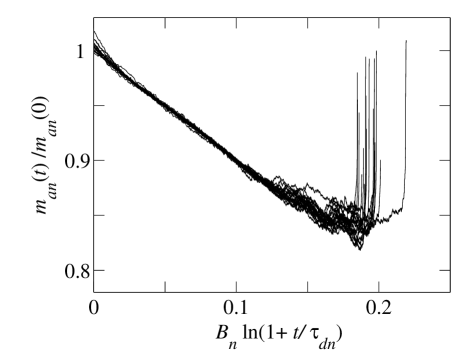
The limited dynamic range on both axes suggests that one can also fit the data by a power law with a small exponent. We have not found any theoretical arguments for the choice of one fit over the other, thus the main observation is that the decreasing parts of the oscillations have the same form over the first 2.5 hours, with a time constant of h. The sandpaper gave a decreasing exponential function with time, as gives the initial decrease of during in an oscillation:
| (3) |
The functional dependence is thus similar to the sandpaper at the start of the decrease, with a time constant of h.
The deviation from the fit is plotted for one oscillation in Fig. 8. Large deviations on the order of 2% of the total mass (the micro-slips) develop some time into (typically 3 hours in this experiment).
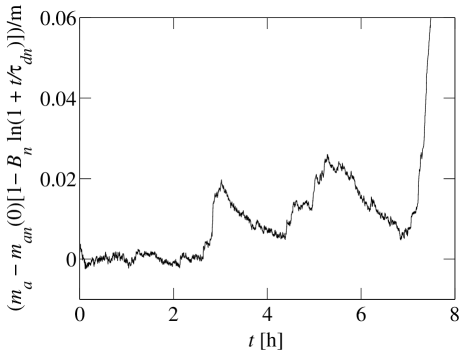
All visible irregularities in this plot is above the noise level of the measurements.
Taking the time derivative of as , the set of positive increments of (the micro-slips, ) and negative increments () were found for each oscillation’s . The micro-slips were removed from the decreasing part of the oscillations by cumulative summation of , and the resulting data set fitted by a power law,
| (4) |
The median and quartiles of the fitting parameters are [-0.02, 0.02], and [-37, 24] h, see Fig. 9.
No characteristic time exists for a power law, since fits equally well for all .
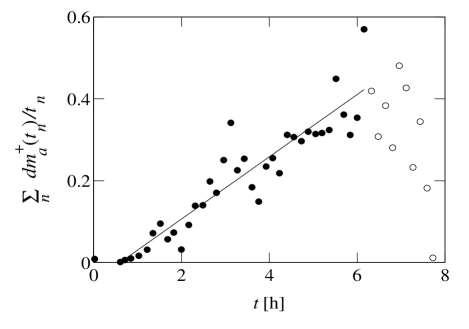
The micro-slips were found as a function of time in all the oscillations of the experiment shown in Fig. 4, and binned in 50 time intervals. The sum of micro-slips was taken for each bin, and divided by the size of the bin to produce the temporal evolution of micro-slip ‘activity’. Figure 10 presents the result. As the were of different lengths for each period, not all bins contain contributions from all oscillations. The bullets present times that include data from all oscillations, whereas a circle includes only data from long enough to contribute to the specific bin. The line through the data is a linear fit, based on all but the first bullet, given by . Here, h-2, and h. The activity presented by the bullet at is probably remnants from the big slip that occurred at , thus the micro-slip activity is initiated at time after each big slip and grows linearly until another big slip occurs.
We could not find a model with few parameters that would fit the ‘Teflon’ results (curve A in Fig. 5) due to the complex initial evolution. This curve also shows some micro-slips, of size , larger than the noise level of .
The measurements of the height of the system as function of time revealed that the vertical motion occurs in steps. This was seen in both strain experiments, and is shown in Fig. 11(a) and (c). Figures 11(b) and (d) show the simultaneous measurements of the normalized apparent mass, .
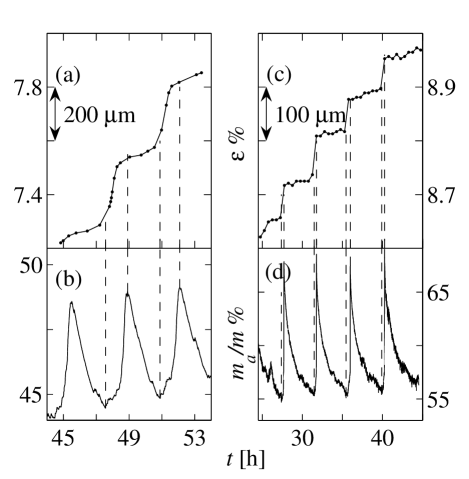
From the experiment with 3 m resolution, the minimum and maximum compaction velocities of the central part of the cylinder were found to be m/s and m/s, respectively. The maximum acceleration, occurring at the start of a compaction step, was m/s2. Comparing the region of decreasing of Fig. 11(b) to the strain in (a), a small but visible vertical movement occurs along the central axis of the packing during the weight decrease. The main increase of strain during one oscillation (that is, the step) takes place within the region in which the apparent mass increases from its minimum to its maximum. Unfortunately, the limited resolution of the strain measurements in Fig. 11(c) prevented a detailed comparison between the strain evolution of the 6 uppermost grains and the apparent mass. It is evident from this measurement, however, that the global strain motion is directly correlated with the changes in the apparent mass. A compaction velocity of the uppermost grains of (0.6–3) m/s was found during , and 4 m/s during .
The dynamics of the wall contacts were studied in one experiment as described in section II. Having found the ‘unwrapped’, properly scaled surface of the cylinder (see Fig. 3), we obtained a high contrast of the contact. The development of the area and center of mass position of each contact was followed through the experiment.
The weight oscillations correlated strongly to the contacts’ center of mass motion, while no such correlation was found with the changes in contact area.
The contacts were seen to move “simultaneously”, that is, within the temporal resolution of the images, which means they all slipped within a period of 15–20 minutes, during . Figure 12 shows the cumulative distribution of vertical contact displacement between two consecutive images. The contact displacement is normalized by the average contact diameter . Each curve corresponds to the distribution in one time step of the experiment. Curves A present the motion during slips, while curves B are the motion in time steps between slips. The gray band through B spans the average the standard deviation of vertical motion.
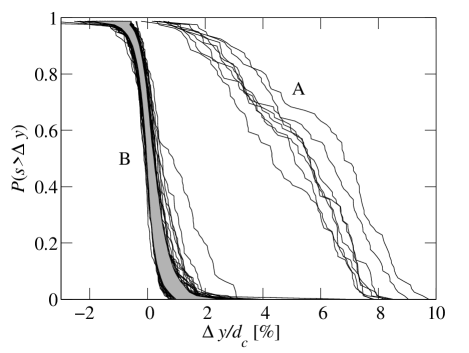
The median vertical displacement of a contact during a slip was 6 []% of the average contact diameter, . Outside of the slips the median displacement was only 0.07 []% of .
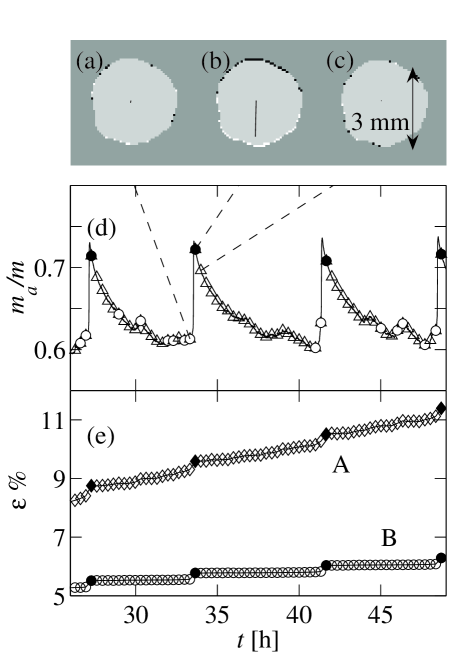
Figures 13(a), (b) and (c) show the difference in one contact area between consecutive images in one experiment. White corresponds to new contact area, black to area that was left since the previous image, and light gray shows contact area where no changes occurred. Figures 13(d) and (e) show the normalized apparent mass and the average strain of the upper (diamonds) and lower (circles) 20 wall contacts, respectively. The markers in both plots represent the times when pictures were taken. In Fig. 13(d) circles mark the times when 15% of the contacts moved more than 1% of the average contact diameter in 20 minutes (since the last image). The bullets show the times when 80% of the contacts moved at least 2% of the average contact diameter. Triangles represent the times when pictures were taken. Based on the observed area of the grain–wall contacts and the measured , the average load per square millimeter carried by a contact was calculated to be in the range (0.5–1.2) kPa.
Table 1 presents the characteristic values of various parameters: (a) gives the median period, amplitude, intervals and , and characteristic times and for the oscillations in one experiment (see Fig. 4). (b) presents the characteristic time from the fit of from the sandpaper experiment, and the estimated characteristic time of elastic relaxation (see section IV).
| Characteristic values | ||
|---|---|---|
| 6.4 [0.7, 1.2] h | ||
| 5.2 [0.3, 1.1] h | ||
| 0.8 [0.3, 1.0] h | ||
| (a) | 0.16 [0.02, 0.03] h | |
| 3.8 h | ||
| 0.6 0.2 h | ||
| 12.6 [0.3, 1.0] % | ||
| 13.52 0.01 h | ||
| (b) | h | |
| m | ||
| m | ||
| (c) | m | |
| –m | ||
One experiment was performed to understand how the granular geometry of the ensemble affected the apparent mass. The granular ensemble was exchanged with a non-porous slab of Play-Doh that did not fill the cylinder, but touched both the bottom and the walls of the setup. This experiment is referred to as ‘the bulk experiment’ in the following. The slab was left to flow into the available space, and the apparent mass was measured as before, see curve B of Fig. 14. Again, a granular version of this experiment was conducted for comparison, in which the total mass of the grains and the cylinder diameter were the same as those of the bulk experiment, see Fig. 14, curve A.
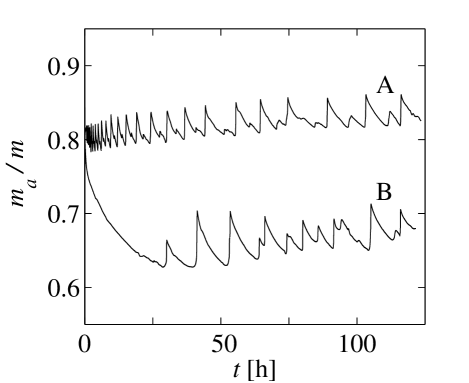
As seen from the figure, both setups produced weight oscillations, thus the granular geometry is not the (only) reason for the oscillations. Oscillations started later in the bulk case than in the granular case, and both systems show uncommon irregularities in their periods. The granular system had nearly 100 grain–wall contacts, while the bulk sample had 3–4 large contact areas. The oscillations are probably due to the multi-contact nature of the interface between the deforming sample and the confining cylindrical wall.
IV Discussion
The self-compaction of a ductile ensemble depends on the deformability of the grains and on a porous structure. The granular geometry of the ensemble was not necessary for oscillations to form, as weight oscillations also resulted under a bulk slab of material that deformed viscously into available space. This result emphasizes the importance of the multi-contact wall interaction to the observed oscillations in the apparent mass.
The grain–wall interaction proved to be crucial to the oscillations in the apparent mass by the experiments with varying wall friction. No oscillations were observed when increasing or decreasing the wall friction from that of the regular experiments with Plexiglas walls. The evolution of in these experiments is interesting because it shows two different behaviors according to the wall friction. A low wall friction resulted in an increasing apparent mass, while a high wall friction made the measured weight decrease. The same mechanisms leading to these results are likely to be the reason for the oscillations observed in in the regular experiments.
The reason for the decrease of the apparent mass must be that the walls sustain an increasing part of the total grain mass, that is, a dynamic vertical force must act on the grain contacts from the wall. This force could be friction, shear cohesion, or a combination of the two, and will be referred to as the grain–wall interaction in the following.
The increasing weight was initially believed to be due to a new internal grain–grain contact. As the stress distribution in hard granular media is known to be very sensitive to local arrangements of grains, a new contact was believed to change the stress distribution. New contacts would preferentially form in the vertical direction, because of the anisotropic compaction, and thus would tend to redirect stresses toward the bottom. The number of new contacts in the ensemble is limited, and the average number of contacts per grain increased from 6.5 to 7 Uri et al. during a typical experiment. 50–100 new contacts were expected to form during an experiment, which is roughly twice the typical number of oscillations. If we assume that not all new contact formations are noticed in , perhaps because of their position in a low stressed region, that would explain the shortage of oscillations, and the micro-slips in in the oscillations and the sandpaper experiment. On the other hand, this assumption directly disagrees with the nearly constant amplitudes seen in all experiments. The experiment of a bulk slab, which also produced weight oscillations, eventually proved that new internal contacts between grains were not the main reason for the weight oscillations. Stress redistribution is, however, thought to take place continuously during the slow internal flow of material, both in the granular and the bulk systems.
In principle, elastic energy could be stored in compressed parts of the packing after a slip, resulting in a decreased grain–wall interaction. The relaxation of this elastic energy could cause the observed decrease in the apparent mass. The characteristic time of elastic relaxation is expressed as the ratio of viscosity to bulk modulus . We know that the viscosity of Play-Doh is of the order of Pa s for shear rates as low as s-1. The bulk modulus was not measured, but it is expected to be closer to that typical of fluids ( 1–2 GPa, Tennent (Twenty-first impression 1997, first published 1971)) than that of iron ( GPa, Cardarelli (2000)), thus on the order of Pa. The resulting estimate of elastic relaxation time for Play-Doh is
| (5) |
Elastic compressive stresses should relax in (less than) seconds, which is much less than any time scale observed in an oscillation.
Another explanation for the decreasing emerges from the assumption that the ratio of horizontal to vertical stresses increases with increasing packing fraction. If friction is assumed to be proportional to the normal force, an increasing horizontal stress in the packing would result in increased wall friction, hence a decrease in . The packing fraction increases approximately 10% during the experiment, while the characteristics of the oscillations does not change. This implies that the packing fraction is not the main parameter for describing the dynamic behavior.
The reason for a decreasing apparent mass can be seen in connection to the shearing of grain–wall contact regions. During the time of decreasing the strain increases very slowly, suggesting that only an internal flow of grains contributes to the strain in this regime (see Fig. 11(a) and (b)). The analysis of the motion of grain–wall contacts shows that the vertical motion of contacts in this regime is limited and noisy, thus most contacts are practically at rest (even though the central part of the packing creeps). Due to the slow flow internally in the packing, they are also continuously sheared.
There are clear slips of the order of 2% in the normalized apparent mass during the decreasing part of the period in the granular setups (see Figs. 4 and 8). Micro-slips are not seen in the weight data from the bulk experiment, thus their origin seems to be the granular geometry, or possibly the large difference in the number of wall contacts between the bulk and granular systems. No collective motion is seen at the wall during the micro-slips in the granular experiment, although 5% of the contacts move a distance of 1% of in every time step, thus their motion might be connected to the measured micro-slips in . Micro-slips might be due to the internal reorganization of forces within the granular system, which may trigger some of the grain–wall contacts into motion. A reorganization of forces must also take place in the material in the bulk experiment, although probably in a different way than that of the more complex granular geometry. The reorganization must increase the average shear stress in the contact regions, which again leads to an increase of the vertical grain–wall interaction. Once a contact experiences a shear stress that can not be sustained by the grain–wall interaction, it “breaks”, or starts to move.
The strain development could not be measured in the sandpaper experiment, thus whether this system compacted much is not known. Similar, but smaller, micro-slips than those seen in regular experiments were seen in the sandpaper experiment. This suggests that internal stress rearrangement was taking place. The grain–wall interaction was considerably higher in the sandpaper experiment than in the regular setup (as the apparent mass reached a minimum of 15% of the total mass). It is reasonable to assume that the contacts did not move much, or in any correlated manner, based on the lack of weight oscillations.
The direct correspondence between the step in the strain and the increasing in Fig. 11(a) and (b) implies that the motion of wall contacts is very important for the weight increase. Assuming that wall contacts are broken, or mobilized, at a critical shear stress, one or more contacts will initiate a slip, and the others follow. The contacts that break contribute to a decrease in the total wall interaction, thus a possible increase of the apparent mass. The sum of wall interactions decrease over a time period that must depend on how fast the contact breaking propagates among the other contacts, and how fast each contact breaks. From our temporal resolution in the study of grain–wall contacts, we see that all grains move within 20 minutes in connection with the slip. The apparent mass will increase according to the decreasing wall interaction , as the force balance of the system is N .
The strain development was not measured in the Teflon experiment, thus it is not known whether the strain had similar steps during the compaction as in the regular experiments. Based on the direct correlation between weight oscillations and the observed strain in the regular experiments, however, it seems likely that the wall contacts in the Teflon experiment in some sense moved continuously, as no oscillations in were observed here. Micro-slips were observed in , however, thus some dynamic interaction between the grains and the wall was present, probably because of internal stress rearrangements. Sliding contacts also support some of the grain mass, as neither during in the regular experiments nor in the Teflon experiment does the apparent mass reach 100% of the grain mass. The grain–wall interactions during motion are smaller, however, than in the static case, as the apparent mass increases during motion in the regular experiments, see Fig. 11.
That all contacts are mobilized within a time interval corresponding to a slip could imply that, when sufficiently sheared, they are sensitive to changes in the stress distribution, and thus easily triggered. From Fig. 13(d) we see that more than 80% of the contacts move more than 2% of during a slip event, and that 15% move at least 1% of immediately before these slips. In some cases, although not consistently, 15% of the contacts move at least 1% of in connection to micro-slips. Also, the activity of micro-slips increases during , which suggests that the system becomes more critical.
The time scales of the system spans a factor 100, see Table 1, ranging from 0.16 h to 13.52 h. It is tempting to speculate that these time scales reflect the spatial dimensions in the system, from 1 mm (diameter of small contact area) to 10 cm (filling height). A direct estimate of the maximum length scale can be made from the velocities and the observed time scales. Assuming that the grain–wall contacts in the sandpaper experiment do not slip, the internal flow of velocity m/s with the characteristic time gives a length scale m. The corresponding length from the initial exponential decrease of in an oscillation is m/s = 74 m, and from the and , we get m and 115–200m, respectively. is the velocity of the bulk during a slip. The range of results from the different compaction velocities found during in the two experiments presented in Fig. 11. The length scales extracted from the characteristic times span a smaller range than the time scales do, and are much smaller than the macroscopic lengths mentioned above. The small length scales suggest that details of the contact motion might be of importance to the time scales observed in the system.
Flow of viscous fluid along a wall can be described by a Navier length de Gennes (2002). An average contact velocity, , during a slip can be found from knowing that contacts slip 6% of the average contact diameter in 20 minutes, m/s. The amount of fluid slip along a wall is given by the Navier length, , where is the fluid viscosity and is the surface friction coefficient given by . The average shear, , of a contact was found to be between 0.5–1.2 kPa, thus is within the range (2.7–11) Pa s/m. The Navier length is then –90m, slightly smaller, but of the same order as some of the lengths estimated above.
The motion of a contact was not studied with sufficient temporal or spatial resolution to conclude whether the whole contact slid a fraction of at constant velocity, or it slid by self-healing slip pulses Gerde and Marder (2001); Baumberger et al. (2002). Both processes are known from experiments on frictional motion in low velocity sheared systems of (hard) granular systems Nasuno et al. (1998) and slipping of a gel/glass interface Baumberger et al. (2002).
V Conclusions
We observe semi-regular oscillations in the measured apparent mass, , at the bottom of a self-compacting ductile grain packing. The oscillations in one particular experiment are on the order of 10% of the total mass of the grains, and have periods of roughly 6 hours. The oscillations persist when the granular setup is exchanged with a bulk sample of the same ductile material, but disappear when the grain–wall interaction is reduced or increased. Grain–wall contacts are seen to move collectively in correspondence to the slip events in , as at least 80% of the contacts move a distance larger than 2% of the average contact diameter during a slip, see Figs. 12 and 13.
The decrease of the apparent mass in an oscillation is thought to be the result of shearing of static wall contacts between grains and the container wall. The slow ductile flow internally in the cylinder causes a dynamic stress distribution, which results in a continuous increase of the shear stress at the grain–wall contacts. This continuous increase is the reason for the decreasing apparent mass.
“Micro-slips” of the order of 2% are seen in the normalized apparent mass during the decrease, which probably result from internal stress redistribution in granular setups, as they were not seen in of the bulk experiment. The micro-slips correspond in some cases to limited grain–wall contact motion, and their ‘activity’ increases during the interval of decreasing . These slips are also seen when the grain–wall interaction is reduced or enhanced, that is, when contact motion is stimulated or repressed.
Different characteristic times have been found from curve fitting of the apparent mass evolution during the ‘sandpaper’ experiment and the decreasing part of oscillations in one experiment. We have also estimated a typical timescale of relaxation of elastic compressive stresses, and concluded that elasticity is not the driving mechanism for the observed oscillations. The characteristic times, together with the period and intervals of increasing and decreasing , are presented in Table 1. A successful model should reproduce these characteristic times.
Some attempts at constructing a minimum model have been pursued, but the models were discarded as they depended on a finite acceleration or on unknown microscopic parameters of the system. Further work is necessary to understand the dynamic behavior of the system, and ideas and modeling approaches are welcome.
VI Acknowledgments
We wish to thank the Norwegian Research Council for financial support through grant number 146031. Many thanks also to Thomas Walmann for help with image analysis, and Renaud Toussaint, Jean Christophe Geminard, Espen Jettestuen, and Yuri Podladchikov for helpful discussions. Thanks to Bo Nyström and Anna-Lena Kjøniksen for viscosity measurements.
References
- Janssen (1895) H. A. Janssen, Zeitschrift des Vereines deutscher Ingenieure 39, 1045 (1895).
- Duran (1999) J. Duran, Sands, Powders, and Grains (Springer-Verlag New York, 1999).
- Arroyo-Cetto et al. (2003) D. Arroyo-Cetto, G. Pulos, R. Zenit, and M. A. Jiménez-Zapata, Phys. Rev. E 68 (2003).
- Vanel et al. (2000) L. Vanel, P. Claudin, J.-P. Bouchaud, M. E. Cates, E. Clément, and J. P. Wittmer, Phys. Rev. Lett. 84 (2000).
- de Gennes (1999) P. G. de Gennes, Rev. Mod. Phys 71 (1999).
- Vanel et al. (1999) L. Vanel, D. Howell, D. Clark, R. P. Behringer, and E. Clément, Phys. Rev. E 60 (1999).
- Geng et al. (2001) J. Geng, D. Howell, E. Longhi, R. P. Behringer, G. Reydellet, L. Vanel, E. Clément, and S. Luding, Phys. Rev. Lett. 87 (2001).
- Brockbank et al. (1997) R. Brockbank, J. M. Huntley, and R. C. Ball, J.Phys.II 7, 1521 (1997).
- (9) J. M. Erikson, N. W. Mueggenburg, H. M. Jaeger, and S. R. Nagel, arXiv:cond-mat0206062v1.
- h. Liu et al. (1995) C. h. Liu, S. R. Nagel, D. A. Schecter, S. N. Coppersmith, S. Majumdar, O. Narayan, and T. A. Witten, Science 269, 513 (1995).
- Løvoll et al. (1999) G. Løvoll, K. J. Måløy, and E. G. Flekkøy, Phys. Rev. E 60, 5872 (1999).
- Bertho et al. (2003) Y. Bertho, F. Giorgiutti-Dauphiné, and J.-P. Hulin, Phys. Rev. Lett. 90 (2003).
- Ovarlez et al. (2003) G. Ovarlez, C. Fond, and E. Clément, Phys. Rev. E 67 (2003).
- Ovarlez and Clément (2003) G. Ovarlez and E. Clément, Phys. Rev. E 68 (2003).
- Nasuno et al. (1998) S. Nasuno, A. Kudrolli, A. Bak, and J. P. Gollub, Phys. Rev. E 58, 2161 (1998).
- mis (a) The weight is measured as a force , but the logged data are given in units of mass using the relation , where is the gravitational acceleration.
- mis (b) The vertical change in position was less than a micrometer for the loads applied in our experiment. Reference: S. de Villiers, personal communication.
- mis (c) Measured with a Paar-Physica MCR 300 rheometer.
- mis (d) The imaged projection of the curved surface was scaled to that of a flat plane, reproducing the surface as seen normal to the curved container wall.
- (20) L. Uri, L. Alberts, T. Walmann, D. K. Dysthe, and J. Feder, arXiv:cond-mat/0510358.
- Tennent (Twenty-first impression 1997, first published 1971) R. M. Tennent, ed., Science data book (Oliver and Boyd, Twenty-first impression 1997, first published 1971).
- Cardarelli (2000) F. Cardarelli, Materials handbook. A concise desktop reference. (Springer-Verlag London Limited, 2000).
- Gerde and Marder (2001) E. Gerde and M. Marder, Nature 413, 285 (2001).
- Baumberger et al. (2002) T. Baumberger, C. Caroli, and O. Ronsin, Phys. Rev. Lett. 88, 075509 (2002).
- de Gennes (2002) P. G. de Gennes, Langmuir 18, 3413 (2002).