Gas adsorption/desorption in silica aerogels: a theoretical study of scattering properties
Abstract
We present a numerical study of the structural correlations associated to gas adsorption/desorption in silica aerogels in order to provide a theoretical interpretation of scattering experiments. Following our earlier work, we use a coarse-grained lattice-gas description and determine the nonequilibrium behavior of the adsorbed gas within a local mean-field analysis. We focus on the differences between the adsorption and desorption mechanisms and their signature in the fluid-fluid and gel-fluid structure factors as a function of temperature. At low temperature, but still in the regime where the isotherms are continuous, we find that the adsorbed fluid density, during both filling and draining, is correlated over distances that may be much larger than the gel correlation length. In particular, extended fractal correlations may occur during desorption, indicating the existence of a ramified cluster of vapor filled cavities. This also induces an important increase of the scattering intensity at small wave vectors. The similarity and differences with the scattering of fluids in other porous solids such as Vycor are discussed.
pacs:
64.70.Fx, 75.60.Ej, 61;20.Gy,67.70.+nI Introduction
In a series of recent papersDKRT2003 ; DKRT2004 ; DKRT2005 , we have presented a comprehensive theoretical study of gas adsorption/desorption in silica aerogels, revealing the microscopic mechanisms that underly the changes in the morphology of the hysteresis loops with temperature and gel porosity. In particular, we have shown that the traditional capillary condensation scenario based on the independent-pore modelGS1982 does not apply to aerogels, as a consequence of the “open” nature and interconnectedness of their microstructure. We have found, on the other hand, that nonequilibrium phase transitions (that differ on adsorption and desorption) are at the origin of the very steep isotherms observed with 4He in high porosity gels at low temperatureC1996 ; TYC1999 . In this work, we complete our study by investigating the correlations within the adsorbed fluid and computing the fluid-fluid and solid-fluid structure factors that can be measured (at least indirectly) in scattering experiments. Scattering methods (using x-rays, neutrons and visible light) are now frequently combined with thermodynamic measurements for extracting information on the structure and the dynamics of the adsorbed molecules and understanding the influence of solid microstructure on fluid propertiesH2004 . In the case of 4He in aerogel, both small-angle x-ray scattering (SAXS)LMPMMC2000 and light scattering measurementsLGPW2004 have been recently performed along the sorption isotherms. However, the interpretation of the scattered intensity is always complicated by the fact that it contains several contributions that cannot be resolved without assuming some mechanism for the sorption process. For instance, in the case of a low porosity solid like Vycor, the evolution of the scattered intensity along the capillary rise is usually interpreted in the framework of an independent-pore model, with the gas condensing in pores of increasing size that are (almost) randomly distributed throughout the materialLRHHI1994 ; PL1995 ; KKSMSK2000 . This explains that long-range correlations are not observed during adsorption. On the other hand, we have shown that large-scale collective events occur in aerogels, and this may have a significant influence on the scattering properties. Indeed, we shall see in the following that scattering curves at low temperature may not reflect the underlying microstructure of the gel. More generally, our main objective is to understand how the different mechanisms for adsorption and desorption reflect in the scattering properties as the temperature is changed. (Note that there has been a recent theoretical study of this problem that is closely related to the present oneSG2004 ; there are, however, significant differences that will be commented in due place.) Particular attention will be paid to the ‘percolation invasion’ regime that is predicted to occur during the draining of gels of medium porosity (e.g. ) and that manifests itself by the presence of fractal correlations. Such correlations have been observed in VycorLRHHI1994 ; PL1995 ; KKSMSK2000 and xerogelH2002 , but no experiment has been carried out so far to detect a similar phenomenon in aerogels. We therefore hope that the present work will be an incentive for such a study. On the other hand, the influence of gel porosity on scattering properties will only be evoked very briefly. In particular, for reasons that will be explained below, the correlations along the steep (and possibly discontinuous due to nonequilibrium phase transitions) isotherms observed in high porosity gels at low temperature are not investigated.
The paper is organized as follows. In section 2, the model and the theory are briefly reviewed and the cart.texomputation of the correlation functions and the corresponding structure factors is detailed. The numerical results are presented in section 3. The relevance of our results to existing and future scattering experiments is discussed in section 4.
II Model and correlation functions
II.1 Lattice-gas model
As discussed in previous papersDKRT2003 ; DKRT2004 ; DKRT2005 , our approach is based on a coarse-grained lattice-gas description which incorporates the essential physical ingredients of gel-fluid systems. The model Hamiltonian is given by
| (1) |
where is the fluid occupation variable () and is the quenched random variable that describes the solid microstructure (when , site is occupied by the gel; is thus the gel porosity). Specifically, we adress the case of base-catalyzed silica aerogels (typically used in helium experiments) whose structure is well accounted for by a diffusion limited cluster-cluster aggregation algorithm (DLCA)M1983 . In the Hamiltonian, and denote respectively the fluid-fluid and gel-fluid attractive interactions, is the fluid chemical potential (fixed by an external reservoir), and the double summations run over all distinct pairs of nearest-neighbor (n.n.) sites.
Fluid configurations along the sorption isotherms are computed using local mean-field theory (i.e. mean-field density functional theory), neglecting thermal fluctuations and activated processes (the interested reader is referred to Refs.DKRT2003 ; DKRT2004 ; DKRT2005 for a detailed presentation of the theory). As varies, the system visits a sequence of metastable states which are local minima of the following grand-potential functional
| (2) |
where is the thermally averaged fluid density at site . Earlier work has shown that this approach reproduces qualitatively the main features of adsorption phenomena in disordered porous solidsKMRST2001 ; SM2001 .
All calculations presented below were performed on a body-centered cubic lattice of linear size () with periodic boundary conditions in all directions (the lattice spacing is taken as the unit length). is large enough to faithfully describe gels with porosity , but an average over a significant number of gel realizations is required to obtain a good description of the correlation functions. In the following, we use realizations. is taken as the energy unit and temperatures are expressed in the reduced unit , where is the critical temperature of the pure fluid ( for helium and in the theory). The interaction ratio is equal to so as to reproduce approximately the height of the hysteresis loop measured with 4He in a porosity aerogel at DKRT2003 ; TYC1999 .
II.2 Correlation functions and structure factors
In a scattering experiment performed in conjunction with gas adsorption/desorption, one typically measures a (spherically averaged) scattered intensity which is proportional to a combination of the three partial structure factors and , where and denote the gel and the fluid, respectively. Whereas a macroscopic sample is usually considered as isotropic and statistically homogeneous, our calculations are performed in finite samples and on a lattice, and some work is needed to obtain structure factors that can be possibly compared to experimental data.
Let us first consider the gel structure factor. The calculation of proceeds in several steps. As in the case of an off-lattice DLCA simulationH1994 , we first compute the two-point correlation function by performing a double average over the lattice sites and the gel realizations,
| (3) |
taking care of the periodic boundary conditions. Here, , is the lattice fraction occupied by the gel, and the second term in the right-hand side takes into account the fact that there are only one particle per site, which yields the (point) hard-core condition, . In this expression and in the following, the overbar denotes an average over different gel realizations produced by the DLCA algorithm. The computation of is efficiently performed by introducing the Fourier transform where is a vector of the reciprocal lattice, and by using the fast Fourier transform (FFT) methodMLW1996 ; SG2004 . This reduces the computational work to instead of when the direct real-space route is used. (The same method is applied to the other correlation functions.)
In a second step, we “sphericalize” the correlation function by collecting the values having same modulus of the argument ,
| (4) |
Finally, instead of storing the values of for all possible distances on the lattice between , the nearest-neighbor distance, and , we bin the data with a spacing and interpolate linearly between two successive points (the restriction to avoids boundary artefacts). Moreover, we impose the “extended” hard-core condition for , in line with our interpretation of a gel site as representing an impenetrable silica particleDKRT2003 . (In Ref. SG2004 , in contrast, the model is thought of as a discretization of space into cells of the size of a fluid molecule and the gel particle “radius” is varied from to lattice spacings.) Of course, the interpolation procedure does not completely erase the dependence on the underlying lattice structure, especially at short distances. Following Ref.H1994 , the structure factor is then computed using
| (5) |
where is a very small parameter adjusted such that as . Indeed, since the DLCA aerogels are built in the “canonical” ensemble with a fixed number of gel particles , the following sum-rule holds:
| (6) |
which readily yields in Fourier space. This trick allows one to obtain a reasonable continuation of below H1994 .
Similarly, the fluid-fluid two-point correlation function is defined as
| (7) |
where is the average fluid density and the sum is performed again over all lattice sites to improve the statistics (for notational simplicity, we have dropped the overbar on ). Because of the double average over thermal fluctuations and over disorder, there are two distinct contributions to , which are usually called “connected” and “blocking” or “disconnected” GS1992 ; RTS1994 , and which, in the present case, are given by the expressions,
| (8) | |||
| (9) |
In the pure fluid, is just the standard connected pair correlation function whereas has no equivalent. It turns out, however, that only can be computed along the sorption isotherms. Indeed, the quantity cannot be obtained in the framework of mean-field theory, and the only available route to is via the “fluctuation” relationRTS1994
| (10) |
where is a site-dependent chemical potentialnote2 . However, this relation only holds at equilibrium (like the Gibbs adsorption equation discussed in Ref.DKRT2003 ) and therefore it cannot be applied along the hysteresis loop where the system jumps from one metastable state to another. (In a finite sample, the grand potential changes discontinuously along the adsorption and desorption desorption branchesDKRT2003 .) We are thus forced to approximate by its disconnected part, note1 . However, this may not be a bad approximation at low temperature because the local fluid densities are then very close to zero or oneDKRT2003 , which likely implies that is a much smaller quantity than note4 .
We then apply to the same procedure as for , taking radial averages and then performing a binning of the data and a linear interpolation. There are no “extended” hard-core in this case. Indeed, since the scale of the coarse-graining is fixed by the size of a gel particle (typically, a few nanometers), a lattice cell may contain several hundreds of fluid molecules which may be thus considered as point particles. is then also interpolated between and .
In a grand-canonical calculation, the number of fluid particles fluctuates from sample to sample, which implies the following sum-rule for the disconnected pair correlation function RTS1994 (and thus for in our approximation)
| (11) |
where is the average fluid density for a given gel realization. This sum-rule can be used to also extrapolate below , using
| (12) |
where is adjusted so that .
Finally, the gel-fluid two-point correlation function is computed from
| (13) |
and then sphericalized, binned, and linearly interpolated (taking for since no fluid molecule can be found at a distance less than from the centre of a gel particle). The cross structure factor is then obtained from
| (14) |
where is adjusted so as to satisfy the sum-rule which again results from the absence of fluctuations in the number of gel particles.
III Numerical results
III.1 Aerogel structure
We first concentrate on the case of the empty aerogel. We have already presented in Ref.DKRT2003 the pair correlation function for several porosities between and . These curves exhibit a shallow minimum that strongly depends on and whose position gives an estimate of the gel correlation lenght , as suggested in Ref.H1994 . A DLCA gel can indeed be sketched as a disordered packing of ramified blobs with average size . For instance, varies approximately from to lattice spacings as the porosity increases from to (this is much smaller than the box size , which ensures that there are no finite-size artifacts in the calculation of the gel structurenote5 ). Only the highest-porosity samples exhibit a significant power-law regime that reveals the fractal character of the intrablob correlations.
Although we shall essentially focus in the following on the case of the porosity gel, for the sake of completeness we show in Fig. 1 the evolution of the simulated gel structure factor with porosity.
The curves closely resemble those obtained with the continuum modelH1994 . In particular, they exhibit the same damped oscillations at large that result from the “extended” hard-core condition for (the oscillations, however, are more significant in the continuum model). The range of the linear fractal regime increases with porosity (it is almost non-existent in the gel) and corresponds asymptotically to a fractal dimension (the value was obtained in Ref.DKRT2003 from the plot for the aerogel). A characteristic feature of the curves is the existence of a maximum at smaller wavevectors whose location decreases with porosity and correlates well with (). This maximum is thus the Fourier-space signature of the shallow minimum observed in . (Note that varying the size has only a weak influence on the small portion of the curves for the and gels, which validates the continuation procedure used in Eq. 5.)
To compute the scattering intensity and compare to the results of small-angle x-rays or neutron experiments, it is necessary to introduce a form factor for the gel particles. One can use for instance the form factor of spheres with radius , . The curve then differs from in the large- regime () where it follows the Porod law P1982 . On the other hand, the intermediate “fractal” regime () where , and the location of the maximum are essentially unchanged. By comparing the value of in Fig. 1 with the actual value in the experimental curves (displayed for instance in Ref.H1994 ), we can thus fix approximately the scale of our coarse-graining. For , Å-1 which yields nm, a reasonable value for base-catalysed silica aerogels which is in agreement with the estimation of Ref.DKRT2003 obtained from the gel correlation length . It is worth noting that the DLCA simulated structure factors present a more pronounced maximum at than the experimental curves , as already noticed in the literatureH1994 ; OJ1995 . There are obviously large scale inhomogeneities in actual aerogels that are not reproduced in the simulations. Moreover, as emphasized in Refs.H1994 ; OJ1995 , there are some significant details that are neglected in the DLCA model, such as the rotational diffusion of the aggregates, their polydispersity and irregular form, and all kinds of possible restructurating effects.
III.2 Fluid structure during adsorption
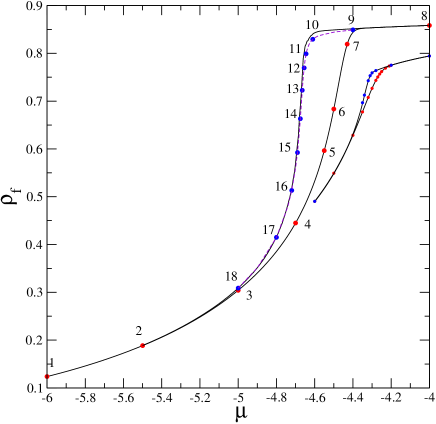
As shown in Refs.DKRT2003 ; DKRT2004 ; DKRT2005 , the elementary condensation events (avalanches) that occur in 87% porosity aerogel as the chemical potential is slowly varied are always of microscopic size, whatever the temperature. This implies that the adsorption isotherms are smooth in the thermodynamic limit or when averaging over a large number of finite samples, as illustrated in Fig. 2. We have computed the correlation functions and the corresponding structure factors for a number of points along the and isotherms, as indicated in the figure. We first consider the lowest temperature.
Figs. 3 and 4 show the evolution of the correlation functions and with chemical potential. One can see that the curves change significantly as increases (note that the vertical scale in Fig. 3(a) is expanded so as to emphasize the presence of a shallow minimum in the curves; accordingly, the values of near zero are not visible). For very low values of the chemical potential (e.g. ), looks very much like , apart from a shift towards larger values of by a distance of about lattice spacings. Indeed, as shown in our earlier workDKRT2003 ; DKRT2004 , in the early stage of the adsorption process, the adsorbed fluid forms a liquid film that coats the aerogel strands and whose thickness is approximately one lattice spacing at low temperature. In consequence, the distribution of the fluid particles follows the spatial arrangement of the aerogel, a feature already observed in a continuum version of the modelKKRT2001 . The existence of the liquid film also reflects in the rapid decrease of with , which indicates that the fluid is only present in the vicinity of the gel particles (the fact that may be ascribed to the connectivity of the gel: around a gel particle, there are always other gel particles - in average in the first shell - and the probability to find a fluid particle is thus suppressed).
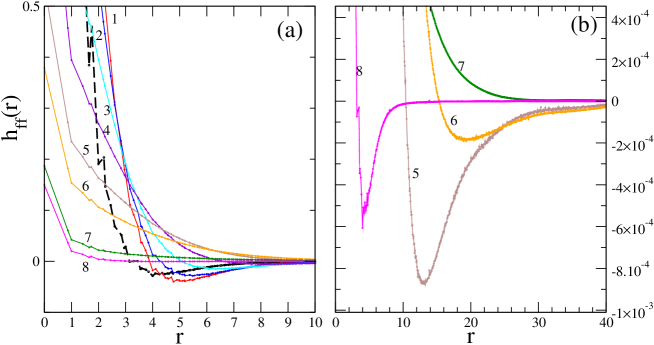
As increases, the magnitude of the fluid-fluid correlations decreases at small (the contact value decreases from to ) and the depth of the minimum in decreases as it shifts to larger values of (its location varies from to as increases from to ). The minimum disappears as the last voids in the gel fill with liquid (note the difference in the vertical scales of Figs. 3(a) and 3(b)), and finally, as one reaches saturation (at ), the shape of the gel-gel correlation function is approximately recovered, in accordance with Babinet principleP1982 ; note6 . A similar behavior is observed in the cross correlation function in Fig. 4, but the minimum occurs at a smaller distance (its location is approximately when it disappears).
Like for , we may associate to the location of the mimimum in a length that characterizes the correlations within the adsorbed fluid. The fact that becomes significantly larger than as the adsorption proceeds shows that the fluid develops its own complex structure that does not reflect anymore the underlying gel structure. This is likely in relation with the fact that some of the condensation events studied in our previous worksDKRT2004 ; DKRT2005 extend much beyond the largest voids in the aerogelnote9 . It is worth noting that these large avalanches (with a radius of gyration DKRT2004 ; DKRT2005 ) occur approximately in the same range of chemical potential () where reaches its maximum (this also corresponds to the steepest portion of the isotherm).
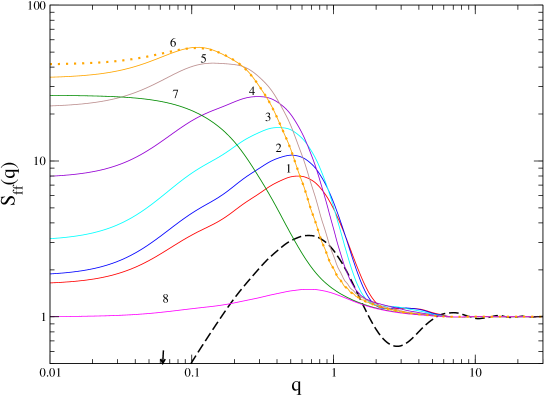
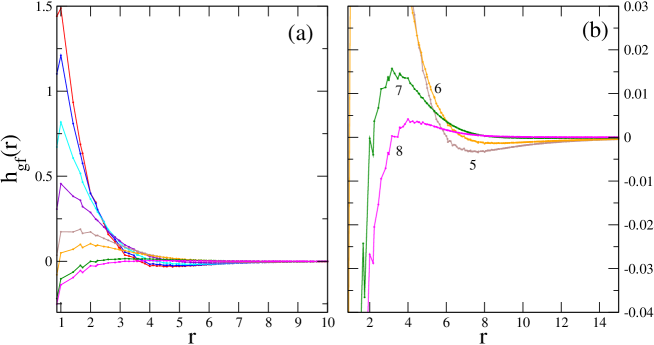
The corresponding structure factors and are shown in Figs. 5 and 6, respectivelynote7 . The main feature in is the presence of a broad peak that grows and moves towards smaller wavevector as the fluid condenses in the porous space. This peak is clearly associated to the minimum in (its location is approximately proportional to ) and it thus tells us the same story: the growing of a characteristic length scale in the fluid along the capillary rise. The peak disappears in the last stage of the adsorption process and is then replaced by a plateau (see curve 7 in Fig. 5). Finally, at , one recovers a structure factor that can be deduced from by a linear transformation, in accordance with Babinet principle (there are no oscillations in , however, because the fluid-fluid hard-core diameter is zero).
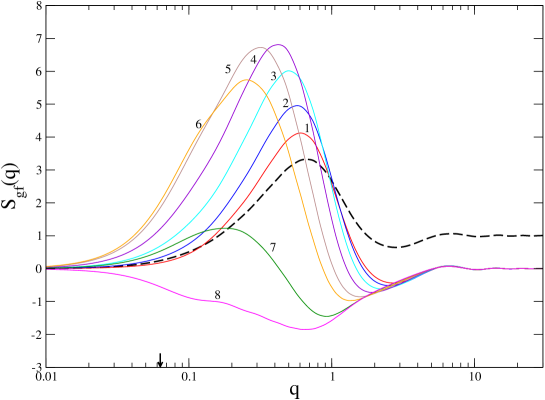
The evolution of the gel-fluid cross structure factor is somewhat different. The peak is more prominent, as a consequence of the ‘no-fluctuation’ condition (this feature may not be so pronounced in actual systems because of large-scale fluctuations), and it is located at a larger wavevector than in (in line with the corresponding locations of the minima in and ). The most substantial difference with is that the amplitude of the peak starts to decrease much before the end of the adsorption process. The negative correlation observed at saturation is again due to complementarity with the gel-gel structureSG2004 .
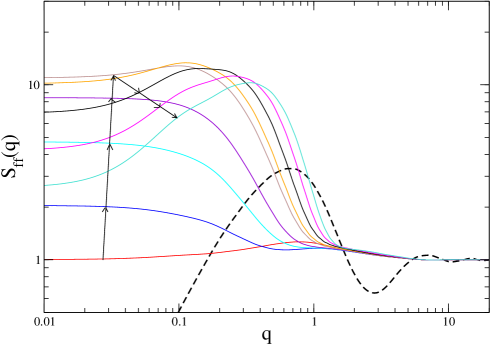
We have repeated these calculations at in order to investigate the influence of temperature. In the gel, is just below , the temperature at which the hysteresis loop disappears (see Fig. 2). and still exhibit a minimum that moves towards larger upon adsorption. However, the characteristic length , associated to the minimum of , does not exceed lattice spacings, indicating that the size of the inhomogeneities in the fluid decreases with increasing . A similar observation was made in Ref.DKRT2004 ; DKRT2005 concerning the size of the avalanches which become more compact at higher temperature and often correspond to a condensation event occuring in a single cavity of the aerogel. The shape of the corresponding structure factors does not change significantly with respect to the case, but the amplitude is significanly reduced: the maximal amplitudes of the peaks in and are divided approximately by and , respectively.
As shown in Refs.DKRT2003 ; DKRT2004 ; DKRT2005 , temperature has a much more dramatic influence on the adsorption process in gels of higher porosity. In particular, at low enough temperature ( with in the gelDKRT2005 ), a macroscopic avalanche occurs at a certain value of the chemical potential, with the whole sample filling abruptly, which results in a discontinuous isotherm in the thermodynamic limit. In a finite system, the signature of a macroscopic avalanche is a large jump in the fluid density whose location in fluctuates from sample to sample, which results in a steep but smooth isotherm after an average over the gel realizations (one then has to perform a finite-size scaling study to conclude on the proper behavior in the thermodynamic limitDKRT2003 ; DKRT2005 ). Within a grand canonical calculation, there is unfortunately no way to study the evolution of the structural properties of the fluid during a macroscopic avalanche as this would require to consider intermediate fluid densities that are inaccessiblenote8 (the situation would be different if the fluid density was controlled instead of the chemical potential, as is done frequently in experimentsTYC1999 ; WC1990 ). All we can do is to study the gel at a higher temperature where the adsorption is still gradual, for instance at . In this case, no qualitative change is found with respect to the case of the gel at . Indeed, as emphasized in Ref.DKRT2005 , adsorption proceeds similarly in a high-porosity gel at high temperature and in a lower-porosity gel at low temperature. The correlation length is somewhat larger in the gel (beyond lattice spacings) so that finite-size effects come into play (in particular, it becomes problematic to extraplotate to so as to simulate the infinite-size limit). To go to lower temperatures, it would be thus necessary to use a much larger simulation box, which would increase considerably the computational work. Note that one expects to decay algebraically at the critical temperature . Indeed, according to the analogy with the nonequilibrium random-field Ising model (RFIM), there should be only one important length scale in the system close to criticality, length scale which is proportional to the average linear extent of the largest avalanchesDS1996 . At criticality, this correlation length diverges.
III.3 Fluid structure during desorption
As discussed in detail in Refs.DKRT2003 ; DKRT2004 , different mechanisms may be responsible for gas desorption in aerogels, depending on porosity and temperature. In contrast with adsorption, the outer surface of the material where the adsorbed fluid is in contact with the external vapor may play an essential role. For instance, in the aerogel at , the theory predicts a phenomenon akin to percolation invasion : as is decreased from saturation, some gas “fingers” enter the sample and grow until they percolate at a certain value of , forming a fractal, isotropic cluster. The desorption then proceeds gradually via the growth of the gaseous domain. Accordingly, in the thermodynamic limit, the isotherm shows a cusp at the percolation threshold followed by a steep but continuous decrease (the cusp is rounded in finite samples).
The simulation of the desorption process thus requires the use of an explicit external reservoir adjacent to the gel sample, which of course introduces a severe anisotropy in the model and makes it difficult to calculate radially averaged correlation functions. To circumvent this problem, we have used another procedure where the desorption is not initiated by the interface with an external reservoir but triggered by the presence of gas bubbles inside the material. We have indeed observed in our previous studies (see Fig. 16 in Ref.DKRT2003 ) that the last desorption scanning curves (obtained by stopping the adsorption just before saturation and then decreasing the chemical potential) look very much like the desorption isotherms obtained in presence of a reservoir (when averaging the fluid density deep inside the aerogel, which gives a good estimate of the isotherm in the thermodynamic limit). Near the end of the adsorption process, the remaining gaseous domain is composed of isolated bubbles which obviously play the same role as an external reservoir when the chemical potential is decreased. The advantage of initiating the desorption with these last bubbles is that one can use the same geometry as during adsorption, with periodic boundary conditions in all directions (moreover, using small bubbles instead of a planar interface of size considerably suppresses finite-size effects).
In practice, the calculation has been performed by keeping five bubbles in each sample. This implies that the chemical potential at which desorption is initiated is slightly different in each sample (if one chooses the same in all samples, some of them may be already completely filled with liquid). This number of bubbles results from a compromise: on the one hand, keeping a single bubble may not be sufficient to trigger the desorption process (in some samples, the growth of the bubble is hindered by the neighboring gel particles and the desorption occurs at a much lower value of the chemical potential); on the other hand, keeping too many bubbles results in a too rapid growth of the gas domain. As can be seen in Fig. 2, the isotherm obtained with this procedure is indeed very close to the isotherm calculated in presence of an external reservoir.
The fluid-fluid and solid-fluid correlation functions computed at several points along the desorption branch are shown in Figs. 7 and 8.
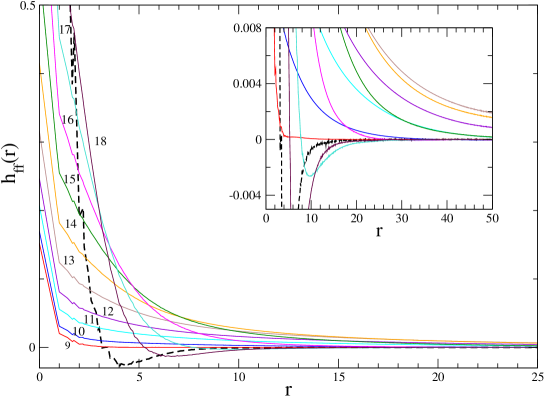
One can see that is dramatically changed with respect to adsorption: from saturation down to (curves to ), the function is monotonically decreasing, showing no minimum. Moreover, as shown in the inset of Fig. 7, a long-range tail is growing and may differ significantly from zero at note10 . Although it is difficult to characterize this decrease by a unique and well-defined correlation length (the curve cannot be fitted by a simple function such as an exponential), it is clear that the range of the correlations is small at the beginning of the desorption process, then increases considerably, goes through a maximum in the steeppest portion of the isotherm (corresponding approximately to point in Fig.2), and eventually decreases. As the hysteresis loop closes and the adsorbed phase consists again of a liquid film coating the areogel strands, a shallow minimum reappears in the curve, which is reminiscent of the underlying gel structure.
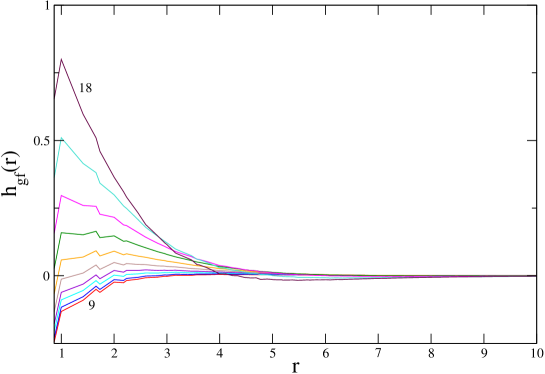
In contrast, the changes in the cross-correlation function between adsorption and desorption are very small (the function has only a slightly longer tail during desorption). It appears that the gel-fluid correlations depend essentially on the average fluid density: for a given value of , they are almost the same on the two branches of the hysteresis loop.
The calculation of the fluid-fluid structure factor is complicated by the fact that decreases very slowly to zero, and one cannot use anymore the continuation procedure that forces the sum-rule, Eq. 11, to be satisfied (the results for change considerably with , which shows that the resulting curve is not a good approximation of the infinite-size limit). Instead, we have only subtracted from its value at (setting in Eq. 12) so as to avoid the large but spurious oscillations in that result from the discontinuity at (there is still a discontinuity in the slope of at that induces small oscillations in some of the curves of Fig. 9). It is clear that finite-size effects are important in this case and the results for must be considered with caution.
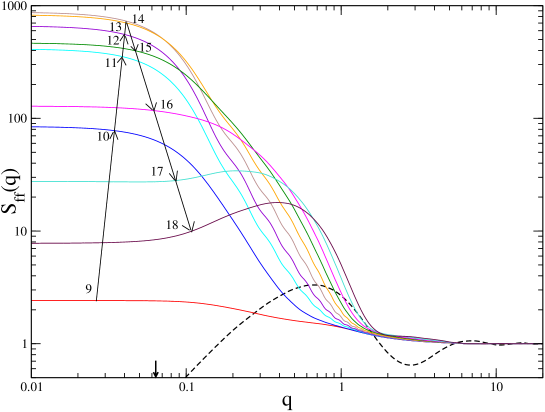
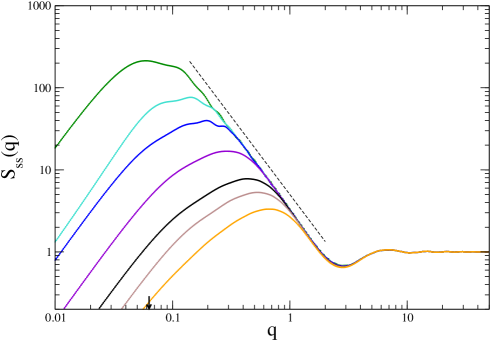
The resulting fluid-fluid structure factors along the desorption isotherm are shown in Fig. 9. (We do not present the curves for as they look very much like those in Fig. 6 with only a slightly broader peak.) As could be expected, the structure factors computed just before and after the knee in the isotherm (for ) are very different from those obtained during adsorption. Firstly, the peak that was associated to the minimum in has now disappeared and the small- intensity saturates to a value that is considerably larger than the maximum value obtained during adsorption (compare the vertical scales in Figs. 5 and 9). Secondly, as varies from to (curves to ), there is a linear portion in whose maximal extension is about one decade on a log-log scale. On the other hand, when is decreased further, the peak in is recovered and the curves become more similar to the ones computed on the adsorption branch.
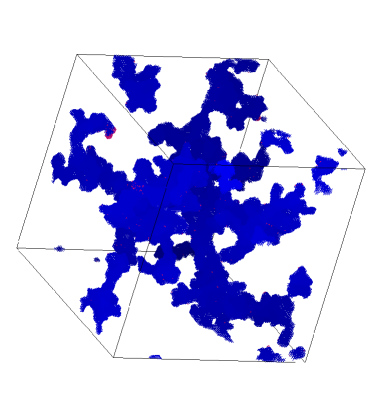
The linear regime in strongly suggests the presence of fractal correlationsnote3 . However, according to our previous studiesDKRT2004 , it is only the gaseous domain that should be a fractal object at the percolation threshold, as illustrated by the isotropic and strongly ramified structure shown in Fig. 10.
The correlation function , on the other hand, does not discriminate between a site representing a gaseous region ( at low temperature) and a site representing a gel particle (). In order to really show the existence of fractal correlations within the gas domain, one must consider either the ‘gas-gas’ correlation function (defining the quantity which is equal to only in the gas phase) or the complementary function that measures the correlations within the dense (solid or liquid) phase (one then defines ). The corresponding structure factor is the quantity that is measured experimentally when using the ‘contrast matching’ techniqueH2004 . It is related to and by
| (15) |
is shown in Fig. 11 for note11 , in the region of the knee in the desorption isotherm (point in Fig. 2). It clearly contains a linear portion over almost one decade and can be very well represented in this range of wavevectors by the fitFKS1986
| (16) |
with and , where is a crossover length that limits the fractal regime at large distances. Note that the linear portion itself has a slope (the above formula reproduces the right slope only when is very largeH1994 ). An accurate determination of would therefore require a much larger system and, at this stage, it is not possible to decide if the fractal dimension is consistent with that of random percolation. In any case, these results strongly suggest that the gas domain exhibits fractal correlations during desorption, correlations which have no relation with the underlying gel microstructure (we recall that there is almost no fractal regime in the aerogel, as can be seen in Fig. 1).

Raising the temperature to has a dramatic effect, as shown in Fig.12. The maximum value of has dropped by two orders of magnitude and there is no significant region with a fractal-like power-law behavior. Indeed, has no more a long-range tail and the correlations are very similar during adsorption and desorption, as could be expected from the very thin shape of hysteresis loop. This is the signature that the desorption mechanism has changed, in agreement with the analysis of Refs.DKRT2003 ; DKRT2004 . It is now due to a cavitation phenomenon in which gas bubbles first appear in the largest cavities of the gel and then grow and coalesce until the whole void space is invadednote13 .
We have not studied the correlations during desorption in the porosity gel. At very high temperature (), desorption is expected to be due again to cavitationDKRT2004 , and the results shoud be similar to those in the that have just been described. On the other hand, at low temperature (e.g. ), the theory predicts a depinning transition in which a self-affine interface sweeps through the whole sample, resulting in a discontinuous desorption isothermDKRT2004 . Therefore, like in the case of the macroscopic avalanche during adsorption, the correlations along the isotherm cannot be studied within the framework of a grand-canonical calculation. At intermediate temperatures, one could probably observe again extended fractal correlations associated to a percolating cluster of gas, but this study requires the use of larger systems so as to probe smaller values of and discriminate the effects due to the own fractal structure of the gel.
IV Scattered intensity and comparison with experiments
As mentionned in the introduction, there have been two recent scattering studies of gas condensation in aerogels, both with 4HeLMPMMC2000 ; LGPW2004 . In Ref.LGPW2004 , light scattering is used to study adsorption and desorption in a porosity gel at several temperatures between () and (). These experimental results cannot be directly compared to our theoretical predictions, and our system size is too small to investigate the large-scale inhomogeneities that are seen in the experiments (some of them are visible to the eye). However, there are two key observations that appear to be in agreement with our predictions: i) at the lowest temperature studied, the optical signal due to helium adsorption is larger than if the fluid density was simply correlated to the density of silica, indicating that the correlations within the fluid extend beyond the aerogel correlation length, and ii) the aerogel is much brighter during desorption, indicating that the characteristic size of the density fluctuations is much larger than during adsorption.
This latter conclusion was also reached from the small-angle x-ray scattering measurements (SAXS) performed in a porosity aerogel at ()LMPMMC2000 . SAXS is particularly well suited for observing the structural features associated to fluid adsorption, and in order to compare more easily to experiments we shall push further our calculations and compute the resulting scattered intensity. Of course, the predictions must be taken with a grain of salt, considering the limitations in the model and the theory. Since the scattered intensity is proportional to the Fourier transform of the electron density fluctuations, one has
| (17) |
where is the form factor of silica particles (see section IIIA) and is the ratio of the electron density in the adsorbed fluid to that in the solid. As an additional approximation, we shall take , restricting the study to the range where this is presumably a reasonable approximation (in real units this corresponds to nm-1, taking nm). Assuming that the adsorbed liquid has the same density as the bulk liquid at , and using the tabulated densities of helium and silica, one finds that varies from at to at .
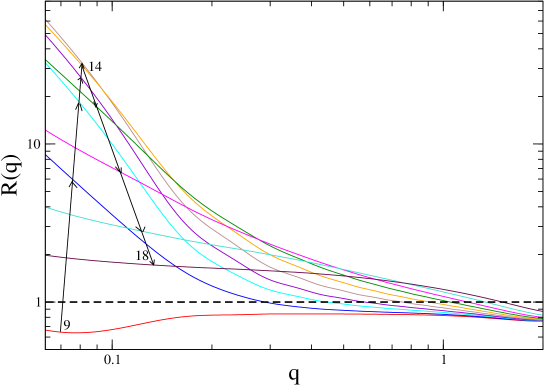
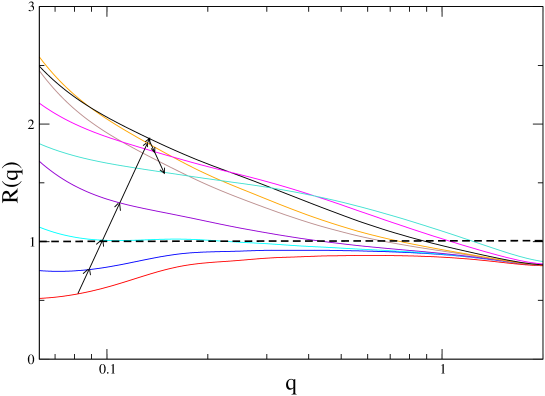
The theoretical scattered intensities during adsorption and desorption in the gel at are shown in Figs. 13 and 14. Like in the experimentsLMPMMC2000 , we plot the ratio where is the contribution of the empty aerogel (the first term in the right-hand side of Eq. 17) in order to accentuate the effects of the adsorbed gas, especially in the initial stage of adsorption. Moreover, we hope that this also partially corrects the small- defects due to the absence of large-scale fluctuations in the DLCA gel structure factor.
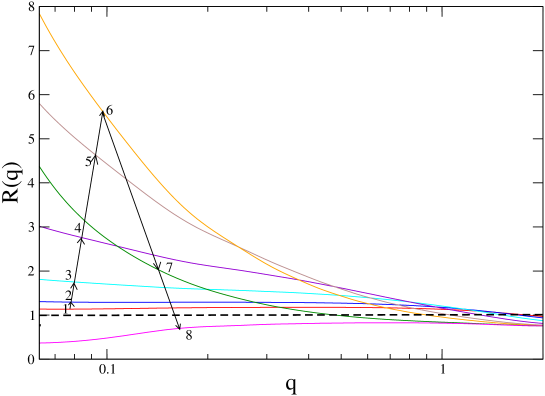
The main features of the curves displayed in Fig. 13 are the following: i) At the very beginning of adsorption, slightly increases but remains almost independent of . This is the signature of the 4He film coating the aerogel. In this regime, the main contribution to the scattered intensity comes from the gel-fluid correlations (the second term in the right-hand side of Eq. 17). ii) As increases, the scattering grows in intensity at small , reflecting the presence of the broad peak in that moves towards smaller wavevector with filling (see Fig. 5). iii) As the aerogel fills further, decreases until it becomes again almost flat at complete filling. The total intensity is then reduced with respect to that of the empty aerogel. Direct comparison with the experimental results of Ref.LMPMMC2000 is again problematic: the adsorption isotherm in the gel is indeed very steep at , suggesting that one may be in the regime of a macroscopic avalanche. However, the behavior of the experimental is remarkably similar to what have just been described (preliminary measurements in a aerogelM2005 also show the same trends). The results of Ref.LMPMMC2000 were interpreted according to a model of two-phase coexistence, with a ‘film’ phase in equilibrium with a filled ‘pore’ phase. This is at odds with the theoretical scenario discussed in Refs.DKRT2003 ; DKRT2004 ; DKRT2005 which emphasizes the nonequilibrium character of the transition. The present results seem to show that this approach can also elucidate (at least qualitatively) the behavior of the scattered intensity.
During desorption, the most characteristic feature of the curves shown in Fig. 14 is the very significant increase of the ratio at small with respect to adsorption (note the logarithmic scale on the vertical axis). This is related to the corresponding increase in shown in Fig. 9 and is clearly due to the presence of long-range correlations within the fluid. As the desorption proceeds, goes through a maximum and then decreases until it becomes flat again. Remarkably, no power-law fractal regime is visible in in the range as was the case with in Fig. 11. It is the small value of (due to the small electron density of He), and not the division by , which is responsible for this unfortunate disappearance ( becomes proportional to when , which is only the case in a contrast matching experiment). In the measurements of Ref.LMPMMC2000 , this increase of at small is not mentionned, but the analysis of the data shows that the charateristic size of the inhomogeneities is much larger than during adsorption, as already mentionned, and that it decreases rapidly in the last stage of desorption.
Not surprisingly, the theoretical scattered intensity in the aerogel is considerably smaller at high temperature, as illustrated in Fig. 15 for . The intensity ratio has been divided by about . We therefore conclude that the magnitude of the scattered intensity can indicate that the nature of the desorption process has changed. We leave to our colleague experimentalists the challenge of checking the presence of a fractal-regime during desorption, as was done in VycorLRHHI1994 ; PL1995 ; KKSMSK2000 and xerogelH2002 .
Acknowledgements.
We are grateful to N. Mulders for very useful discussions and communication of unpublished results. The Laboratoire de Physique Théorique de la Matière Condensée is the UMR 7600 of the CNRS.References
- (1) F. Detcheverry, E. Kierlik, M. L. Rosinberg, and G. Tarjus, Phys. Rev. E 68, 61504 (2003).
- (2) F. Detcheverry, E. Kierlik, M. L. Rosinberg, and G. Tarjus, Langmuir 20, 8006 (2004).
- (3) F. Detcheverry, E. Kierlik, M. L. Rosinberg, and G. Tarjus, arxiv cond-mat/0508267 (to appear in Phys. Rev. E).
- (4) S. J. Gregg and K. S. W. Sing, Adsorption, Surface Area, and Porosity, Academic Press, New York (1982).
- (5) M. H. W. Chan, Czech. J. Phys. S6, 2915 (1996).
- (6) D. J. Tulimieri, J. Yoon, and M. H. W. Chan, Phys. Rev. Lett. 82, 121 (1999).
- (7) For a recent review, see e.g. E. Hoinkis, Part. Part. Syst. Charact. 21, 80 (2004).
- (8) L. B. Lurio, M. Mulders, M. Paerkau, M. Lee, S. G. J. Mochrie, and M. H. W. Chan, J. Low Temp. Phys. 121, 591 (2000).
- (9) T. Lambert, C. Gabay, L. Puech, and P.E. Wolf, J. Low Temp. Phys. 134, 293 (2004); T. Lambert, Ph.D. thesis, Université Joseph Fourier, Grenoble I (2004).
- (10) J. C. Li, D. K. Ross, L. D. Howe, K. L. Stefanopoulos, J. P. A. Fairclough, R. Heenan, and K. Ibel, Phys. Rev. B 49, 5911 (1994).
- (11) J. H. Page, J. Liu, B. Abeles, E. Herbolzheimer, H. W. Deckman, and D. A. Weitz, Phys. Rev. E 52, 2763 (1995).
- (12) A. Ch. Mitropoulos, J. M. Haynes, R. M. Richardson, and N. K. Kanellopoulos, Phys. Rev. B 52, 10035 (1995); E. S. Kikkinides, M. E. Kainourgiadis, K. L. Stefanopoulos, A. Ch. Mitropoulos, A. K. Stubos, and N. K. Kanellopoulos, J. Chem. Phys. 112, 9881 (2000).
- (13) R. Salazar and L. D. Gelb, Mol. Phys. 102, 1015 (2004).
- (14) E. Hoinkis and B. Röhl-Kuhn, in Fundamental of Adsorption 7 (Eds. K. Kaneko, H. Kanoh, and Y. Hanzawa), IK international, Japan (2002).
- (15) P. Meakin, Phys. Rev. Lett. 51, 1119 (1983); M. Kolb, R. Botet, and R. Jullien, Phys. Rev. Lett. 51, 1123 (1983).
- (16) E. Kierlik, P. A. Monson, M. L. Rosinberg, L. Sarkisov, and G. Tarjus, Phys. Rev. Lett. 87, 055701 (2001); E. Kierlik, P. A. Monson, M. L. Rosinberg, and G. Tarjus, J. Phys.: Condens. Matter. 14, 9295 (2002); M.L. Rosinberg, E. Kierlik, and G. Tarjus, Europhys. Lett. 62, 377 (2003); F. Detcheverry, E. Kierlik, M. L. Rosinberg, and G. Tarjus, Adsorption 11, 115 (2005).
- (17) H. J. Woo, L. Sarkisov, and P. Monson, Langmuir 17, 7472 (2001); L. Sarkisov and P. Monson, Phys. Rev. E 65, 011202 (2001); H. J. Woo and P. Monson, Phys. Rev. E 67, 041207 (2003).
- (18) A. Hasmy, E. Anglaret, M. Foret, J. Pelous, and R. Jullien, Phys. Rev. B 50, 6006 (1994).
- (19) A. Meroni, D. Levesque, and J. J. Weis, J. Chem. Phys. 105, 1101 (1996).
- (20) J. A. Given and G. Stell, J. Chem. Phys. 97, 4573 (1992).
- (21) M. L. Rosinberg, G. Tarjus, and G. Stell, J. Chem. Phys. 100, 5172 (1994).
- (22) From Eq. (2) (with replaced by ), one obtains the equation where , and the sum runs over the nearest neighbors of site . This equation must be solved by iteration for every , a very demanding numerical task in general (see, e.g., in a different context, D. Lancaster, E. Marinari, and G. Parisi, J. Phys. A: Math. and Gen. 28, 3959 (1995)).
- (23) Note that this issue is not discussed in Ref.SG2004 .
- (24) Strictly speaking, this is only true at equilibrium, where Eq. 10 holds (see the equation just above in note2 ). In particular, the fluid isothermal compressibility given by RTS1994 is very small at low temperature. It would be worth checking by Monte Carlo simulations that is the most important contribution to along the sorption isotherms too. Note that in random-field-like systems these disorder-induced fluctuations are expected to be also predominant near criticality, with diverging more strongly than (see, e.g., E. Pitard, M. L. Rosinberg, G. Stell, and G. Tarjus, Phys. Rev. Lett. 74, 4361 (1995)).
- (25) On the other hand, a box of size has been used to simulate the aerogels with porosity .
- (26) G. Porod, Small Angle X-Ray Scattering, Academic Press, London (1982).
- (27) N. Olivi-Tran and R. Jullien, Phys. Rev. B 52, 258 (1995).
- (28) V. Krakoviack, E. Kierlik, M. L. Rosinberg, and G. Tarjus, J. Chem. Phys. 115, 11289 (2001).
- (29) According to Babinet principle, two ‘complementary’ objects have the same diffraction properties. When the gel is completely filled with a liquid whose density is approximately uniform and close to (which is the case at low temperature), Babinet principle (in real space) implies that and . This is not quite visible in Figs. 3(b) and 4(b) because of the drastic change in the vertical scales.
- (30) The size of a so-called ’void’ or ‘cavity’ in the lattice aerogel may be estimated from the radius of the largest sphere that can be inserted in the cavity without overlapping with a gel siteSG2004 (see also L. D. Gelb and K. E. Gubbins, Langmuir 15, 305 (1999)). Alternatively, one can compute an integer ‘distance’ associated to the length of the shortest path from an empty site to a gel siteDKRT2003 . The two procedures gives similar results. For a aerogel, the size of the largest cavity is which is comparable to the correlation length .
- (31) We recall that has been computed so as to satisfy Eq. 11, the correct limit of . Then is expected to represent more faithfully the structure factor of the infinite system. In fact, setting or in Eq. 12 only changes for and the differences are small, as illustrated by the dotted curve in Fig. 5. The same is true for .
- (32) One could imagine to study separately the samples in which the jump has not yet occured and those which are already in the high-density phase, and then to use a sort of ‘lever’ rule to compute the structural properties at intermediate densities. However, this would be an incorrect procedure: the two fluid configurations before and after the avalanche are not in equilibrium (they are both metastable and the grand-potential has decreased during the avalanche) and one cannot apply to this problem the standard methods of phase equilibria.
- (33) A. P. Y. Wong and M. H. W. Chan, Phys. Rev. Lett. 65, 2567 (1990).
- (34) K. Dahmen and J. P. Sethna, Phys. Rev. B 53, 14872 (1996); J. P. Sethna, K. Dahmen, and O. Perković in The Science of Hysteresis, edited by G. Bertotti and I. Mayergoyz, Elsevier (2004).
- (35) This important feature has not been observed in the study of Ref.SG2004 . This is perhaps due to the fact that the system size is too small: a cubic lattice of size is used, but since the gel particle radius is at least equal to lattice spacings, the ratio is smaller than in our simulations.
- (36) This can be understood by noting that Eq. 10 can be rewritten as where represents the deviation of from the average density in the sample. The term is of order but it may be not negligible in a finite system when the number of fluid particles fluctuates significantly from one sample to another. It may then dominate the long-range behavior of . This is precisely what happens in the steepest portion of the desorption isotherm where some samples are still filled with liquid whereas other ones are already significantly drained.
- (37) The structure factor shown in Fig.11 has been computed from the Fourier transform of the ‘dense-dense’ correlation function , using a fit of the form to extrapolate the function to . This procedure is used to avoid the small oscillations that come from and when is directly computed from Eq. 15.
- (38) T. Freltoft, J. K. Kjems, and S. K. Sinha, Phys. Rev. B 33, 269 (1986).
- (39) Accordingly, the outer surface of the material does not play a role anymoreDKRT2003 ; DKRT2004 and one can study the correlation functions along the desorption isotherm without introducing an explicit external reservoir or using the last remaining gas bubbles. One can also safely extrapolate towards since there are no long-range correlations.
- (40) N. Mulders, private communication