The Nernst effect in high- superconductors
Abstract
The observation of a large Nernst signal in an extended region above the critical temperature in hole-doped cuprates provides evidence that vortex excitations survive above . The results support the scenario that superfluidity vanishes because long-range phase coherence is destroyed by thermally-created vortices (in zero field), and that the pair condensate extends high into the pseudogap state in the underdoped (UD) regime. We present a series of measurements to high fields which provide strong evidence for this phase-disordering scenario. Measurements of in fields up to 45 T reveal that the vortex Nernst signal has a characteristic “tilted-hill” profile, which is qualitatively distinct from that of quasi-particles. The hill profile, which is observed above and below , underscores the continuity between the vortex-liquid state below and the Nernst region above . The upper critical field (depairing field) determined by the hill profile (in slightly UD to overdoped samples) displays an anomalously weak dependence, which is consistent with the phase-disordering scenario. We contrast the Nernst results and behavior in hole-doped and electron-doped cuprates. Contour plots of in the - plane clearly bring out the continuous extension of the low- vortex liquid state into the the high- Nernst region in hole-doped cuprates (but not in the electron-doped cuprate). The existence of an enhanced diamagnetic magnetization that survives to intense above is obtained from torque magnetometry. The observed scales accurately like above , confirming that the large Nernst signal is associated with local diamagnetic supercurrents that persist above . We emphasize implications of the new features in the phase diagram implied by the high-field results, and discuss several theories.
pacs:
74.40.+k,72.15.Jf,74.72.-h,74.25.FyI Introduction
In the quest to understand high- superconductivity in the cuprates, two related important issues are the nature of the pseudogap state, which appears at the temperature Timusk ; PALee ; Kivelson , and the nature of the superconducting transition at the critical temperature . Does the transition follow the familiar “gap-closing” BCS (Bardeen-Cooper-Schrieffer) scenario, or the phase-disordering scenario in which thermally generated vortices destroy long-range phase coherence Emery ? The former case would imply that the pseudogap state is inherently antagonistic to -wave superconductivity and competes with it. In the latter case, by contrast, the pair condensate, bereft of phase rigidity, extends high above into the pseudogap state. The two states are closely related, differing in a subtle way that is fundamental to the pairing mechanism.
The phase-disordering scenario, which lately has gained increased theoretical interest Emery ; PALee ; Kivelson ; Baskaran ; Dorsey ; Larkin ; Franz , is a three-dimensional (3D) version of the well-known two-dimensional (2D) Kosterlitz-Thouless (KT) transition KT ; Villain ; Beasley ; Doniach ; Halperin . There are many investigations of KT physics in 2D cuprates realized in ultra-thin films or superlattices KTcuprate . A notable result is the detection of kinetic inductance above at THz frequencies Corson .
In bulk cuprates, the Uemura plot Uemura provided early evidence that scales with the superfluid density inferred from muon spin relaxation (SR), consistent with the phase disordering scenario. Direct evidence for this scenario has been obtained from Nernst experiments on single crystals Xu . When a flow of vortices is induced in a superconductor, an electric field appears transverse to the flow direction because of the Josephson effect Kim . The Nernst experiment, which exploits an unusual symmetry of the vortex-current response, is capable of detecting vorticity with high sensitivity. A large Nernst signal extending from below to a broad interval above has been detected in many hole-doped cuprates. The results have been interpreted as evidence for vortices existing above and – by direct implication – the phase-disordering scenario Xu ; WangPRB ; WangPRL ; WangSci ; OngRio ; OngAnn . See also Refs. Capan ; Wen .
In defining an extended region above the “ dome” in which vorticity exists (which we call the “Nernst region”), the Nernst results are increasingly influencing the ongoing pseudogap debate PALee ; Kivelson ; Lee1 ; Tesanovic ; Weng ; Honerkamp ; Zhang ; Sachdev ; Balents ; Anderson05 . Nonetheless, acceptance of a vortex origin for above is by no means unanimous; several models interpreting the Nernst results strictly in terms of quasiparticles have appeared Kontani ; Hu2 ; Dora ; Levin ; Alexandrov04 . The difficulties may arise because the Nernst experiment is a relatively unfamiliar probe of superconductivity, with a checkered theoretical history Caroli ; Maki68 ; Hu1 ; Iddo . Moreover, the notion that vortex excitations exist high above in bulk samples goes against deeply entrenched ideas of the superconducting state derived from BCS superconductors. In this paper, we lay out in some detail the reasoning and evidence that have guided our thinking, with focus on recent measurements in intense fields.
The organization of the paper is as follows. Section II explains our notation and concepts relevant to the vortex-Nernst effect. Section III sketches the phase-disordering scenario and the role of singular phase fluctuations. In Secs. IV and V, we give an introductory overview of Nernst results on optimally-doped and underdoped cuprates, respectively. Section VI describes the characteristic hill profile of the vortex signal and the continuity of the vortex liquid phase across , while Sec. VII discusses the anomalous dependence of the depairing field . The phase diagram is discussed in Sec. VIII. Recent corroboration of this interpretation from magnetization is summarized in Sec. IX. Nernst results in the electron-doped cuprate are described in Sec. X. Theoretical issues are surveyed in Sec. XI. Finally, in Sec. XII we summarize the results and conclusions.
The standard acronyms are used to identify the cuprates: LSCO for , Bi 2201 for , Bi 2212 for , Bi 2223 for , YBCO for , and NCCO for . For brevity, qp, UD, OP and OV stand for quasi-particle, underdoped, optimally-doped and overdoped, respectively. Where necessary, we distinguish vortex and qp terms by the superscripts and , respectively.
II The vortex-Nernst experiment
The Nernst effect in a solid is the detection of an electric field (along , say) when a temperature gradient is applied in the presence of a magnetic field ( is antisymmetric in ). The Nernst signal, defined as per unit gradient, viz. , is generally much larger in ferromagnets and superconductors than in non-magnetic normal metals. Where is linear in (conventional metals), it is customary to define the Nernst coefficient with . Our focus here, however, is on the vortex-Nernst effect in type II superconductors, where is intrinsically strongly nonlinear in . Instead of , it is more useful for our purpose to discuss the Nernst signal .
We remark that, to produce in a ferromagnetic conductor a signal of the magnitude reported here (V/K), one would need a magnetization of to A/m WLee . This is very far from the case in cuprates, where = 5-50 A/m in the Nernst region. Hereafter, we focus on the vortex mechanism.
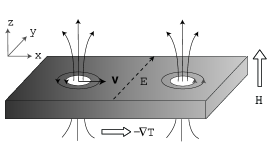
In the vortex-liquid state, a gradient drives the vortices to the cooler end of the sample because a normal vortex core has a finite amount of entropy relative to the zero-entropy condensate (Fig. 1) Kim ; Serin ; Huebener . Because of the 2 phase singularity at each vortex core, vortex motion induces phase slippage Anderson66 . By the Josephson equation , the time derivative of the phase produces an electrochemical potential difference . We have , where is the number of vortices crossing a line per second. The Josephson voltage may be expressed as a transverse electric field which is detected as the Nernst signal.
The peculiar symmetry here, in which a driving force along produces – as the leading response – a conjugate current along that is antisymmetric in , is specific to vortex currents. The Nernst effect is particularly suited to its observation. The sign of the Nernst signal is not intrinsically related to the sign of a charge (unlike the Hall effect). Fortunately, the Josephson equation, which dictates that , provides a sign convention for the Nernst experiment WangPRB . We regard the Nernst signal as positive if it is consistent with vortex flow.
Generally, because is difficult to calculate from a microscopic model, a phenomenological description is often used Kim ; Serin ; Huebener . The force exerted by the gradient on the vortex (per unit length) is where is called the “transport entropy” (per length). Balancing this against the frictional force in steady state, we have , where the damping viscosity may be inferred from the flux-flow resistivity with the superconducting flux quantum. The Nernst signal is then
| (1) |
We may extract by measuring and , but now all the difficulties attendant to reside in .
[In the vortex solid state (when is below the melting field ), the force due to the gradient is too feeble to cause vortex motion, and is rigorously zero. In low- type II superconductors, it is more practical to employ the Ettingshausen effect Kim , which is related to the Nernst effect by reciprocity. In the Ettingshausen experiment, a current density is applied with . Vortex motion transverse to produces a heat current which leads to a gradient detected as the Ettingshausen signal. The Ettingshausen coefficient is . The advantage of the Ettingshausen experiment is that a large may be used to depin the vortex lattice below Vidal ; Serin .]
In theoretical treatments, the vortex Nernst and Ettingshausen effects are conveniently handled together as the current response of the system to and Caroli ; Maki68 ; Hu1 ; Iddo . Imagine that we apply to a vortex system mutually orthogonal -field and temperature gradient in the plane normal to , and observe the response of the charge and heat current densities, and , respectively. As mentioned, the peculiar symmetry of vortex currents dictates that is to but , whereas is to but . (These are the large current responses; the flux-flow Hall effect and thermopower related to vortex diffusion produce much weaker currents which we neglect, along with qp contributions).
In linear response, and are given by Caroli ; Hu1
| (2) | |||||
| (3) |
with , . Here and is the thermal conductivity. The 2 off-diagonal Peltier terms are related by by Onsager reciprocity. Setting to zero, we find that
| (4) |
which is to be compared with Eq. 1. Similarly with = 0, the Ettingshausen coefficient is .
In Hartree-Fock approximation, Caroli and Maki Caroli ; Maki68 found that is proportional to the magnetization for close to and . Their coefficient of proportionality had an error which was later corrected Hu1 ; Iddo . Here we express this relationship as
| (5) |
with the parameter to be determined by experiment ( has dimensions of ).
The charge carriers also produce a Nernst signal which we refer to as the quasiparticle (qp) contribution. The current density produced by an applied gradient is given by the Peltier tensor , viz. . In terms of and the Hall resistivity , the qp Nernst signal is WangPRB
| (6) |
where is the qp resistivity and is related to the thermopower by .
The observed Nernst signal is the sum of the vortex and qp terms, viz.
| (7) |
with the caveat that in Eq. 6 for , the total (observed) , and are used instead of the strictly qp terms.
In the hole-doped cuprates, the qp term is very small for . For the purpose of determining the onset temperature of , however, the qp term has to be carefully resolved. This involves measuring the thermopower , Hall angle and resistivity in addition to . As this procedure has been described in detail in Ref. WangPRB , we will not repeat it here. In what follows, we will not usually distinguish between and , except when discussing NCCO in Sec. X.
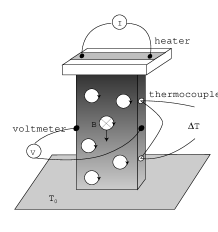
Figure 2 shows the setup in our Nernst experiment. The samples used are high-quality cuprate single crystals of typical size of mm3. One end of the crystal is glued with silver epoxy onto a sapphire substrate, which is heat-sunk to a copper cold finger. A thin-film 1-k heater, silver-epoxied to the top edge of the crystal, generates the heat current flowing in the plane of the crystal. The temperature difference (0.3-0.5 K) is measured by a pair of fine gauge Chromel-Alumel thermocouple. A pair of ohmic contacts are prepared on the edge of the sample by annealing different kinds of conductive materials.
After the bath temperature is stabilized (to within 10 mK), the gradient is turned on. The Nernst voltage is pre-amplified and measured by a nanovoltmeter as the magnetic field is slowly ramped up. The uncertainty in is 5 nV. To remove stray longitudinal signals due to mis-alignment of the contacts, the magnetic field is swept in both directions. Only the field-asymmetric part of the raw data is taken as the Nernst signal.
As expressed in Eq. 7, the Nernst signal is comprised of a large component associated with the pair condensate and a qp component from carriers. To date, the existence of in the Nernst region above has been confirmed in Bi 2212, Bi 2223, LSCO and YBCO, and (Bi 2201). The interesting case of electron-doped (NCCO) is deferred to Sec. X.
III Vortices and phase-disordering transition at
In this section, we sketch the phase-disordering scenario associated with the appearance of thermally created vortices, which has heavily informed the analyses of our Nernst-effect experiments. In the superconducting state, the pair condensate described by the macroscopic wave function exhibits long-range phase coherence. The phase spontaneously selects a particular value which is rigidly maintained throughout the volume Anderson58 ; Anderson66 . The energy cost of local variations in is given by , where the phase stiffness arises from the kinetic energy of the superfluid electrons, with the 2D density and the effective mass Halperin .
In the Kosterlitz-Thouless problem KT ; Villain ; Beasley ; Doniach ; Halperin – the prototypical example of the phase-disordering scenario – vortex-antivortex unbinding at the KT transition temperature destroys long-range phase coherence and superfluidity, even though the pair amplitude remains finite. Random jumps in caused by (anti) vortex motion drive the thermally averaged order parameter to zero, viz.
| (8) |
Generally, the phase-disordering transition is proportional to the superfluid stiffness, viz. Halperin ; Emery ; PALee
| (9) |
where in the KT problem, but can vary from 0.9 for the XY model to 1.5 in the limit of large vortex core energy.
From SR experiments, Uemura and collaborators Uemura found that, in UD cuprates, follows a universal, linear dependence on . Although originally discussed in terms of boson condensation at , the Uemura plot – if reinterpreted as confirming Eq. 9 – provided initial evidence for the phase-disordering scenario. Very early, Baskaran et al. Baskaran noted that proximity to the Mott insulator implies that in UD cuprates must be controlled by loss of phase coherence. The first detailed examination of this issue was provided by Emery and Kivelson Emery who found that the ratio falls in the range 1-2 in most hole-doped cuprates (compared with - in low- superconductors). This implies that phase fluctuations are of crucial importance in determining . Corson et al. Corson measured the complex conductivity in two thin-film samples of Bi 2212 with = 74 K and 33 K at THz frequencies and found that the kinetic inductance persists to 25 K above in both samples.
Fluctuations in are of two types: analytical spin-wave fluctuations and singular vortex-induced fluctuations Villain . The singular fluctuations are of specific interest here.
As rises bove , the density of spontaneous vortices (anti-vortices) () increases exponentially but the net vorticity stays at zero if . The applied increases (say) to produce a net induction field Doniach . A detailed calculation of the KT magnetization over a broad interval of was recently reported Oganesyan . Above , both and the vorticity remain observable despite the vanishing of .
In experimental studies of the KT transition in layered ferromagnets (e.g. ), the KT transition is pre-empted at by a 3D Curie transition because of a weak interlayer exchange (, the intralayer exchange) Hirakawa . Nevertheless, over a broad interval above , KT physics prevails. Analogously, in bulk cuprates, we expect the weak interlayer coupling to induce a 3D transition that pre-empts the KT transition. However, the KT description of vortex proliferation is valid over a broad interval above (the Nernst region).
Close to , the 3DXY model is the appropriate description for bulk crystals. Extensive numerical simulations by Nguyen and Sudbø Sudbo of the 3DXY model with moderate anisotropy clearly show that the helicity modulus ( where is the superfluid density) is destroyed at by the spontaneous appearance of vortex loops. Even with , the simulations show a 10 K interval above where vorticity exists. These results were tentatively compared with YBCO, but simulations in the limit are desirable.
In the Nernst experiment, the flow of vortices and anti-vortices down the gradient generates signals of opposite signs. Hence the observed picks up the difference in population , i.e. the vorticity.
In the BCS scenario, fluctuations of the order parameter are (predominantly) fluctuations of the amplitude (from zero). The Gaussian approximation, in which only terms in are retained in the action of the partition function , provides a good description of fluctuation diamagnetism measured in low- superconductors Gollub . However, if singular phase fluctuations are dominant in the destruction of superfluidity (as the evidence shows is appropriate in the Nernst region), the valid description is inherently non-Gaussian.
IV Optimally-doped cuprates
In the cuprates, early Nernst Ri ; Hagen ; Clayhold and Ettingshausen Batlogg experiments were restricted to OP, bilayer cuprates. The results were largely confined to the vortex-liquid state below , and analyzed to extract vortex parameters such as (Eq. 1). However, the existence of unusually large “fluctuation signals” extending 10-20 K above was noted in OP Bi 2212 and YBCO Batlogg ; Ri .
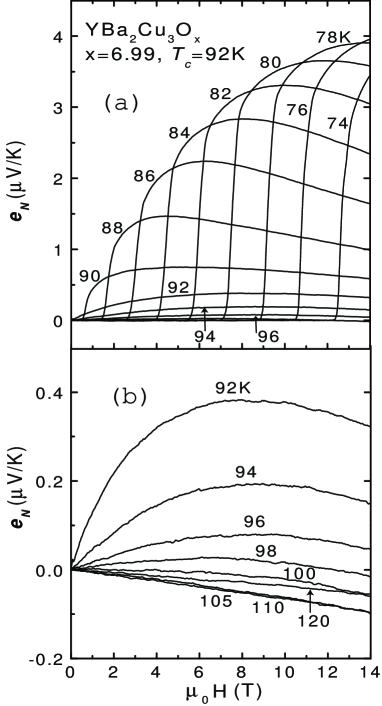
We start the description of our data from the OV/OP end of the doping window. Figure 3a displays the traces of versus at fixed , in a crystal of (YBCO), with = 6.99 and = 92.0 K (this sample is slightly OV). As the melting field is exceeded, the abrupt motion of a large number of vortices leads to a nearly vertical rise in (Panel a). The signal reaches a broad maximum and then decreases slowly. The envelope of all these curves represents the maximum value that attains in the temperature interval shown.
As rises above , the maximum values of decrease markedly and the profiles become broader (Panel b). However, an abrupt transition is not observed in the Nernst signal. Instead, it retains its nonlinearity up to 105 K. This is analogous to the Ettingshausen fluctuation signal reported in OP YBCO Batlogg . Above 110 K, the curve of is linear in with a slope that changes mildly with , which we identify with the qp contribution .
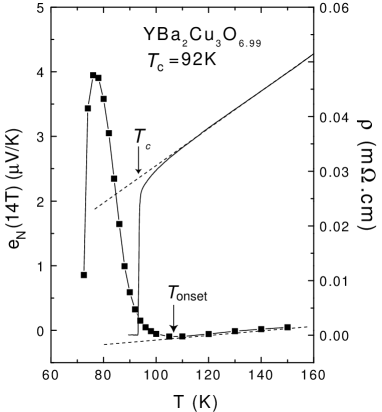
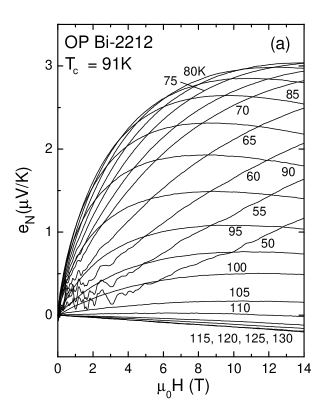
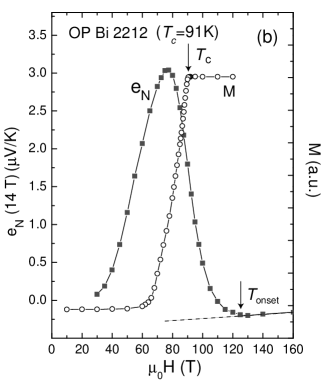
To show the fluctuation regime more clearly, we plot the dependence of measured at 14 T (Fig. 4) together with its zero-field resistivity . Clearly, deviates from the qp background at 107 K, or 15 K above = 92 K. Similar measurements on OP bilayer (Bi 2212, = 91 K) are shown in the Fig. 5a. Owing to its extreme anisotropy, the vortex-solid in Bi 2212 has a very small shear modulus . The melting field remains small even (50 K). We also remark that, near , displays a non-analytic dependence in weak . Above , rapidly becomes much smaller in amplitude. Figure 5b displays the dependence of measured at 14 T together with the Meissner signal measured at = 10 Oe in a SQUID magnetometer. The onset temperature of the vortex-Nernst signal is 125 K, or 30 K above . The broader Nernst region in Bi 2212 (compared to OP YBCO) reflects its extreme anisotropy.
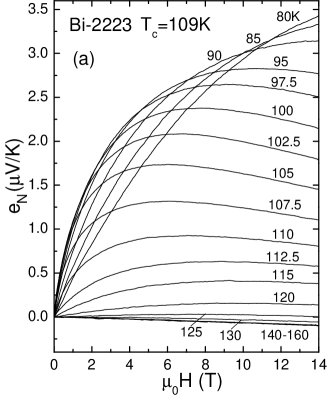
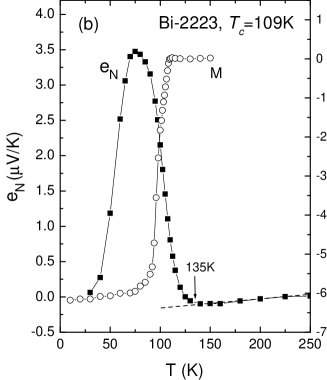
The trilayer cuprate (Bi-2223) also shows similar extension of the Nernst signal above its = 109 K (Fig. 6a). The overall behavior of vs. is strikingly similar to that of the bilayer system (Fig. 5a). The plots in Fig. 6b show that the Nernst onset temperature is around 135 K, 25 K above the .
The early results on OP cuprates in the “fluctuation” regime Ri ; Batlogg were deemed compatible with the prevailing expectation that, although flucutations are strongly enhanced in cuprates Huse , the data appeared to be adequately described by conventional Gaussian fluctuation theory Welp ; UllahDorsey .
V Underdoped cuprates
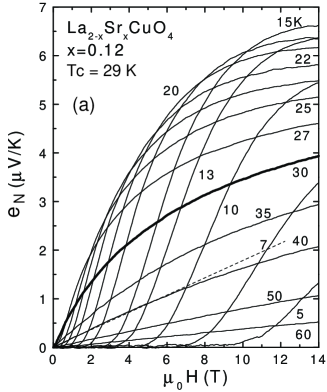
The Nernst signal above , already considerable in OP cuprates, becomes even larger in the UD regime. We first discuss (LSCO) Xu . Figure 7a displays the Nernst traces in an UD crystal with = 0.12 and = 28.9 K. The results seem quite similar to that in optimally-doped YBCO (Fig. 3). Below , the curves, which display the characteristic profile of a ‘tilted hill’ associated with vortex motion, are all enclosed within a smooth envelope curve. On closer examination, however, the data reveal an important difference. In OP YBCO, the maximum value of the – curve taken at = 92 K is 0.38 V/K, less than 10% the maximum value attained by the envelope curve ( 4 V/K) below . Above , rapidly falls to a negligible fraction of 4 V/K. By contrast, UD LSCO shows a different pattern of behavior. The bold curve in Fig. 7a is taken at = 30 K, slightly higher than . Its value at 14 T, 4 V/K, is more than 50 % of the maximum of the envelope, and still increasing with field. Even at 50 K, more than 20 K above , the signal is a sizable fraction of the maximum envelope value. Pronounced non-linearity in field is apparent in these curves. The Nernst signal decays quite slowly with temperature, becoming indistinguishable from the qp Nernst signal only above 100 K.
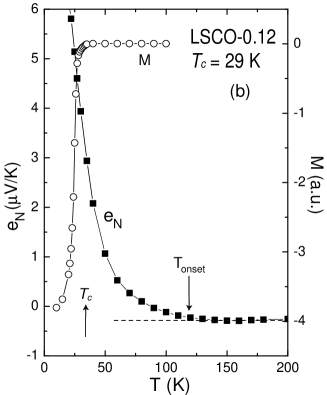
Figure 7b displays the dependence of taken at 14 tesla on underdoped LSCO, = 0.12, together with the magnetization curve measured at 10 Oe. The anomalous Nernst signal starts to deviate from the small qp background at 120 K. The dependence of measured at 14 T shows a long “fluctuation” tail that extends to .
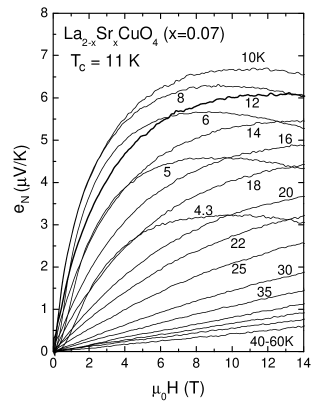
Moving to LSCO with smaller (0.07, = 11 K), we find that these anomalous features become enhanced (Fig. 8). The curve at 12 K – 1 K above – displays a Nernst signal that is similar in overall magnitude to any of the curves below . Indeed, curves taken at 20 K are comparable in magnitude with many of those below . Similar results have been obtained by Capan et al. Capan . Hence from the perspective of the Nernst effect, the boundary between the superconducting state and the normal state in UD cuprates is truly blurred. This poses a serious challenge to the conventional notion of ‘fluctuations’.
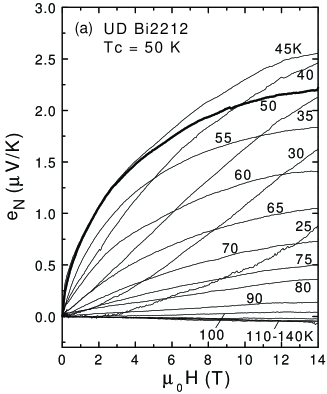
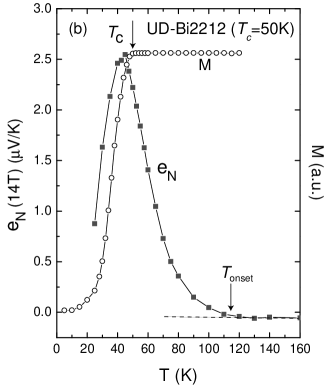
We next turn to the underdoped Bi 2212, which has been intensively studied by ARPES (angle-resolved photoemission spectroscopy) Ding ; Shen and STM (scanning tunneling microscopy) Seamus ; Yazdani because the crystals can be cleaved cleanly. Nernst results on this system are particularly valuable. In Fig. 9, we show Nernst results on a very underdoped Bi 2212 crystal with = 50 K and hole density 0.09. In close similarity with very underdoped LSCO ( = 0.07), the curve measured at (bold line) has a peak value close to the maximum of the envelope (Fig. 9a). Traces taken at higher than remain very large in magnitude and possess the strong curvature characteristic of the vortex-state. An important feature of Bi 2212, both UD and OP, is the very small magnitude of the qp Nernst signal (the “background”). This allows the onset temperature to be determined unambiguously. The dependence of in this UD sample indicates that = 115 K, or about 65 K above (Fig. 9 b).
VI The vortex-Nernst profile and continuity across
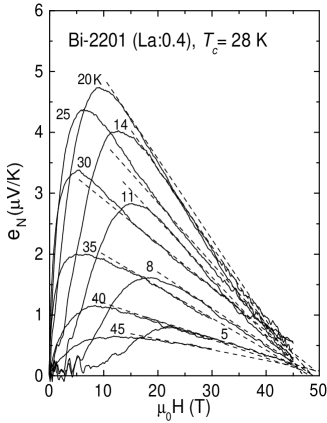
As described in Secs. IV and V, the vortex-Nernst signal versus displays a characteristic peaked form which we call a “tilted-hill” profile. This is quite apparent in electron-doped NCCO where the depairing field (10 T) is readily attained (Sec. X) WangSci . In hole-doped cuprates, however, is very large. The maximum field employed (14 T) in earlier experiments was barely enough to reach the peak of the profile. More recent measurements to fields of 45 T now provide a more complete view of the hill profile in Bi 2201 and LSCO. The similarity with the profile in NCCO is striking.
As discussed, rises steeply when exceeds . The vanishing of the shear modulus in the vortex solid allows the vortices to move down the gradient , to generate the Nernst signal as discussed in Sec. II. The steep rise in above is primarily driven by the increase in vortex velocity , but also reflects the increase in the vortex density . However, with increasing , the magnitude of the magnetization decreases monotonically as over a broad interval of field above the lower critical field . In high fields, decreases to zero at the upper critical field , as (see Sec. VII). From Eq. 5, should scale like in high fields Caroli , so that it should also approach zero as . Combining the weak field and high field trends, we may understand the tilted-hill profile. Just above , the steep increase of in the liquid state leads to a rapid increase in until encounters the ceiling set by a decreasing . In high fields, the dependence of follows that of since becomes nearly -independent once exceeds 2 (in LSCO and YBCO; in Bi 2201 and Bi 2212 the saturation in is much more gradual).
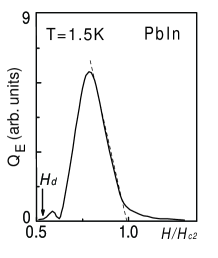
A similar hill profile is observed in the Ettingshausen signal in the superconductor PbIn (Fig. 10) Vidal . The signal rises steeply to a maximum when the vortex lattice is depinned. As approaches , the signal decreases to zero . The small “tail” above is due to amplitude fluctuations. As discussed in Sec. II, the Ettingshausen signal has the same dependence as .
By contrast, the qp signal is nominally linear in with a small correction observable only in high fields (20 T) at low (10 K). The short qp mean-free-path in hole-doped cuprates ( 80 Å at 80 K) precludes any possibility of observing a hill-type profile in even in fields 20-40 T.
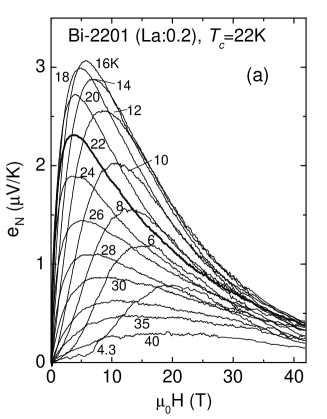
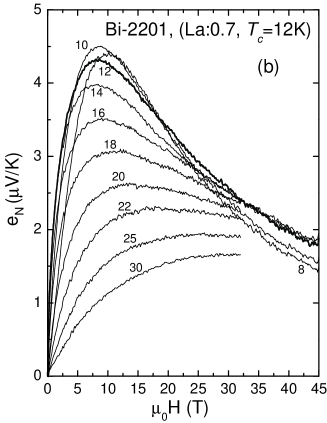
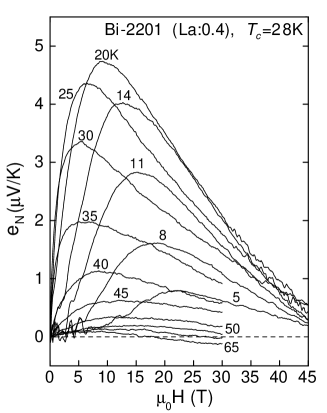
Figure 11 shows Nernst curves measured in OP Bi 2201 in up to 45 T. The curves taken below (28 K) all display the tilted-hill profile. As is increased above , rises steeply to a prominent maximum and then falls more slowly in high fields with a slope that is only weakly -dependent. Significantly, when we exceed , the curves retain the same hill profile (see curves at 30–45 K). In fact, the curves up to 65 K show the same nominal profile except that the maximum is quite broad. However, above 50 K, the negative qp term grows in significance and pulls towards negative values at large .
Similar results are also seen at other dopings. In Fig. 12a we show Nernst results on OV Bi 2201 ( = 0.2) with = 22 K. Even at = 40 K or , the curve retains the characteristic hill profile of the vortex signal. In underdoped Bi 2201 ( = 0.7) shown in Fig. 12b, the effect is even more dramatic. The curves of measured above (= 12 K) continue to show a vortex profile up to our highest temperature 30 K. The extension of the tilted-hill profile to high above implies that the same mechanism generating below – vortex flow – must be operating above .
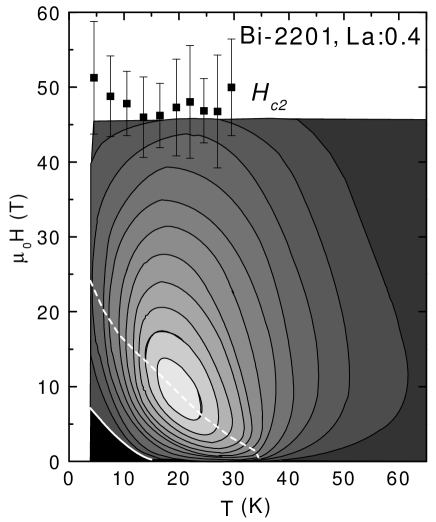
A graphic way to represent the continuity between the Nersnt region above and the vortex-liquid state below is the contour plot in the - plane WangPRL . In Fig. 13, the grey scale represents regions with successively higher values of in Bi 2201 ( = 0.4). The black area ( = 0) is the vortex solid phase below . If we increase at fixed (= 28 K), climbs rapidly just above and attains a maximum (lightest shade), before dropping gradually towards zero at (solid squares are values discussed in the next section). All the preceding figures displaying curves of vs. are vertical cuts in the - plane. The maxima in the - curves define the ridge-field (dashed curve in Fig. 13). As the pair condensate remains very large above , it clearly lies far below the depairing field . We discuss in relation to in Sec. VIII.
The contour plot provides a global view of the tilted-hill profiles shown in Fig. 11. The strong curvature of the contour lines at high implies that the hill profile is also observed above , as noted above. From the contour plot, it is clear that the vortex liquid state just above smoothly extends into the Nernst region above . There is no phase boundary discernible between the 2 regions; the vortex liquid state below spreads continuously to temperatures above . Overall, the magnitude of changes very smoothly over the whole - plane. The only indication of is the approach of the shallow contour minima towards 28 K as 0. We refer the reader to Ref. WangPRL ; OngRio ; OngAnn for contour plots of LSCO and YBCO. The contrasting contour plot in NCCO is discussed below (Sec. X).
VII The upper critical field
In the hole-doped cuprates, the upper critical field (or depairing field) is a rather poorly established quantity compared with the other parameters of the superconducting state. On the one hand, flux-flow resistivity experiments have given a very low estimate of Mackenzie ; Alexandrov96 ( is discussed at the end of this section). On the other, it was widely believed that in the cuprates is an inherently unmeasurable quantity.
A powerful advantage of the Nernst experiment is that it provides a direct determination of that remains sensitive in intense magnetic fields. In type II superconductors, as from below, the packing of vortex cores steadily reduces the volume fraction of the condensate in the interstitial “puddles” between cores. The coherence length is related to the upper critical field by . For fields just below , the supercurrent is deGennes
| (10) |
(with ). The (diamagnetic) circulation of the supercurrent around each of the interstitial condensate puddles generates a magnetization that is greatly reduced from its value near and given by Abrikosov’s expression
| (11) |
with and , where is the penetration length. Traditionally, the curve of vs. has provided the most reliable method for finding .
However, in the cuprates, where and 50-150 T, resolving the greatly suppressed in high fields has been a formidable challenge. Recently, though, rapid progress is being made using high-field torque magnetometry (some of the new vs. results are discussed in Sec. IX.)
The Nernst experiment provides an alternative way to measure . As stressed in Sec. VI, the curve of vs. has a characteristic peaked profile. On the high-field side, is driven inexorably to zero in proportion to the magnetization (Eq. 11). This is clearly seen in the Ettingshausen curve in the low- superconductor PbIn discussed in Sec. II (Fig. 10). The signal peaks near 0.8 and then decreases to zero as (ignoring the high-field tail caused by amplitude fluctutations). The high-field end-point of (or ) may be used to locate .
In most cuprates, the values of exceed the 45-Tesla maximum available in current magnets. In analogy with the low- case, we assume that linear extrapolation of the high-field Nernst signal to zero gives a reliable determination of the scale of . Adopting this assumption, we have broadly applied high-field Nernst experiments to estimate in several cuprate families.
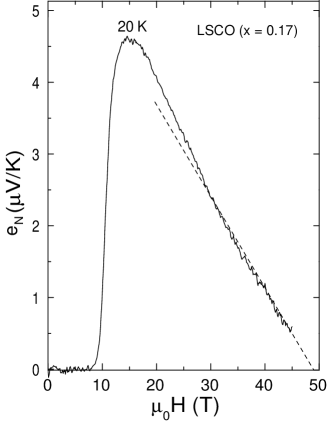
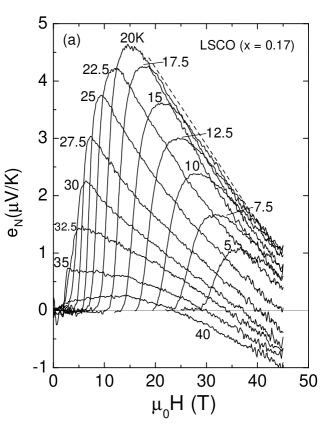
First, we consider optimally-doped LSCO (= 0.17, = 36 K). In Fig. 14, the extrapolation of at 20 K gives 50 T. Figure 15 displays vs. in this sample at selected . An interesting trend that is immediately apparent is that, in high fields, all the curves below 20 K merge to a common line (dashed line). With determined by linear extrapolation, we obtain the conclusion that is almost -independent from 5 K to 20 K. Unfortunately, in OP and OV LSCO, the qp negative background is moderately large above 20 K. As shown in Fig. 15, the -linear qp term added to the diminishing vortex term “pulls” the observed to negative values. This prevents from being readily estimated above 20 K in OP and OV LSCO. However, because is an entropy current, the qp term must decrease to zero as 0 (this is shown for UD LSCO in Ref. WangPRB ). Hence it doesn’t affect our estimate of at low .
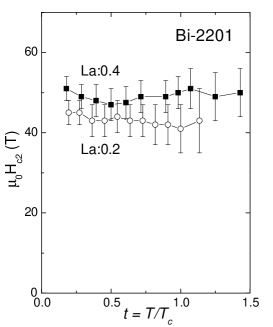
Determination of is most reliably carried out in single-layer Bi 2201 where the qp contribution is very small and values slightly more accessible. Figure 16 displays curves of in optimally-doped Bi 2201 ( = 0.4). We show the linear extrapolations as dashed lines. Again, we see that the curves all extrapolate to zero at nearly the same . This implies a -independent value of 48 4 T for temperatures from 5 to 45 K. We remark that, quite independent of the extrapolations, the convergent behavior of the measured curves already reveals this surprising result. This trend is also seen at other dopings. The Nernst traces in overdoped Bi 2201 ( = 0.2) also exhibit this convergence (Fig. 12).
Curves of vs. in optimally-doped and overdoped Bi 2201 are displayed in Fig. 17. Within the uncertainty of the data, the values in both samples are independent from 4 K to well above . This behavior is in sharp contrast with low- type-II superconductors where decreases linearly as near . The data show that the values continue nearly unchanged for a significant interval above .
This anomalous result is closely related to findings from ARPES Ding ; Harris that the gap amplitude in Bi 2212 is nearly independent below , and varies only weakly above . Tunneling experiments on Bi 2201 have also shown that the gap does not close at but remains finite above Renner . We may relate to the Pippard length by
| (12) |
where 1.5 for a -wave gap (compared with for -wave) and the Fermi velocity. Assuming that in our samples, we have . Hence the constancy of the gap amplitude across implies our finding that is constant across . In Ref. WangSci the doping dependence of infered from ARPES is shown to be quantitatively similar to that of obtained from the Nernst experiment. Finally, recent measurements of vs. to 33 T have confirmed this anomalous constancy of across in UD and OP Bi 2212 (Sec. IX).
As reported in Ref. Ding-PRL , the gap amplitudes in a slightly UD and an OV Bi 2212 are nominally -independent from low to well above . It is instructive to compare these curves with our inferred vs. plot in Fig. 17. Both experiments imply that, in the cuprates, is nearly unchanged from low to above .
As mentioned, the constancy of across is strikingly inconsistent with the mean-field BCS scenario in which vanishes at . By contrast, it supports strongly the scenario that the collapse of the Meissner state at is caused by the loss of long-range phase coherence, with remaining finite above . The loss of phase coherence arises from the spontaneous generation of vortices and the resultant rapid phase-slippage caused by their motion. The constancy of up to implies that it actually goes to zero only at a much higher temperature (the mean-field transition ). In the 2D KT transition, Doniach and Huberman Doniach have noted that (or the depairing field) must remain at a high value across the KT transition temperature . In summary, the anomalous behavior of in the hole-doped cuprates strongly supports our vortex interpretation of .
The doping dependence of was initially investigated from the slightly UD regime to the OV regime. In Ref. WangSci , it was found that decreases systematically from slightly UD to OP to OV samples in Bi 2212, Bi 2201 and LSCO. The trend agrees with that of measured by ARPES in Bi 2212 by Harris et al. Harris and Ding et al. Ding-PRL . Further, the values of inferred from vs. WangSci are consistent with obtained from and with the vortex core size observed by STM Pan-STM .
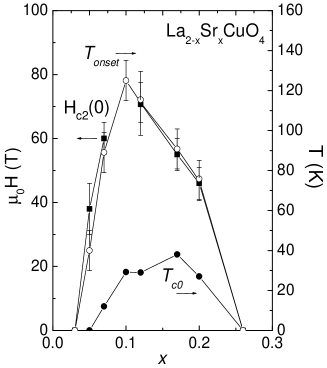
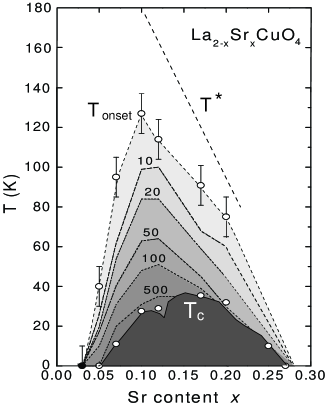
We have now extended these estimates over the whole doping range in LSCO, in 5 crystals with = 0.05, 0.07, 0.12, 0.17 and 0.20. The values of determined at our lowest (4.2 K) – which we identify as – are plotted as solid squares in Fig. 18. As shown, the dependence of is nominally similar to that of (open circles). As increases from 0.03, rises very steeply to peak near 0.10, and then decreases more gradually towards 0 as 0.26. (The values for 0.10 are in agreement with the estimates reported in Ref. WangSci , but the steep fall on the low- side was not investigated in that study.)
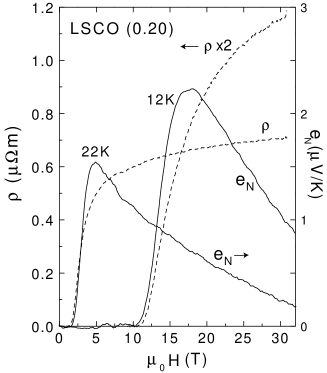
Resistivity In low- type-II superconductors, the flux-flow resistivity provided a convenient means to determine . If the applied current is high enough to depin the vortex lattice, increases linearly as to reach the normal-state value at (the Bardeen-Stephen Law Kim ). Conveniently, is often flagged by a sharp notch minimum in (the peak effect). The Bardeen Stephen law is rarely – if ever – observed in cuprates. Just above the melting field , rises very rapidly to saturate at a value close to that of the pre-transition suitably extrapolated below . Two examples of - profiles are shown in Fig. 19 in OV LSCO ( = 0.20). Previously, attempts were made to identify the “knee” feature corresponding to this saturation with “” Mackenzie ; Alexandrov96 . The inferred curve of vs. invariably displayed the wrong curvature, together with anomalously low depairing fields (0.01-0.1 T) near . They are strikingly incompatible with the values obtained from the Nernst results.
The field profiles of and at 22 K are compared in Fig. 19. As mentioned, the knee feature in occurs near 5 T. However, the vortex signal remains quite large above the knee, eventually decreasing to zero at the much higher 48 T. At 12 K, the knee feature in is much broader, but it occurs at 20 T, still considerably below 48 T. The comparison emphasizes the fallacy of identifying the saturation of with a depairing field scale. The condensate amplitude remains robust up to considerably higher fields. We argue that the knee feature instead reflects the shrinking with increasing field of the length scale over which phase stiffness holds. This loss occurs in the field interval between and the curve (dashed line in Fig. 13). In Bi-based cuprates this loss is quite gradual, whereas in OP/OV YBCO and LSCO it is abrupt (Figs. 3 and 14, respectively). Further, above , the dissipation climbs much more rapidly than prescribed by the Bardeen-Stephen law. This rapid increase implies a very weak damping viscosity and is known as the fast-vortex problem (Sec. XI).
VIII Phase diagram, onset temperature and magnitude
In the phase diagram of the cuprates, superconductivity occupies a dome-shaped region defined by the curve of vs. . The pseudogap temperature decreases monotonically from the scale 300-350 K to terminate at the end-point (the Nernst experiments along with many experiments indicate that 0.26, but other groups Tallon favor = 0.19). As reported previously WangPRB ; OngAnn , in the phase diagram of LSCO, the onset temperature of the Nernst signal falls between and . As increases from 0.03, rises steeply to a maximum value of 130 K at 0.10 and then falls more gradually to a value near zero at 0.27 (Fig. 20).
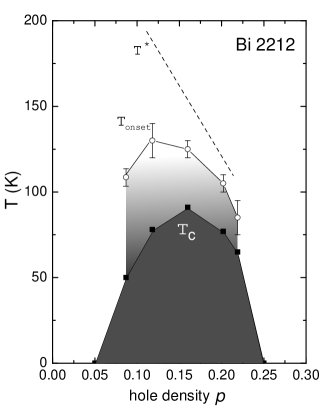
We turn next to in bilayer Bi 2212. In Fig. 21, we display the variation of in the 5 crystals investigated to date. The hole density is estimated from the empirical formula , with = 91 K oxygen . The curve of shares key features with that found in LSCO. As in LSCO, the superconducting dome in Bi 2212 is nested inside the curve of vs. which lies under the curve of . Whereas appears to continue to increase as falls below 0.10, deviates downwards in qualitative similarity with LSCO. The interval between and becomes systematically narrower towards the OV side, but it remains quite broad on the UD side. Interestingly, the maximum value of (130 K) is close to the maximum in LSCO, despite the large difference in maximum in the 2 families. The maximum value in YBCO is 130 K as well. However, in the Hg-based cuprates, evidence from torque magnetometry suggests that lies higher Naughton .
In the phase diagrams in Figs. 20 and 21, the nesting of the dome within the curve of underscores once more the continuity of the region in which the vortex-Nernst signal is observed with the region under the superconducting dome. The high-temperature associated with vortices is observed only inside the superconducting dome. Once we move outside (either on the UD or OV side), becomes very small. In LSCO with = 0.03 and 0.26, the tilted hill profile characteristic of vortex flow is completely absent. Instead, the observed is small and -linear to fields as high as 33 T, which is characteristic of the qp current.
On the UD side, the rapid vanishing of the vortex-Nernst signal for samples with = 0.03, 0.05 and 0.07 was already analyzed in detail in Ref. WangPRB . Because the vortex signal is rapidly decreasing relative to the qp signal, it is necessary to measure the Hall angle and thermopower to separate out the 2 contributions to the off-diagonal Peltier term WangPRB .
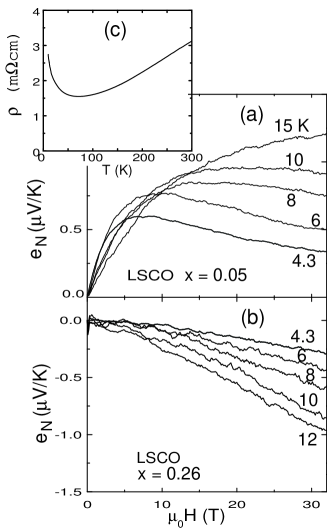
It is interesting to compare the Nernst signals at the two extremes of the dome. Figure 22 shows measured in UD LSCO ( = 0.05, Panel a) and in OV LSCO ( = 0.26, Panel b). In both samples, 2 K. As shown in Fig. 23, the Nernst signals in these two samples are about 10 times smaller than the largest signals observed in superconducting LSCO. However, these two samples exhibit strongly contrasting Nernst behaviors. In the UD sample, is strongly nonlinear in , displaying the “tilted-hill” profile characteristic of the vortex signal, whereas in the OV sample shows only the negative, -linear contribution from quasiparticles. In the UD sample, phase disordering caused by vortex motion destroys superconductivity (in = 0). However, the pair condensate is robust to intense fields (the Nernst curves show that is larger than 40 T). By contrast, in the OV sample, superconductivity above 2 K is absent because the pair condensate is absent altogether. Moreover, the resistivity profile in the UD sample shows an insulating trend below 80 K (Panel c), whereas the OV sample remains metallic down to 2 K. These differences reflect the presence of the pseudogap on the UD extreme of the dome, and its absence on the OV extreme.
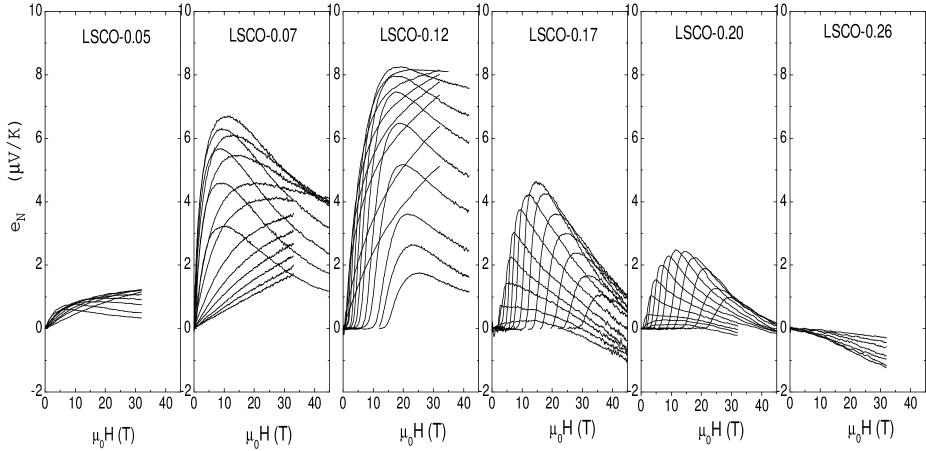
The doping dependence of the magnitude of the Nernst signal also reveals an interesting pattern that complements the previous point (that the vortex is confined to within the dome). Figure 23 displays the high-field Nernst results of 6 LSCO samples at various . The hole density and values of these samples are 0.05 (0 K), 0.07 (11 K), 0.12 (29 K), 0.17 (36 K), 0.20 (28 K) and 0.26 (0 K) respectively (the and scales are the same in all panels).
In each sample, the Nernst curves are nested within an envelope which has a peak value. In the doping range 0.20, the envelope peaks at , whearas in very UD samples ( = 0.05 and 0.07), it peaks above . As increases, the peak value rises to the value V/K near 0.12, and falls rapidly as reaches 0.26. The variation of the peak value with is summarized in Fig. 24, together with the curves of and in the same samples.
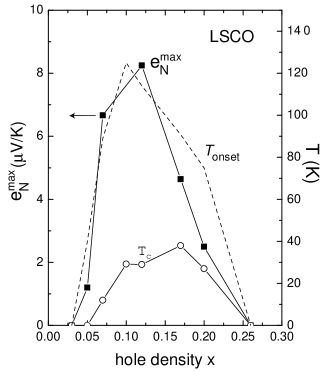
The plots in Figs. 23 and 24 show that the large Nernst signal observed in LSCO crystals are intimately related to the dome. When we go beyond the dome on either side, the peak value falls rapidly towards zero. Examination of the panels in Fig. 23 shows that, in each sample, also dictates the overall scale of the Nernst signal both above and below . Hence we deduce that large Nernst signal derives from the superconducting pairs. In the UD limit where a large pair density cannot be sustained, or in the OV limit when pairing is absent, the Nernst signal vanishes apart from the usual qp term. The tight correlation between the overall amplitude of the signal and the dome plays an important role in refuting theories that interpret the large Nernst signal as caused by quasiparticles in some exotic state that abuts the superconducting dome (we discuss this in Sec. XI).
IX Enhanced diamagnetism above
The evidence for vortices above described in the preceding sections would seem to be sufficiently compelling. However, for reasons already listed (Sec. III), it was desirable to seek evidence from non-transport experiments. In searching for other probes of phase fluctuations, we reasoned that, even if long-range phase coherence is destroyed by vortex motion, the large supercurrent circulating around the condensate puddles (see Eq. 10) should persist on length-scales slightly larger than the average vortex spacing . Hence, above , the magnetization must retain a weak diamagnetic term analogous to Eq. 11. This diamagnetism should be non-Gaussian and survive to 33 T and beyond, if it is to be related at all to . However, in prior reports of “fluctuation diamagnetism” in cuprates Bergemann ; Lascialfari found features that were anomalous and difficult to understand, but one report claimed Vidal2000 a good fit to conventional Gaussian theory. Naughton then drew our attention to his report Naughton of an unexplained diamagnetic signal in Hg 2212 that persists to 33 T and 200 K.
Because the diamagnetic component of is strictly in the phase-fluctuating regime above ( is confined within the layers), torque magnetometry with tilted slightly away from is ideally suited for resolving a very small from the background torque signal (the background arises from the anisotropic spin susceptibility ) Wang05 . In collaboration with Naughton, we have performed extensive measurements of above in several crystals of LSCO and Bi 2212 using a sensitive Si cantilever magnetometer Wang05 ; Lu05 .
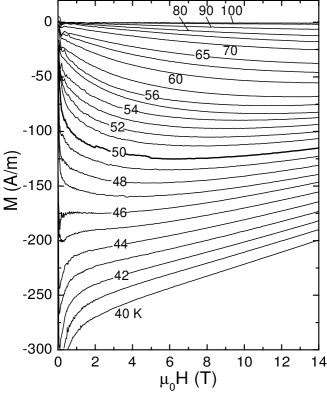
Here we briefly report results that are closely relevant to this paper (see Ref. Wang05 for details). Figure 25 displays vs. curves of an underdoped Bi 2212 ( = 50 K) obtained from torque magnetometry. The background term which is weakly -dependent has been subtracted. The diamagnetic signal starts to appear near 120 K and increases in magnitude over a broad 70-K interval above . At K (bold curve), the diamagnetic signal attains the value of -120 A/m. At even lower , the rapid growth of the Meissner effect becomes apparent at low field, and the - curves resemble those in low- type II superconductors. The Nernst curves measured on this crystal was shown in Fig. 9.
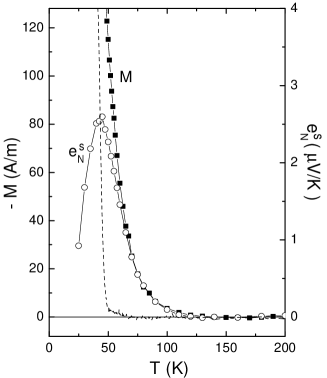
The magnetization measurements on underdoped Bi 2212 are remarkably consistent with the Nernst results. In Fig. 26, the temperature dependence of the vortex-Nernst signal and the diamagnetic signal measured at = 14 T are plotted together. Both deviate from the flat normal background at K, indicating the onset of strong fluctuations well above the defined by the sharp Meissner transition (dashed line). The 2 signals track each other closely over a broad interval of from 120 K down to 65 K below which attains a peak before sharply falling to zero (as the vortex-solid phase is approached). Scaling between and is also observed in OP and OV Bi 2212 Wang05 .
The scaling observed confirms that the vortex-Nernst effect is accompanied by a weak diamagnetic response within the CuO2 layers, which we identify with local supercurrents within the interstitial puddles between mobile vortices (Sec. VII). The scaling observed above suggests that the linear relation between and extends beyond the restricted regime of Eq. 5 found by Caroli and Maki, and may have rather broad generality. We also remark that even at such high , is robust in field, surviving to above 33 T Wang05 (the curves in Fig. 25 are displayed to 14 T). As noted in Ref. Wang05 , the robustness here distinguishes it from “fluctuation” diamagnetism arising from amplitude fluctuation familiar in low- superconductors Gollub . We emphasize the importance of the magnetization results in providing thermodynamic evidence that confirms the transport Nernst results, and refer the reader to Ref. Wang05 .
X Electron-doped cuprate
The electron-doped cuprate (NCCO) provides an interesting counter example to the hole-doped cuprates. Although NCCO shares the layered structure comprised of CuO2 planes, its phase diagram differs from that of the hole-doped cuprates. The 3D antiferromagnetic (AF) state extends up to 0.15 and the superconducting region is confined to a narrow doping range (0.15–0.17) abutting the AF state. A pseudogap phase has not been detected above (below a residual gap is detected if superconductivity is completely suppressed by a field; whether this is simply the AF gap is still an open question).
Figure 27 shows curves of versus in optimally-doped NCCO ( and = 24.5 K) between 5 and 30 K WangSci ; Greene2 . In this cuprate, the qp contribution to the Nernst signal is large. From early Hall-effect experiments ZZWang ; Greene as well as ARPES, it is known that both electron-like and hole-like bands contribute to the qp current. The presence of both bands leads to a change in sign of the normal-state Hall coefficient in OP crystals ZZWang ; Greene . As given in Eq. 6, the qp Nernst signal is the difference of two terms and WangPRB . For a 1-band system, cancellation between the 2 terms (dubbed WangPRB Sondheimer cancellation) greatly reduces . However, if both holes and electrons are present, this cancellation is suppressed and becomes enhanced. A clear example was recently demonstrated by Behnia’s group in NbSe2 NbSe2 .
A similar suppression of the cancellation exists in NCCO WangSci ; Greene2 . At 30 K, the qp Nernst coefficient 0.26 V/KT, which is 10 times larger than in that in OP and OV LSCO (and 50 times larger than in Bi 2201 and Bi 2212). The observed Nernst signal is the sum of the vortex and qp terms (Eq. 7). In sharp contrast with results in hole-doped cuprates, the qp term actually dominates the Nernst signal at 6 K, far below . Nevertheless, as evident in (Fig. 27a), the vortex term retains its characteristic tilted-hill profile which is easily distinguished from the monotonic qp term. By fitting the latter to the form , with as fit parameters at each (dashed curves), we have extracted , which are displayed in Fig. 27b.
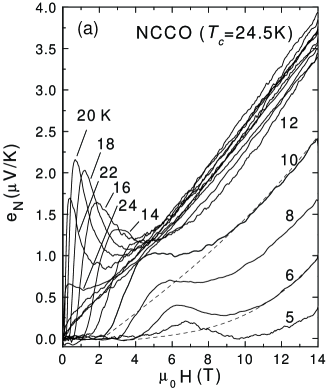
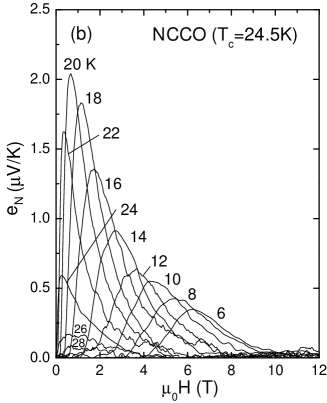
The field profiles of the vortex signal are remarkably similar to those in OP Bi 2201 except that the depairing field scale is much lower here ( 10 T compared with 50 T). The Nernst curves in Fig. 27b are also nested within an envelope curve that peaks sharply at 20 K.
However, there is an interesting difference above . As = 24.5 K from below, the individual hill profiles become narrower in field while the peak value decreases. The decrease in the peak value of is so rapid that at 28 K, the vortex contribution falls below our resolution. The convergence to zero at of the amplitude is similar to the behavior of observed in low- superconductors Huebener , but contrasts sharply with that in the UD hole-doped cuprates.
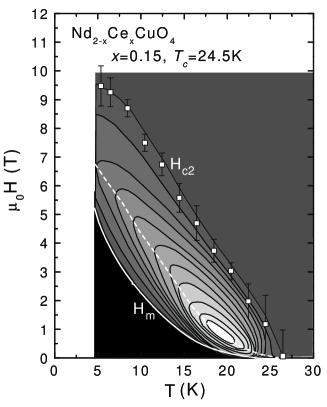
The narrowing of the hill profiles also implies that decreases rapidly with increasing . In Fig. 28 we plot as open squares determined as the field at which at each . We find that it goes to zero linearly as with the reduced temperature . Again, this is similar to in BCS theory. As discussed at length in Sec. VII, and remain at very large values in all hole-doped cuprates as we cross .
Figure 28 also shows the contours of the vortex signal in NCCO. The contrast with the contour plot of Bi 2201 (Fig. 13) is instructive. Instead of spreading outwards to temperatures high above , the regions of finite here are confined to the vortex-liquid state between and , with the long axes of the contour ellipses roughly parallel to . Above , cannot be resolved. We determined the melting field (solid white curve) as the line at which first becomes detectable. The vortex-liquid state occupies a large fraction of the phase below the curve. Aside from this unusual feature, the phase diagram of NCCO is similar to that in a conventional low- superconductor.
The Nernst results in NCCO are valuable in two aspects. The modest depairing scale (10 T) allows the full hill profile of to be easily distinguished even though it is riding atop a larger qp term. The juxtaposition shows unequivocally that there exist 2 very different contributions to the total Nernst signal of cuprates, each with its distinct profile. The close similarity of the profile of to that of in Bi 2201 provides evidence that our procedure for extracting in the latter is sound.
More significantly, the comparison reinforces the point that the persistence of and above in the hole-doped cuprates is closely tied to the pseudogap phenomenon. In NCCO where the pseudogap is absent (above ), the vortex Nernst signal is also absent. Moreover, the curve of terminates at . The comparison shows that the high-temperature Nernst phase is not generic to any highly anisotropic layered superconductor with a modest carrier density (the resistivity anisotropy in NCCO is comparable to that in LSCO and UD YBCO). It is inherently related to the physics of the pseudogap state in hole-doped cuprates.
XI Discussion
States above and below In the cuprate phase diagram, the Nernst region represents an extended area in which vorticity – hence charge pairing – survives above the curve of vs . In the hole-doped cuprates Bi 2201, Bi 2212, Bi 2223, LSCO and YBCO, the Nernst results establish that is primarily dictated by the loss of phase coherence due to spontaneous vortex-antivortex unbinding in = 0. In the Nernst region just above the curve, the phase is strongly disordered by rapidly diffusing vortices and antivortices, whereas closer to the curve of , fluctuations in the amplitude become equally important. It is important to note, however, that, in each cuprate family, the Nernst region does not extend all the way to the pseudogap temperature . As shown in Figs. 20 and 21, lies roughly between and for doping 0.10. In the very UD regime ( 0.1), falls steeply as , whereas seems to continue to increase. Our data show that the Nernst region is nested within the pseudogap region. [The data do not seem to support the recent proposal PALee that the curves of and actually cross near 0.19.]
This implies that, as we cool an UD sample from room temperature, the pseudogap state appears first at but is seen only in experiments that couple to the spin degrees. Cooling below produces the signals and , which result from the existence of vortices and a diamagnetic response, both distinct signatures of short-range supercurrents. It seems that, in order for the high- pseudogap state to coexist with SC (-wave superconductivity) over the broad interval , the two states must be intimately related, and be distinguished by a subtle difference. The Nernst region is where the system smoothly evolves or fluctuates between the two states.
Several interesting theories incorporating this subtle change have been proposed. According to Anderson Anderson05 , the uniform RVB (resonating valence bond) state is stable above , but the spin triad defined by and (the anomalous and normal self-energies, respectively) fluctuates strongly relative to the electron charge triad. At , the two triads lock to produce a vortex-liquid state that is, however, phase disordered (phase coherence occurs at ). In the SU(2) formulation of RVB PALee ; LeeWen , the quantization-axis vector of the slave-boson spinor distinguishes the staggered-flux pseudogap state () from SC (). Above , points mostly towards the poles, but in the Nernst region, fluctuates away from the poles, eventually coming to lie in the equatorial plane below . In the striped model, the competing state involves quasi-1D dynamic stripes Kivelson . Vortex excitations are also fundamental to other recent theories of the pseudogap/charge-ordered states above the dome Tesanovic ; Weng ; Zhang ; Sachdev ; Balents . We anticipate that detailed experiments on and in intense fields, in combination with STM experiments above , should allow these theories to be tested.
Cheap and fast vortices An important issue raised by these results is the energy cost of creating the vortices. In the limit in BCS theory, the energy of a vortex line of length arises chiefly from the superfluid kinetic energy and is given by deGennes . Here, it is important to add to this the core energy . The total energy of a vortex pancake is then PALee ; Honerkamp
| (13) |
As from below, the superfluid term in vanishes. However, does not in the phase-disordering scenario. In BCS theory, is the loss of condensation energy inside an area , viz. , in the clean limit PALee (with the Fermi energy). Hence, is at a very high energy scale relative to . Because the vortex unbinding temperature depends primarily on the stiffness term in in Eq. 13 and is insensitive to , this observation does not affect . However, a large ratio implies that the spontaneous vortex density should remain very small over a broad interval above which is inconsistent with magnetization and transport experiments. The inconsistency has been used PALee ; Lee1 ; Honerkamp to argue that the state stable inside the core is actually much closer in energy to SC than the true normal state (this is known as the cheap-vortex problem). Lee and coworkers propose that this is the sF state PALee ; Honerkamp .
As discussed in Sec. VIII, rises very steeply above to saturate near long before is reached. Ioffe and Millis Ioffe have investigated how proximity to the Mott insulator influences the coupling between quasiparticles and the supercurrent and dissipation inside the vortex core. They propose that a small damping results from the small number of states in the cores. The weak damping leads to a high velocity of the vortices transverse to , and a large flux-flow resistivity (or small vortex conductivity ). Additivity of the vortex and qp charge currents HarrisOng implies that, eventually, the observed conductivity is dominated by the qp term . This seems to account for the steep rise of followed by rapid saturation.
Gaussian limit As mentioned in Sec. III, phase fluctuations are classified as either analytical (spin-wave) or singular (vortex) . The Gaussian-fluctuation theory, based on an expansion in small of the action , leaves out the essential role of in destroying superfluidity. Ussishkin et al. Iddo have investigated the extent to which measured in LSCO may be described by Gaussian theory applied to a generic layered, extreme type-II superconductor. In the 2D limit, they calculate that, above , has the mean-field Aslamazov-Larkin (AL) form familiar from fluctuation diamagnetism, viz. , which provides a reasonable fit to in the OV regime (using the measured ). However, the Gaussian expression fits poorly in the OP and UD regimes even when unrealistically large values are used for the in-plane .
Because Gaussian theory does not handle singular phase fluctuations and the phase-disordering scenario, it cannot describe the anomalous behavior of described above. The poor fits in the OP and UD regimes are perhaps unsurprising. However, in a restricted range of temperatures just below the curve of in Fig. 20 where amplitude fluctuations must be dominant it serves as a useful quantitative guide Iddo2 . Numerical simulations of the 2D time-dependent Ginzburg Landau (TDGL) equation show reasonable fits to the high-field Nernst results in OV LSCO Subroto .
The separate issue of whether any generic quasi-2D superconductor should display a large Nernst signal above is interesting. The electron-doped NCCO, with an anisotropy and comparable to OP LSCO, and (60 Å) 2.5 times larger, should display an even larger Nernst signal above (according to the Gaussian theory). However, this is not the case (Sec. X). The presence or absence of the pseudogap state is a much more important discriminant in cuprates.
Quasi-particle models We discuss some of the proposed models in which above is attributed to quasiparticles. It has been argued Kontani that, if strong antiferromagnetic fluctuations exist in a Fermi liquid, vertex corrections cause the qp current to deviate from being normal to the Fermi Surface, and a consequent enhancement of . Also, an enhanced qp is purportedly obtained in an unconventional density-wave (DW) model Dora , as well as from paired holes in “anti-phase” domains in an antiferromagnetic state Hu2 .
These models introduce a rather exotic qp property or ground state tailored to account for the Nernst data in a restricted interval of , but ignore the (known) correlations of the data with other properties over a much larger parameter space. For e.g., it is difficult to see how the qp signal can smoothly evolve into the vortex signal below (Fig. 13). It is equally difficult to imagine how the unusual qp states/properties abruptly cease to be effective once we move out of the dome (Fig. 24). The extended high-field results reported here compound these problems. The vortex hill-profile which persists above (Fig. 11), the scaling of with (Fig. 26), the anomalous behavior of (Fig. 13), and the contrasting case of NCCO (Fig. 28) all present serious challenges for the qp models. (Further, a recent calculation Vadim2 has shown that the qp Nernst signal in the DW state is actually too small to account for the observed .)
Finally, in a proposed “bipolaron” model, even the Nernst signal observed below has been identified as coming from (“localized”) quasiparticles Alexandrov04 . The extreme view is proposed that represents the depairing field Alexandrov96 , so that the condensate is destroyed as soon as becomes non-zero. As we stressed in discussing in Sec. VII, loss of phase stiffness should be carefully distinguished from the destruction of the condensate. The ubiquitous “tilted-hill” profile observed below and the robustness of observed to intense fields Wang05 ; Lu05 provide simple, direct evidence refuting the basic assumption in this model.
XII Summary and conclusions
In the hole-doped cuprates, we uncover a large region above the “superconducting dome” in which an enhanced Nernst signal exists. The upper limit of the Nernst region is defined by which lies nominally half way between and the pseudogap scale (Sec. VIII). The Nernst signal is consistent in sign and magnitude with the phase-slip -field caused by a vortex current driven by the applied gradient (and incompatible with a ferromagnetic origin WLee by orders of magnitude). At each within this region, the Nernst signal is manifestly non-linear in and closely similar in shape to the tilted-peak profile that characterizes the vortex-Nernst signal observed below (Sec. VI). This profile is strikingly incompatible with a qp origin, given the very short qp . Overall, the enhanced Nernst signal above displays a smooth continuity with the vortex-liquid state below , which is best seen in the contour plot of in the - plane (Sec. VI).
An enhanced magnetization signal is observed above that scales accurately with measured in the same crystal (Sec. IX). The magnitude of is significantly larger than that anticipated from Gaussian fluctuations. Moreover, it remains robust to intense fields like even very near . With the magnetization result, the vortex liquid above has now been detected by both transport and thermodynamic experiments.
The direct implication of these results is that the loss of superfluidity and the collapse of the Meissner state at occurs because long-range phase coherence is destroyed by the thermal generation of vortices and anti-vortices, which implies that the pair amplitude persists to temperatures much higher than . This phase-disordering is the 3D analog of the KT transition in 2D systems.
For this scenario to be self-consistent, the depairing field must remain at a large finite value at – as previously noted for the KT transition Doniach – instead of decreasing to zero as . Utilizing the vortex profile for , we have determined that behaves anomalously, remaining large as is crossed, consistent with the vortex scenario (Sec. VII). This implies that, in the plane , the critical point (, 0) serves as the termination point of the melting-field curve , but not of the depairing field scale (Fig. 13). This contrasts with the phase diagram in NCCO (Fig. 28), in which (, 0) serves as the termination point of both and . The latter is the canonical behavior in the BCS gap-closing scenario. The extension of the vortex liquid to above , together with the anomalous behavior of constitute the most striking signatures of the phase-disordering scenario.
Acknowledgments
We thank Z. Xu, Yoichi Ando, S. Ono, S. Uchida, Genda Gu, Y. Tokura, Y. Onose, B. Keimer,
R. X. Liang, D. A. Bonn and W. N. Hardy for helpful collaborations in these experiments. We are especially indebted
to M. J. Naughton for drawing our attention to Ref. Naughton , and for the loan of
cantilever magnetometers. We thank P. W. Anderson, J. C. Davis, D. A. Huse, S. A. Kivelson, P. A. Lee, K. Levin, A. J.
Millis, V. N. Muthukumar, V. Oganesyan, J. Orenstein, S. Sachdev, S. Sondhi, Z. Tesanovic, I. Ussishkin, Z. Y. Weng, A.
Yazdani, and S. C. Zhang for many helpful discussions. The high-field measurements were performed at the National High Magnetic Field
Laboratory, Tallahassee, a facility supported by the U.S. National Science Foundation (NSF) and the State of
Florida. We are grateful to Scott Hannahs for technical assistance. This research is supported by
NSF (Grant DMR 0213706) and by the New Energy and Industrial Technol. Development Org. NEDO (Japan).
∗Present address of YYW: Department of Physics, University of California at Berkeley, Berkeley, CA
94720-7300.
Electronic addresses: yywang@berkeley.edu, luli@princeton.edu, npo@princeton.edu
References
- (1) For a review, see T. Timusk and B. Stratt, Rep. Prog. Phys. 62, 61 (1999).
- (2) For a review, see Patrick A. Lee, Naota Nagaosa, and Xiao-Gang Wen, Rev. Mod. Phys. in press, cond-mat/0410445.
- (3) For a review, see E. W. Carlson, V. J. Emery, S. A. Kivelson, D. Orgad, cond-mat/0206217.
- (4) V. J. Emery and S. A. Kivelson, Nature 374, 434 (1995).
- (5) G. Baskaran, Z. Zou and P. W. Anderson, Solid State Commun. 63, 973 (1987).
- (6) Hyok-Jon Kwon and Alan T. Dorsey, Phys. Rev. B 59, 6438 (1999).
- (7) V. B. Geshkenbein, L. B. Ioffe, and A. I. Larkin, Phys. Rev. B 55, 3173 (1997).
- (8) M. Franz, and A. J. Millis, Phys. Rev. B 58, 14572 (1998).
- (9) J. M. Kosterlitz and D. J. Thouless, J. Phys. C 6, 1181 (1973).
- (10) J. Villain, Jnl. de Phys. 36, 581 (1975).
- (11) M. R. Beasley, J. E. Mooij and T. P. Orlando, Phy. Rev. Lett. 42, 1165 (1979).
- (12) S. Doniach and B. A. Huberman, Phys. Rev. Lett. 42, 1169 (1979).
- (13) B. I. Halperin and David R. Nelson, Jnl. Low Temp. Phys. 36, 599 (1979).
- (14) Y. Matsuda et al., Phys. Rev. B 48, 10498 (1993); H. J. Jensen et al., Europhys. Lett. 20, 463 (1992); J.-M. Triscone, P. Fivat, M. Andersson, M. Decroux, and Ø. Fischer, Phys. Rev. B 50, 1229-1236 (1994).
- (15) J. Corson et al., Nature 398, 221 (1999).
- (16) Y. Uemura et al., Phys. Rev. Lett 62, 2317 (1989); Y. Uemura et al., Nature 364, 605 (1993).
- (17) Z. A. Xu et al., Nature 406, 486 (2000).
- (18) Y. B. Kim and M. J. Stephen, in Superconductivity, v. 2, ed. R. D. Parks (Dekker, NY, 1969), p. 1107.
- (19) Yayu Wang et al., Phys. Rev. B 64, 224519 (2001).
- (20) Yayu Wang et al., Phys. Rev. Lett. 88, 257003 (2002).
- (21) Yayu Wang et al., Science 299, 86 (2003).
- (22) N. P. Ong and Yayu Wang, Physica C 408, 11 (2004).
- (23) N. P. Ong, Yayu Wang, S. Ono, Yoichi Ando, and S. Uchida, Ann. Phys (Leipzig) 13, 9 (2004).
- (24) C. Capan et al., Phys. Rev. Lett. 88, 056601 (2002).
- (25) H. H. Wen et al., Europhys. Lett. 63, 583 (2003).
- (26) P. A. Lee, Physica C 388, 7 (2003).
- (27) O. Vafek and Z. Tesanovic, Phys. Rev. Lett. 91, 237001 (2003); Ashot Melikyan, Zlatko Tesanovic, Phys. Rev. B 71, 214511 (2005).
- (28) Z. Y. Weng and V. N. Muthukumar, Phys. Rev. B 66, 094509 (2002).
- (29) C. Honerkamp and P. A. Lee, Phys. Rev. Lett. 92, 177002 (2004).
- (30) H. D. Chen, O. Vafek, A. Yazdani and S. C. Zhang, Phys. Rev. Lett. 93, 187002 (2004).
- (31) S. Sachdev and E. Demler, Phys. Rev. B 69, 144504 (2004).
- (32) Leon Balents, Lorenz Bartosch, Anton Burkov, Subir Sachdev, and K. Sengupta Phys. Rev. B 71, 144508 (2005).
- (33) P. W. Anderson, Phys. Rev. Lett. in press, cond-mat/0504453.
- (34) H. Kontani, Phys. Rev. Lett. 89, 237003 (2002).
- (35) B. Dora et al., Phys. Rev. B 68, 241102(R) (2003).
- (36) S. Tan and K. Levin, Phys. Rev. B 69, 064510 (2004).
- (37) C. R. Hu, Int. Jnl. Mod. Phys. B 17, 18 (2003).
- (38) A. S. Alexandrov and V. N. Zavaritsky, Phys. Rev. Lett. 93, 217002 (2004).
- (39) C. Caroli and K. Maki, Phys. Rev. 164, 591 (1967).
- (40) K. Maki, Phys. Rev. Lett. 21, 1755 (1968); ibid., J. Low Temp. Phys. 1, 45 (1969).
- (41) Chia-Ren Hu, Phys. Rev. B 13, 4780 (1976).
- (42) I. Ussishkin, S. L. Sondhi, and D. A. Huse, Phys. Rev. Lett. 89, 287001 (2002).
- (43) Wei-Li Lee et al., Phys. Rev. Lett. 93, 226601 (2004).
- (44) F. A. Otter and P. R. Solomon, Phys. Rev. Lett. 16, 681, (1966); A. T. Fiory and B. Serin, Phys. Rev. Lett. 19, 227 (1967).
- (45) R. P. Huebener et al., Phys. Rev. 181, 701 (1969); ibid., 181, 710 (1969), ibid., 185, 66 (1969).
- (46) P. W. Anderson, Rev. Mod. Phys. 38, 298-310 (1966).
- (47) F. Vidal, Phys. Rev. B 8, 1982 (1973).
- (48) P. W. Anderson, Phys. Rev. 112, 1900 (1958); ibid. 130, 439 (1963).
- (49) V. Oganesyan, D. A. Huse and S. L. Sondhi, Phys. Rev. B in press, cond-mat/0502224.
- (50) K. Hirakawa and K. Ubukoshi, Jnl. Phys. Soc. Jpn. 50 1909 (1981).
- (51) A. K. Nguyen and A. Sudbø, Phys. Rev. B 60, 15307 (1999).
- (52) J. P. Gollub, M. R. Beasley, R. Callarotti, and M. Tinkham, Phys. Rev. B 7, 3039 (1973).
- (53) M. Zeh et al., Phys. Rev. Lett. 64, 3195 (1990); H. C. Ri et al., Phys. Rev. B 50, 3312 (1994).
- (54) S. J. Hagen, C. J. Lobb, R. L. Greene, M. G. Forrester and J. Talvacchio, Phys. Rev. B 42, 6777 (1990).
- (55) J. A. Clayhold, A. W. Linnen, Jr., F. Chen, and C. W. Chu, Phys. Rev. B 50, 4252 (1994); J. A. Clayhold, Phys. Rev. B 54, 6103 (1996).
- (56) T. T. M. Palstra, B. Batlogg, L. F. Schneemeyer, and J. V. Waszczak, Phys. Rev. Lett. 64, 3090 (1990).
- (57) D. S. Fisher, M. P. A. Fisher and D. A. Huse, Phys. Rev. B 43, 130 (1991).
- (58) U. Welp et al., Phys. Rev. Lett. 67, 3180 (1991).
- (59) Salman Ullah and Alan T. Dorsey, Phys. Rev. B 44, 262 (1991).
- (60) H. Ding et al., Nature 382, 51 (1996).
- (61) A. G. Loeser et al., Science 273, 325 (1996).
- (62) J. E. Hoffman et al., Science 297, 1148 (2002); ibid., 295, 466 (2002).
- (63) M. Vershinin et al., Science 303, 1995 (2004).
- (64) A. P. Mackenzie et al., Phys. Rev. Lett. 71, 1238 (1993); M.S. Osofsky et al., Phys. Rev. Lett. 71, 2315 (1993).
- (65) A. S. Alexandrov et al. , Phys. Rev. Lett. 76, 983 (1996).
- (66) Superconductivity of Metals and Alloys, P. G. de Gennes (Addison Wesley, 1989).
- (67) J. M. Harris et al., Phys. Rev. B 54, 15665 (1996).
- (68) H. Ding et al., Phys. Rev. Lett. 87, 227001 (2001).
- (69) Ch. Renner, B. Revaz, J.-Y. Genoud, K. Kadowaki, and Ø. Fischer, Phys. Rev. Lett. 80, 149 (1998).
- (70) S. H. Pan et al., Phys. Rev. Lett. 85, 1536 (2000).
- (71) J. L. Tallon and J. W. Loram, Physica C 349, 53 (2001).
- (72) Presland et al., Physica C 176, 95 (1991).
- (73) M. J. Naughton, Phys. Rev. B 61, 1605 (2000).
- (74) C. Bergemann et al., Phys. Rev. B 57, 14387 (1998).
- (75) A. Lascialfari, A. Rigamonti, L. Romano, A. A. Varlamov, and I. Zucca, Phys. Rev. B 68, 100505 (2003).
- (76) C. Carballeira, J. Mosqueira, R. Revcolevschi, and F. Vidal, Phys. Rev. Lett. 84, 3517 (2000).
- (77) Yayu Wang et al., cond-mat/0503190.
- (78) Lu Li et al., Europhys. Lett., in press, cond-mat/050761.
- (79) R. Bel, K. Behnia and H. Berger, Phys. Rev. Lett. 91, 066602 (2003).
- (80) H. Balci, C. P. Hill, M. M. Qazilbash, and R. L. Greene, Phys. Rev. B 68, 054520 (2003).
- (81) Z.Z. Wang, T.R. Chien, N.P. Ong, J.M. Tarascon and E. Wang, Phys. Rev. B 43, 3020 (1991).
- (82) P. Fournier et al., Phys. Rev. B 56, 14149 (1997).
- (83) V. Oganesyan and I. Ussishkin, Phys. Rev. B 70, 054503 (2004).
- (84) P. A. Lee and X.-G. Wen, Phys. Rev. B 63, 224517 (2001).
- (85) L. B. Ioffe and A. Millis, Phys. Rev. B 66, 094513 (2002).
- (86) J. M. Harris et al., Phys. Rev. B 51, 12053 (1995).
- (87) S. Mukerjee and D. A. Huse, Phys. Rev. B 70, 014506 (2004).
- (88) I. Ussishkin and S. L. Sondhi, cond-mat/0406347; I. Ussishkin, Phys. Rev. B 68, 024517 (2003).