Dynamical heterogeneities in an attraction driven colloidal glass
Abstract
The dynamical heterogeneities (DH) in non-ergodic states of an attractive colloidal glass are studied, as a function of the waiting time. Whereas the fluid states close to vitrification showed strong DH, the distribution of squared displacements of the glassy states studied here only present a tail of particles with increased mobility for the lower attraction strength at short waiting times. These particles are in the surface of the percolating cluster that comprises all of the particles, reminiscent of the fastest particles in the fluid. The quench deeper into the attractive glass is dynamically more homogeneous, in agreement with repulsive glasses (i.e. Lennard-Jones glass).
keywords:
PACS:
64.70.Pf , 82.70.Dd , 61.20.Lc, ,
1 Introduction
Two distinct glasses have been predicted and identified in hard spheres with short range attractions: a repulsion driven glass at high density, and an attraction driven one, formed at low temperatures (or high attraction strength) [1, 2]. Whereas the former one is caused by the steric hindrance of the particle cores and the so-called cage effect, the latter forms due to the bonding between particles. This system is realized experimentally by a colloid-polymer mixture, where the effect of the polymers is to induce an effective attraction between the colloids [3]. Both glasses have been indeed identified, although the attractive one, which at low concentrations is termed ‘gel’, often competes with (and inhibits) liquid-gas phase separation [4].
Dynamical heterogeneities (DH) have been found in the proximity of repulsion driven glass transitions by computer simulations, i.e. in Lennard-Jones mixtures [5, 6], or hard spheres [8]. In these cases, while the system is structurally liquid-like (homogeneous), a population of particles of increased mobility is observed. As the glass transition is approached from the fluid side, the heterogeneities become more pronounced, but decrease again deeper in the glass [7, 9, 10]. The role of these dynamical heterogeneities in the glass transition is as yet unclear; whereas mode coupling theory focusses on averaged quantities and neglects them [11], the so-called facilitated dynamics theories give DH the central role for their description of the glass transition [12].
In recent works, it has been shown that DH can be found also in attractive glasses, by studying the distribution of particle displacements in the system [13, 14, 15]. In fluid states close to the transition two populations of particles were found, separated by a minimum in the displacement distribution. A similar feature has been found also in repulsive glasses, which could imply a common origin [6, 15]. However, the low density of the attractive glass, as low as , causes structural heterogeneities as well; the system forms a percolating cluster of high density material, leaving voids with no particles. A correlation between structural and dynamical heterogeneities is thus possible, showing that ‘fast’ particles are in the surface of the cluster, whereas the ‘slow’ ones are mostly trapped in the inner parts of it [13].
In this work, we study the DH inside the non-ergodic region, for two different states, and compare them with those of the equilibrium systems. Only one population of particles can be identified from the distribution of particle displacements, and the distribution is narrower for the state with stronger attractions. Moreover, as the systems age, they become more and more homogeneous, from the point of view of the dynamics. Both results indicate that the strongest DH are obtained in the fluid side of the phase diagram, close to the glass transition. As a side remark, it must be noted that the structural heterogeneities mentioned above persist in the out-of-equilibrium systems, and thus are not the sole origin of the DH in attractive glasses.
2 Simulation details
We have performed computer simulations of a system composed of soft core () particles with attractive interactions given by the Asakura-Oosawa (AO) potential [3]. It models a mixture of colloids with non-adsorbing polymers, and the range of attraction is set by the polymer size. In order to guarantee full access to the whole parameter space, phase separations have been inhibited. Crystallization is avoided by polydispersity (flat distribution, width), and liquid-gas demixing by a repulsive barrier extending to two mean diameters. Further details of the interaction potential can be found in previous works [14].
Length is measured in units of the average radius, , and time in units of , where the thermal velocity, , was set to . Equations of motion were integrated using the velocity-Verlet algorithm, in the canonical ensemble (constant NTV), to mimic the colloidal dynamics, with a time step equal to . Every time steps, the velocity of the particles was re-scaled to assure constant temperature. The range of the attraction is set to . Density is reported as volume fraction, , with the number density, and the attraction strength is measured in units of the polymer volume fraction (at contact the AO attraction strength is ). The attractive glass transition for this system has been studied previously [14, 16]. An MCT analysis of the results (diffusion coefficient, time scale and viscosity) yields a transition point at for the colloid density .
For the study of aging here, the systems were equilibrated without attraction () at , and then instantaneously quenched to the desired at zero time, . Two attraction strengths have been studied, and , lying beyond the nonergodicity transition. In both cases, independent simulations have been performed, and the evolution of the system has been followed as a function of the time elapsed since the quench, called waiting time, . Correlation functions thus depend on two times: and .
3 Results and discussion
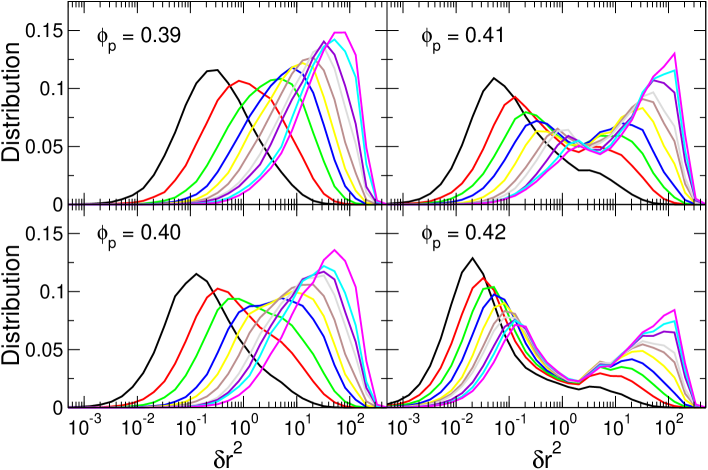
In fluid states close to the attractive glass, increasing DH have been found, the stronger the attraction [13]. Two populations of particles are observed to appear as the attraction is increased, one of mobile particles and another one of quasi-immobile particles (see Fig. 1) [14]. (The minimum in the distribution of squared displacements allows for an unambiguous identification of almost every particle.) These two populations are structurally well differentiated: the particles in the ‘skin’ of the gel, with a small number of bonds, are mobile, and the particles in the inner parts of the gel, the ‘skeleton’, are quasi-immobile. The populations were observed to be stable for long times, although particles can change from one to the other. It is thus an equilibrium feature of the system, partly induced by the structural heterogeneity.
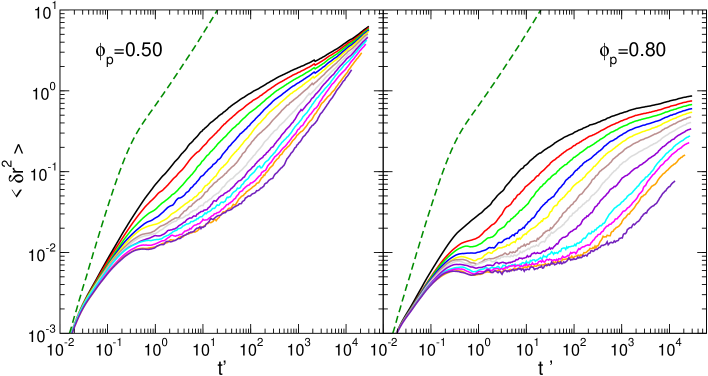
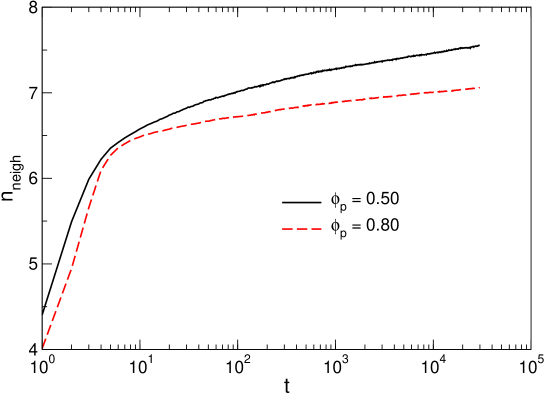
All of the states presented in Fig. 1 are, nevertheless, fluid states. The structural properties do not depend on time, nor the dynamical ones on the initial time, and the correlation functions averaged throughout the whole system decay to zero. By further increasing the attraction strength, however, the system falls out of equilibrium and shows aging. In Fig. 2, the mean squared displacement (MSD) is presented for the two quenches studied here, and ; different lines are the MSD for different waiting times, . As increases, bonds are formed between particles, as shown in Fig. 3 for both states, which hinders the motion of the particles, causing the dynamical arrest.
In the MSD, a plateau develops at short distances, signaling the localization length, clearer in the case of the higher , where the bonds are stronger and the cage (network of bonds) of the particles is tighter, as shown by the shorter localization length (implying higher non-ergodicity parameters in the density correlation function). The mean number of bonds per particle is, however, lower. Also, the aging is more dramatic and at long waiting times the MSD hardly reaches the range of the attraction, contrary to previous works where the plateau in MSD, or the density correlation function, was not observed [17]. Here we will concentrate on the DH, and a full analysis of the aging will be presented elsewhere [18].
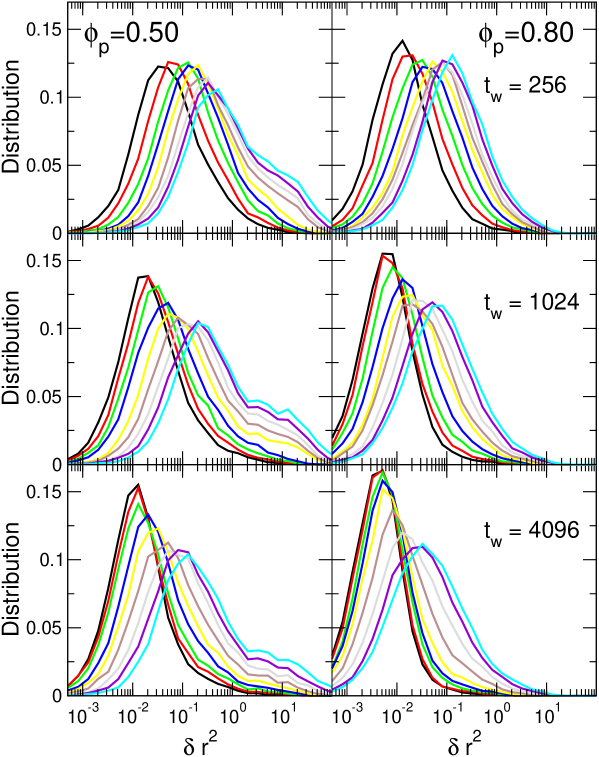

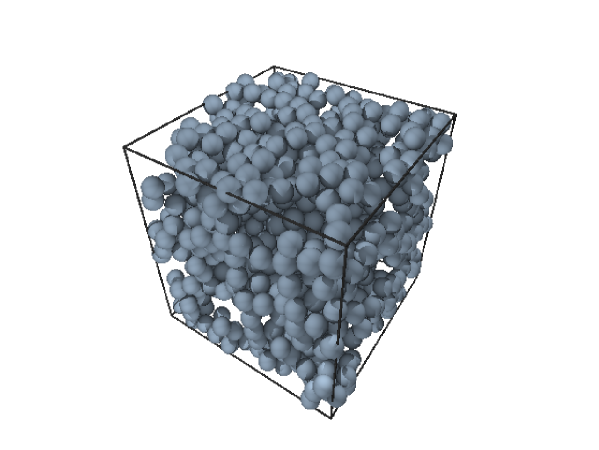
A snapshot of the system with is presented in Fig. 4. The system forms an intricate structure, with voids and tunnels, similar to the fluid states presented above. Therefore, the “skeleton and skin” picture presented above, with two different populations of particles, could still be applicable. In Fig. 5 we present the distribution of squared displacements at different times for both quenches. Strikingly, the distribution is monomodal in all cases, and the peak evolves to larger displacements as time proceeds. The strong DH observed in the fluid states, have, therefore, disappeared in the glass side. Moreover, the deeper quench, , shows narrower distributions at all waiting times than the quench at , indicating that the dynamics is more homogeneous the deeper the state is in the glass, in agreement with findings for Lennard-Jones (repulsive) glasses [10].
At , however, a tail in the distribution to long distances can be observed, caused by some particles that can travel long distances; the number of which decreases with . This feature is reminiscent of the population of fast particles observed in the fluid (Fig. 1). The origin of this population is studied in Fig. 6, where the squared displacement of every particle for a given time is correlated with the mean number of neighbours of the particle during this time. The plot shows that indeed the fastest particles in the system have less neighbours on average, whereas the particles with many neighbours, move very little. Therefore, the simple picture of “skeleton and skin”, can still be applied for the attractive glass close to the transition. The number of these fast particles is, nevertheless, decreasing with waiting time, as observed by comparing similar times for different waiting times in Fig. 5. Accordingly, the mean number of bonds per particle increases (see Fig. 3), implying a compaction in the system, and thus having fewer particles in the skin, and even those, more tightly trapped. However, we cannot state whether the population of fast particles will reach a steady state or if it will vanish eventually at very long waiting times. At , on the other hand, the tail of fast particles is absent in the distribution of squared displacements, although similar structural heterogeneities are observed.
4 Conclusions
We have shown that the strong DH found in fluid states close to the attractive glass transition in colloids with short range attractions decrease again deep into the non-ergodic region. The distribution of squared displacements is monomodal and no particles with increased mobility are observed (). However, close to the glass transition, in the glass side, aging is slower and some DH can still be detected: a tail in the distribution of squared displacements indicates fast particles, that can be identified with particles in the outer parts of the particle network. This feature is reminiscent of the population of fast particles found in the fluid states close to the transition. However, the stability of this population of fast particles in the glass cannot be established, but should not be present in a truly arrested glassy state. The results presented here agree with those of repulsive glasses, contrary to other comparions between attractive and repulsive glasses [17].
Acknowledgements
A.M.P. acknowledges financial support by the DGCYT (project MAT2003-03051-CO3-01). This work was funded in part (M.E.C.) by EPSRC GR/S10377. A.M.P. and M.F. were partially funded by AI-DAAD project no. HA2004-0022.
References
- [1] K.N. Pham, A.M. Puertas, J. Bergenholtz, S.U. Egelhaaf, A. Moussaid, P.N. Pusey, A.B. Schofield, M.E. Cates, M. Fuchs, W.C.K. Poon, Science, 296, 104 (2002).
- [2] F. Sciortino, Nature Materials, 1 145 (2002).
- [3] C. N. Likos, 2001 Phys. Rep. 348 267; S. Asakura and F. Oosawa, J. Chem. Phys. 22 1255 (1954).
- [4] K.N. Pham, S.U. Egelhaaf, P.N. Pusey. W.C.K. Poon, Phys. Rev. E 69 011503 (2004).
- [5] W. Kob, C. Donati, S.J. Plimpton, P.H. Poole, S.C. Glotzer; Phys. Rev. E 79 2827 (1997); C. Donati, S.C. Glotzer, P.H. Poole; Phys. Rev. Lett. 82 5064 (1999).
- [6] E. Flenner, G. Szamel, Phys. Rev. E 72 011205 (2005).
- [7] E.R. Weeks, J.C. Crocker, A.C. Levitt, A. Schofield, D.A. Weitz; Science 287, 627 (200).
- [8] B. Doliwa, A. Heuer, Phys. Rev. Lett 80 4915 (1998); Phys. Rev. E 61, 6898 (2000).
- [9] K. Vollmayr-Lee, W. Kob, K. Binder, A. Zippelius, J. Chem. Phys 116 5158 (2002)
- [10] K. Vollmayr-Lee, A. Zippelius, cond-matt/0507107.
- [11] W. Götze in Liquids, Freezing and Glass transition ed. J.P. Hansen, d. Levesque and J. Zinn-Justin, Amsterdam, North-Holland (1991).
- [12] L. Berthier, J.P. Garrahan, Phys. Rev. E 68 041201 (2003); J.P. Garrahan, D. Chandler, Phys. Rev. Lett. 89 035704 (2002).
- [13] A.M. Puertas, M. Fuchs, M.E. Cates, J. Chem. Phys. 121 2813 (2004)
- [14] A.M. Puertas, M. Fuchs, M.E. Cates, J. Phys. Chem. B 109 6666 (2005); Phys. Rev. E 67, 031406 (2003).
- [15] D.R. Reichman, E. Rabani, P.L. Geissler, J. Phys. Chem. B 109 14654 (2005).
- [16] A.M. Puertas, E. Zaccarelli, F. Sciortino, J. Phys.: Cond. Matt. 17 L271 (2005).
- [17] E. Zaccarelli, G. Foffi, F. Sciortino, and P. Tartaglia, Phys. Rev. Lett. 91 108301 (2003)
- [18] A.M. Puertas, M. Fuchs, M.E. Cates. In preparation