Structure of plastically compacting granular packings
Abstract
The developing structure in systems of compacting ductile grains were studied experimentally in two and three dimensions. In both dimensions, the peaks of the radial distribution function were reduced, broadened, and shifted compared with those observed in hard disk- and sphere systems. The geometrical three–grain configurations contributing to the second peak in the radial distribution function showed few but interesting differences between the initial and final stages of the two dimensional compaction. The evolution of the average coordination number as function of packing fraction is compared with other experimental and numerical results from the literature. We conclude that compaction history is important for the evolution of the structure of compacting granular systems.
pacs:
45.70.-n,61.43.-j,61.66.-f,62.20.-x,81.05.RmI Introduction
The structure of mono-disperse granular media is known to be very sensitive to the shape of the grains Donev et al. (2004), grain interactions such as cohesion Xu et al. (2004); Forsyth et al. (2001), and assembling procedure Vanel et al. (1999). Packing fractions as low as have been found experimentally in 3D-systems with high grain–grain attraction Bloomquist and Shutt (1940), whereas dense systems of spherical grains can be packed to Nowak et al. (1997) by a carefully selected tapping procedure.
Historically, the structure of dense granular media was studied during the 1960s and 70s as a model of fluids and amorphous materials Finney (1970); Bernal and Mason (1960). Since then, the complex properties of granular structures have been studied in dense elastic packings with much focus on compaction dynamics Knight et al. (1995); Ribiére et al. (2005); Richard et al. (2003); Nowak et al. (1997). The densification of granular packings has a variety of applications, and in particular, it takes place in Nature during the slow compaction of sediments Weller (1959) and the fast event of a landslide. Granular compaction is also commonly studied in relation to pharmaceutical powders and metal industry Fischmeister et al. (1974). In the compaction of sediments and powders, only the initial stages can be modeled by the compaction of hard elastic grain ensembles. When the geometrical structure is jammed Torquato et al. (2000) (i.e., no grain can be geometrically translated while all others remain fixed), at packing fractions , further compaction can only occur by grain deformation Weller (1959). For the compaction of sediments and the hot isostatic pressing of metal powders, grains deform plastically, thus deformed regions are relaxed during the compaction.
The development of a dense structure in a ductile granular ensemble will depend on grain properties such as friction and cohesion, as well as the deformation procedure. In such ductile packings, the densest possible structure will depend on how pore space can be reduced at high packing fractions. At such packing fractions, unless the granular ensemble is compacted in vacuum, gas or fluid occupying the pores must be transported out or absorbed into the matrix for further compaction to occur. An example of such a densification experiment is the experiment by Stephen Hales in the early 1700s Hales (1727), in which he filled a glass with dried peas and water. The peas absorbed water and eventually filled the container as an ensemble of polyhedra. Very little is known about the structure of plastically deforming grain ensembles, although they are extremely important for a range of industrially and naturally occurring compaction processes.
Here, we present a series of experiments on ensembles of compacting ductile grains in two and three dimensions. Positions and coordination numbers have been measured, and structural measures such as the radial distribution function and distribution of coordination numbers were obtained. In particular, we were able to study the local geometry that dominates the peaks in the radial distribution function, and the evolution of this geometry with packing fraction in two dimensions. The results are compared to similar findings from the literature of both hard and ductile experimental grain ensembles, and to a numerical compaction model (Rampage), developed to simulate the initial compaction of sediments Alberts (2005).
II The two-dimensional system
The two-dimensional (2D) system consisted of 1100 oriented cylinders, which were compacted at constant rate. From image analysis, the positions, coordination numbers, and packing fractions were found at regular intervals during the compaction.
II.1 Experiment
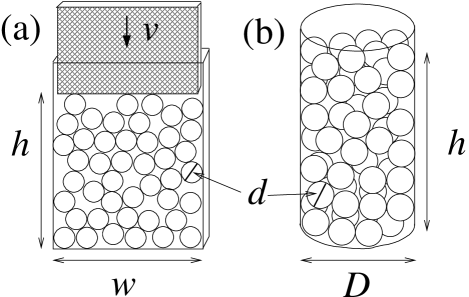
The 2D-setup consisted of ductile cylindrical grains, which were stacked in a Hele-Shaw cell, and uniaxially compressed by a piston at a constant rate mm/h. The grains were made of spaghetti, which had been boiled in water for 14.5 minutes in order to render them soft and deformable. The grains’ resistance to deformation could be controlled by the boiling time. After boiling, the spaghettis were kept in a clear olive oil to avoid dehydration, then cut into cylinders of length 10 mm, and carefully stacked in the container (Hele-Shaw cell). Two sizes of grains were used, but in different sections of the model. For simplicity, only the lower section of nearly 600 mono-disperse grains was used in this analysis. These grains had (initial) diameters of mm.
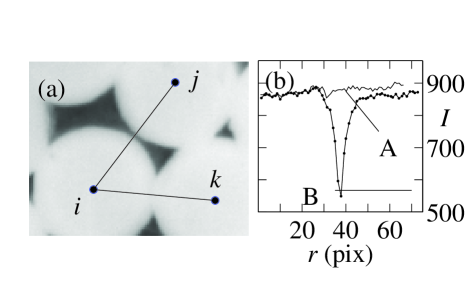
The width and height of the initial packing was mm and mm, corresponding to 29 and 33 grain diameters, respectively. The initial height of the 600 lower grains was 55 mm, or 20 grain diameters. During the stacking, olive oil was constantly added to the container so that the grains were immersed in oil at all times. The oil, apart from preventing dehydration of the grains, also lubricated the walls so that friction did not restrain the compaction. The depth of the Hele-Shaw cell was 11–12 mm, to ensure a channel at the back of the stacked grains for the oil to escape through. The oil thus did not affect the compaction mechanically. Figure 1(a) illustrates the setup of the 2D experiment, and Fig. 2 contains a closeup of a region in the first image.
Pictures were taken every 20 minutes, and a total of 47 pictures were taken as the system compacted at a speed of 1 mm/hour from an initial packing fraction of to the final . The camera was an AstroCam Capella, LSR Life Science Resources, UK, with 30002000 pixels, 14 bit resolution. The spatial resolution was 23 pixels per mm.
II.2 Analysis (2D)
The geometrical center position was obtained for all grains by image analysis. In the first image, i.e., the image taken immediately after compaction started, the center of mass was found by the following procedure: considering circles around a particular pixel, the radius of the circle that contained 5 pixels of intensity below a certain threshold was taken to be the shortest distance to the pore space from this particular pixel. The pixel within a grain with the largest distance to the pore space was taken to be the center position of the first image, see Fig. 2 for an illustration.
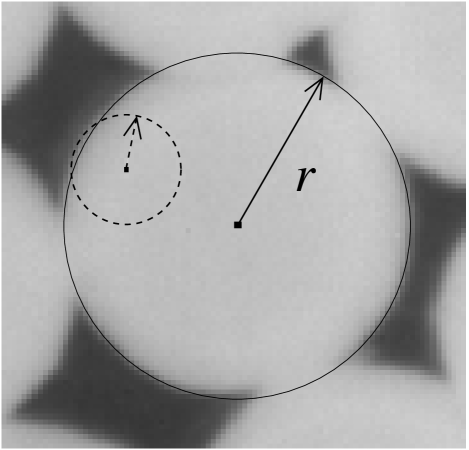
None of the disks were much deformed at this stage, so looking for pore space in circular sections accurately determined the center position to a resolution of a fraction of a pixel for most grains. However, due to reflected light from the Hele-Shaw cell, some positions were only determined within a few pixels resolution. The center of mass positions found in the first image were traced by pattern recognition (normalized cross correlation function Pratt (1991)) in all the following images, to a resolution of 1 pixel.
The grains were essentially incompressible. During compaction, the average crossectional area of each grain decreased 6%, thus the grains elongated in the direction perpendicular to the image plane. The development of the crossectional area was found manually for ten specific grains in the first and last image. Of these ten grains, two representative grains were selected, and their areas were found (also manually) in every second image throughout the experiment. A best fit was made to the developing average area, as , where is image number, square pixels, and . The effective grain diameter in each image was then found as .
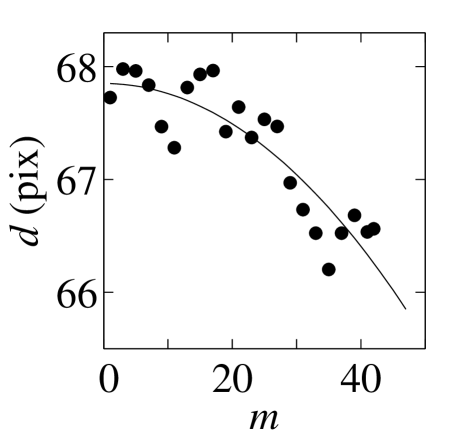
Figure 3 shows the grain diameter, calculated from the average area of each image, and the effective diameter (line) as functions of image number . By using the effective diameter in all the analysis, the decreasing crossectional area does not affect the geometry and structural evolution during the compaction. Thus, the packing fractions and radial distribution functions can be compared between images independent of the actual grain diameters.
II.2.1 Packing fractions
The packing fraction of the 2D system was obtained by Voronoi analysis of the position data from each image. Only disks at a distance of more than one grain diameter from any boundary were used in the calculation to avoid unbounded man (2005) Voronoi cells. The area of the Voronoi cell for each disk center was found, and as each such cell contains one disk, the local packing fraction was given by
| (1) |
where is the average diameter of a grain in the image in question. The Voronoi tessellation of a region around a certain grain is shown for the first and last (dashed) image in Fig. 4(a), with grain centers marked as bullets (first image) and circles (last image). The motion relative to the central grain is indicated by lines between the grain center positions in the first and last image. Figure 4(b) shows the cumulative distribution of distances between touching grains for the first (curve A) and last (curve B) images.
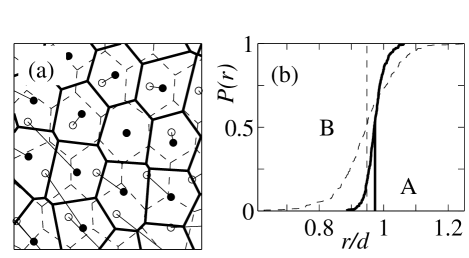
The overall packing fraction based on the Voronoi cell division was . The 2D compaction spanned packing fractions from to .
II.2.2 Radial distribution function
The radial distribution function (RDF) is defined by , where is the average number density of grain centers in a container of area , and is the average number density as a function of distance from a grain center. The expression for the number density as measured from grain number is
| (2) | |||
| (3) |
Here, is the circumference of a circle of radius , and is the number of grain centers at distance from grain . is the distance between grains and , and is the Kronecker delta, for , and otherwise zero. The average over grains gives
| (4) |
thus
| (5) |
where is summed over all grain centers of the sample. In a finite system the expression for should be replaced by
| (6) |
where is the width of the shell, its size depending on the number of grains in the system and/or the uncertainty of the position measurements. Perturbations to should not affect when the proper value of is chosen, as the dependence of and on should cancel in the expression of . The expression for the circular shell becomes .
Noting that the sum in Eq. (6) over equals twice the number of distances of lengths in the ensemble, , the expression for the RDF of a finite packing becomes
| (7) |
where is a finite size correction for the boundaries, as discussed below.
When Eq. (7) is used without the normalization , the boundaries of the ensembles introduce finite size effects to the RDF of a small system. These finite size effects result not only because the structure along the boundaries differ from the interior structure, but because the normalization over circular shells of areas includes regions outside of the ensemble. To avoid the latter source of errors, the normalization function is introduced based on the specific rectangular geometry of the ensemble. is found as follows: In an infinite system, a grain in a position would be surrounded by a circular shell independent of its position. In the finite system of a container, whether all of the circular shell lies within the container depends on the radius and the grain’s position . The fraction of circular shells of radius that partly lie outside of the container increases with and is a measure of the error done by disregarding the boundaries. Let the area of the container be . The integral over of all circular shell circumferences with center positions inside the area of the container is . Only a part of this integral represents circumferences that lie inside the container, thus in normalizing the RDF of a finite system one should use this fraction instead of the . A normalization function can be defined as the ratio of the integrals of circumferences in the infinite case to the finite case:
| (8) |
is the fraction of the circular shell of radius centered at that lies inside the container. For a rectangular container of width and height the normalization function is:
| (9) |
This correction procedure was previously used by Mason Mason (1968) for a different geometry (3D spherical ensemble).
II.2.3 Coordination numbers
The coordination numbers (number of contacts per grain) were found from further image analysis; a Delaunay triangulation based on the position data was used to obtain the set of nearest neighbors of each grain. Each Delaunay neighbor connection was then investigated by a thresholding procedure to establish whether it was a touching neighbor: The intensity values of the array of pixels that formed the shortest path between grain centers and showed a distinct dip whenever pore space was present between the grains. Grains were considered not touching if the dip was below 2/3 of the intensity value of the grain face intensity. Figure 5 illustrates this procedure. Grains and , as seen in Fig. 5(a), are not touching as the minimum value of their center-to-center intensity plot is below , as seen in (b). The intensity values was in the range , where represented black. The typical difference in intensity values between open pore space and the internal of a grain was . The coordination number distribution was found with this procedure for all the images.
II.3 Results (2D)
The radial distribution functions for the first and last stages of the experiment are shown in Fig. 6. The structure at shows many of the characteristic peaks of a triangular packing of disks, except that the peaks are broadened and shifted to shorter distances than those of a crystalline packing. Crystalline correlations occurring in triangular lattices of hard disks at are shifted to . In the RDF of the more compacted system of the peak near has vanished, and the double peak near has become smoother and broader. Also the first peak () is seen to broaden considerably as many neighbor distances at this stage are less than one effective grain diameter. The inset of Fig. 6 shows the finite size correction function for the first image, which is practically identical to the correction in the last image.
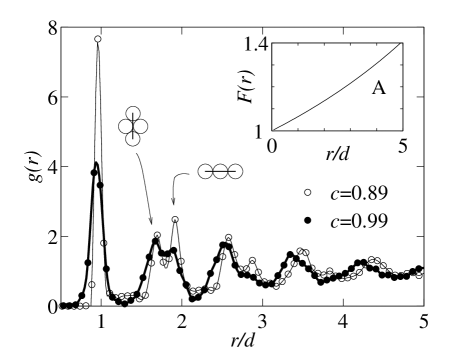
The geometrical structures associated with the peaks at and in the RDF are illustrated in Fig. 7 by a conditional three-point correlation function Torquato (2002).
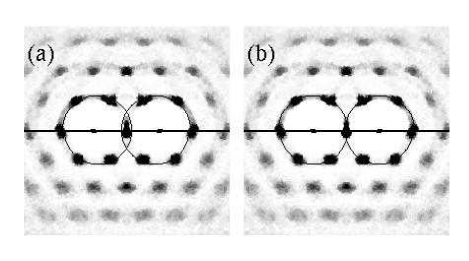
Figure 7(a) was generated by identifying all grain centers at distances to each other in the packing, aligning each pair of such centers along the horizontal axis, and plotting the surrounding grain centers in the corresponding positions. The two fixed grain positions are shown on the horizontal axis at the center of the figure, while the surrounding intensity structure visualizes the probability of having a third grain in any position relative to the two fixed ones. The intensity was normalized by the number of pairs contributing to the plot. Figure 7(b) is generated in the same manner as (a), but for grains at a distance of to each other. The upper half of (a) and (b) shows the probability distribution for the initial stage of the compaction (), while the lower part shows the distribution at . Black represents a high probability of the third grain, and white represents zero probability. The black circles mark the distance of one diameter from the two fixed grain positions. The intensity pattern suggests a regular structure with obvious symmetries in the packing. At first glance, the structure might seem hexagonal, but this is due to the alignment of the two fixed centers; The underlying structure is triangular. Although the intensity plot of Fig. 7(a) does not prove the presence of the four-point configuration illustrated in Fig. 6, closer inspection of the configurations contributing to this peak (at ) in the RDF shows that this configuration is dominant for . Similarly, the configuration of three grains in a row is seen to contribute most to the peak at of the RDF, although the center grain is often slightly misplaced along the axis. The lower part of Fig. 7(a) contains a small probability of a third grain in between the two fixed grains (barely visible in the figure), which is not seen in the upper part (). This very compressed alignment of three grains in a row emphasize the role of ductility of the grains, as this configuration is impossible in packings of hard disks.
The cumulative distribution of distances between touching grains is shown in Fig. 4(b). The average distance between touching grains decreases from the first to the last image, while the width of the distribution increases. The touching grains at distances larger than a grain diameter are grains aligned perpendicular to the compaction direction, thus the ellipticity of grains increases, especially in the last compaction stage.
The coordination number distribution is shown in Fig. 8 as a three-dimensional plot of the distribution as function of coordination numbers and packing fraction . The distribution is broad at , and then narrows and shifts to higher coordination numbers with increasing packing fraction. At packing fractions – a few cases of grains with only two contacts are observed, but only one or two such grains are present at each packing fraction. Curves A and B in Fig. 8 are projections of the first and last distributions of the experiment, respectively. Curves C and D are projections of the fractions of five and six coordination numbers with increasing packing fraction.
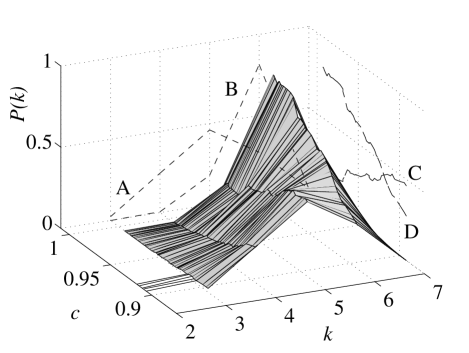
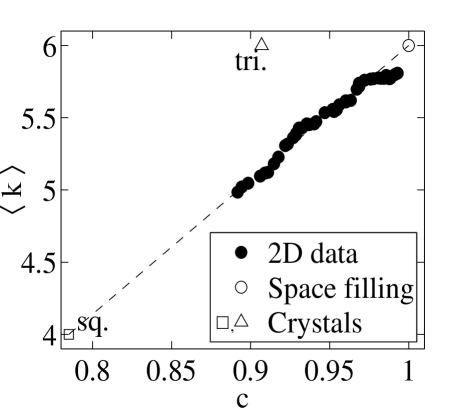
Figure 9 shows the average coordination number as function of packing fraction in the two dimensional experiment. The circle at coordinates (1,6) represents the endpoint for 2D systems, as a space filling structure (Voronoi cells) in 2D must have six neighbors on average Coxeter (1969). Also shown are the data for two crystalline structures, the square lattice and the triangular lattice. We observe that the evolution of the average coordination number in the ductile packing closely follows a straight line between the square lattice and the space filling Voronoi structure.
III The three-dimensional systems
The three-dimensional (3D) systems analyzed here are six experimental systems of compacting ductile grain ensembles. These are compared to Finney’s experiment Finney (1970) on a random close packed ensemble of hard spheres (), from which the positions were kindly made available to us. This ensemble contained nearly 8000 grains in a square box, and the positions of the grains were measured to a precision of 0.2% of the grain diameter. A numerical model of a compacting grain ensemble is also presented, giving possible trajectories for compaction between packing fractions –0.64).
III.1 Experiments
The 3D experimental setup consisted of ductile grains poured into a cylindrical Plexiglas container, approximately ten at a time, to a height . The set of grains were then left to compact under gravity for a time , or were mechanically compacted to a specific packing fraction. A lid covered the top of the cylinder during the experiment to avoid dehydration, as the grains contain water and other volatile chemicals. Figure 1(b) illustrates the setup of the 3D experiments. The grains were prepared from Play-Doh (Hasbro Int. Inc., UK) to spheres of diameters mm. The material is viscous for shear rates in the range (–)/s, with a viscosity of Pa s, as measured in rotational tests (Paar-Physica MCR 300, rheometer). Except from the first few minutes and the very end of an experiment, the strain rate was within this regime. Strain rates down to /s were common after a week’s compaction, but shear tests could not be performed at such low rates, and the material properties for these rates are not known.
Each experimental system was disassembled grain by grain while measuring positions and/or coordination numbers of the ensemble. The position coordinates () of the grains’ top point were established with a mechanical arm (MicroScribe) to an estimated resolution of mm (6% of grain diameter), limited by the difficulty of establishing the center of the grain’s top surface. The number of touching neighbors (coordination number) was also counted for each grain during the disassemblage. To ease this procedure, grains of five different colors were used, as grains of different colors left marks on each other in contacting areas. Before a grain was removed, the visibly contacting neighbors were counted. The grain was then removed, and any formerly hidden contacts became visible due to grain deformation and/or dis-coloring. As a grain was removed, all its contacting grains that remained in the ensemble were carefully marked with a felt pen. Thus, the coordination number of a grain consisted of the number of marks on its upper surface, plus the number of visible and hidden contacts established during the removal of the grain itself. The number of contacts that each grain had to the cylinder wall and/or floor was also recorded.
Six different three dimensional ensembles were studied: Two of them with 2200 grains in a cylinder of diameter mm, the rest with 150 grains in cylinders of diameter mm. The four small systems were prepared simultaneously, and left to compact for different amounts of time before each was disassembled and the positions and coordination numbers of each system measured. The resulting packing fractions were 0.64, 0.64, 0.66 and 0.68 . The small system size was desirable in order to avoid considerable compaction during the disassemblage for the short compaction times. One of the big systems was left to compact for 145 hours before it was disassembled, measuring the positions and coordination numbers of the grains. The packing fraction went from 0.57 (based on filling height) to 0.701 during the compaction in this ensemble. Due to a calibration error with the mechanical arm, only the positions of 787 grains in the mid to lower part of the cylinder were successfully measured, while the coordination number was established for 1169 grains. The second large system was compacted to a packing fraction of by gently pushing a piston from the top of the cylinder. Compacting the system to such high packing fractions would otherwise have required months of gravitational compaction. Only the coordination numbers were measured in this ensemble, for 839 central grains.
III.2 The Finney ensemble
Finney Finney (1970) carefully measured the positions of nearly 8000 mono-disperse spheres in a box of square crossection. The spheres were steel ball-bearings of diameters 1/4 inch, which positions were measured to of the grain diameter. The central 817 grains were used in this analysis, as these grains had a minimum distance of five grain diameters to any boundary, thus no corrections to the RDF was necessary to . Based on this selection, the radial distribution function and coordination numbers were found.
III.3 Numerical compaction model
A numerical model (Rampage, Alberts (2005)) was used to simulate dry granular media. It consisted of randomly placing one thousand mono-disperse spherical grains of diameter in a container of square cross-section. Periodic boundary conditions applied in the horizontal plane. Grains were randomly positioned until a packing fraction of was obtained. No considerations about overlapping particles were done during this initial filling procedure. The overlaps were then reduced by repositioning grains according to a force balance based on the elastic energy of the overlap region, and gravity. An overlap of volume resulted in an inter-grain force of
| (10) |
in which is Young’s modulus of the material. When gravitationally unstable, a grain would drop or roll until a gravitationally stable condition was obtained. This compaction process went on until a predefined toleration threshold of average overlap distance was reached (), while the ensemble was gravitationally stable. At this point further compaction was obtained by tapping, an incremental () vertical re-positioning downward of each particle (at height ), followed by the same procedure of reducing overlaps and reaching gravitational equilibrium. Packing fractions of stable numerical ensembles were in the range –. This model was originally developed for the modeling of sediment compaction, and is described in detail in Ref. Alberts (2005). The model reproduces statistically Finney’s ensemble at with respect to the RDF, the coordination number distribution and the distribution of contact angles, see Ref. Alberts (2005).
III.4 Analysis (3D)
III.4.1 Packing fractions
In three dimensions, the packing fractions were computed from the position measurements for all the cases in which these were available, which were most of the ductile experiments, the Finney ensemble, and the numerically generated ensembles. Boxes of variable square cross-section and height equal to the height of the packing were centered in the granular ensemble for calculation of the packing fraction. For each of these boxes , the packing fraction was , where is the number of grains contained in the box, is the average volume of a grain, and is the volume of the box. Grains that partially intruded the box, i.e., when their center position was less than one grain diameter from the box boundary, also contributed to the number of grains in the box. The overall packing fraction of an ensemble was obtained by averaging over boxes in distances 0.5–1.5 grain diameters from the boundary:
| (11) |
where is the side of the box in a distance 1.5 grain diameters from any boundary, and . In the numerical model, the total volume of two touching grains was smaller than two grain volumes if the grains overlapped. The overlap volume was not assumed to be transported to the pore volume, as this would effectively change the structure of the packing, thus the calculation of the packing fraction must account for the excess overlap volumes in the packing. This was done by reducing the sphere radii by the mean overlap distance in the packing, thus reducing the volume of the grains before calculating .
III.4.2 Radial distribution function
The radial distribution function in three dimensions is given by Eqs. (6) and (7), but with as the volume of a spherical shell of radius and width in 3D: .
Equation (6) was used in the calculation of the RDF in the Finney ensemble, as an ensemble average was made only over the central 817 grain positions to avoid boundary effects. These grains were all in a minimum distance of five grain diameters from any boundary, thus the RDF is not affected by boundaries up to . In order to calculate the RDFs of the large ductile ensemble (), Eq. (7) was used, as the statistics of the whole ensemble was needed for a sufficiently detailed RDF to be found. A finite size correction function was introduced for the ductile ensemble in the same manner as for the 2D system, Eq. (8). In 3D, is the fraction of the spherical shell area (radius , center position at , height ) which is inside the cylindrical container. The resulting correction function is
| (12) |
where
| (13) |
| (14) |
and . is presented in the inset of Fig. 10. is here the length of , i.e., the radial distance of a grain center from the cylinder axis. The width of the spherical shells were chosen so that the standard error of distribution from the mean was less than two per cent of the RDF, for the second peak. This gave the following resolutions of the RDFs; (ductile ensemble) and (Finney).
III.4.3 Coordination numbers
Coordination numbers in three dimensions were found experimentally for the ductile ensembles, as described in section III.1. As the grains in contact to the walls were known, the distributions of coordination numbers for the ductile ensembles are based only on the internal grains. In the second of the large ensembles (), only grains at a minimum distance of three grain diameters from any boundary were included. For the Rampage and Finney ensembles, the coordination numbers were based on the position data. In the Rampage ensembles grains in a distance less than one grain diameter apart were considered touching, as the model allows small overlaps between grains. In the analysis of the Finney ensemble, grains were considered touching if the center to center distance was less than 1.02 grain diameters. The choice of this distance was based on the average contact number obtained when different ’s were assumed for touching neighbors: If grains were assumed touching only when their center to center distance was 1 or less, . rapidly increased as the assumed distance for touching grains increased, and at 1.02 , the average coordination number was 6.72. Also, at 1.02 , all grains (except for one) had at least three neighboring grains at distances closer or equal to , which is the stability criteria in 3D for grains shielded by granular bridges.
III.5 Results (3D)
To calculate RDFs, the center positions of the grains must be known, whereas in the 3D ductile experiments the positions of the top points of the grains were measured. Although the top points are not the shifted positions of the grain centers, they were used in calculating the RDF, as they represent correlations between specific points in the ensemble in the same way that the center positions do. Also, it should be directly comparable to the RDFs of hard granular ensembles, as in these the top positions are truly linear translations of the center positions. The detailed structure of an ensemble can only appear in the RDF if there is a sufficient amount of grains in the ensemble. Only the large ductile system contains enough grains to capture the main features of the RDF, thus unfortunately, we can only compare the ductile system at a packing fraction of to the Finney ensemble (), and only at a resolution of . The normalized RDF of the ductile ensemble is shown in Fig. 10, as is also the RDF of Finney’s ensemble for dry granular media.
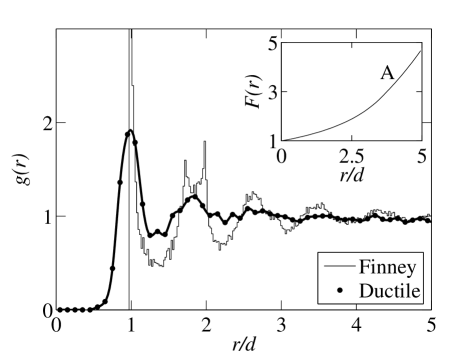
From the figure, we see that the ductile ensemble is much less ordered than the hard granular ensemble, as all peaks and valleys in the RDF are small compared to the Finney RDF. We also note that the RDF of the ductile packing has a value for distances smaller than one grain diameter, which is not surprising, as this reflects the grains’ ability to deform and thus obtain distances closer than one grain diameter. We see fewer clear peaks for the ductile ensemble than for the Finney ensemble, as deformed grains broaden the peaks. The split second peak in the RDF of the Finney ensemble is not present in the ductile ensemble.
The coordination number distributions for the ductile systems are presented in Fig. 11.
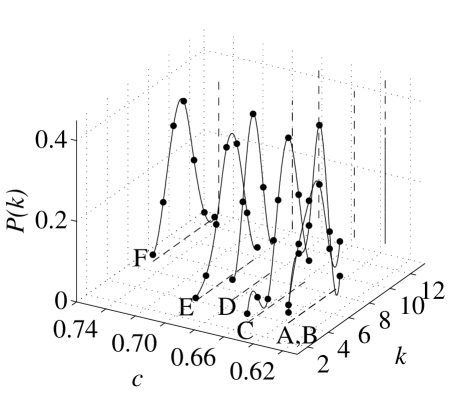
The distributions shift to higher coordination numbers as the density increases, as is to be expected. One interesting observation is that two of the distributions for the small ensembles contain grains of a coordination number as low as three. This is possible for grains that are shielded by granular bridges, which are also found in the Finney and Rampage packings to a similar degree ( of the internal grains). Due to the cohesion between the ductile grains, the effect of granular bridging was expected to be more dominant in the looser ductile structures than in the Finney and Rampage structures, which is not the case. For the denser ductile structures () all grains have coordination numbers larger than three, but the width of the distributions remain the same within 4%. Figure 12 shows the mean coordination numbers as a function of packing fraction for the ensembles presented in this paper, and also for a few cases from the literature.
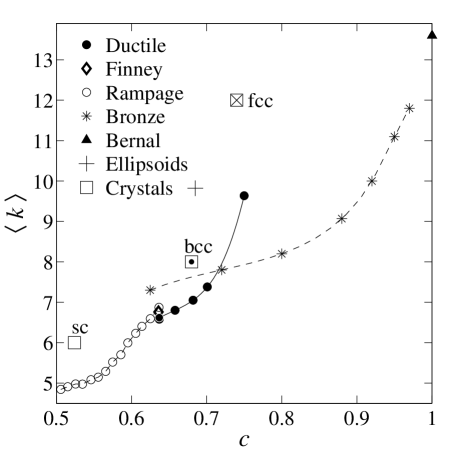
The compaction of the ductile grain ensembles (filled circles) start in the neighborhood of the random close packed Finney ensemble (diamond), and then increases with . The first five points on this curve were obtained from gravitationally compacted ensembles, thus their compaction process is the same. The last point, at , was obtained by mechanical compaction of a piston, and therefore does not necessarily represent the natural evolution of the gravitational ensembles. The numerical model (Rampage) evolved along the curve represented by open circles in Fig. 12, during one simulation. It ends up also in the neighborhood of the Finney ensemble. Note that the trajectory of the Rampage packing does not seem to be continued by the ductile ensembles, as the curves have different slopes at . Another ductile ensemble from the literature is presented in the figure (asterisks): Fischmeister et. al Fischmeister et al. (1974) conducted compaction experiments on bronze powder by die compression at various pressures. The compacted ensemble was forced open after compression, and the number of contacts and porosity measured. For the smallest packing fraction, the powder was sintered in order to mark the contact points of a non-compressed ensemble. The data at higher packing fractions were compacted at pressures of 0.2, 0.4, 0.6, 0.8 and 1.0 GPa, respectively. The powder had an initial size distribution of –m. The packing of hard ellipsoids Donev et al. (2004) is marked as a plus sign in Fig. 12, and the crystalline ensembles of simple cubic, body centered cubic and face centered cubic are plotted as various types of squares.
IV Discussion
That the shape of the grains is an important parameter for the structure is evident from the experiment by Donev et al. Donev et al. (2004), who studied the coordinations in an ensemble of ellipsoids and found a mean coordination number of 9.82 in an ensemble of packing fraction . This value is much larger than that found in spherical ensembles at similar (but lower) . The compaction of hard spherical grains to higher densities than the random close packed (rcp) value (–0.64) Scott (1962); Bernal and Mason (1960) occurs by increasing the amount of crystalline regions. Pouliquen et al. Pouliquen et al. (1997) obtained a strongly crystalline packing () from mono-disperse glass spheres by horizontal shaking and slow filling of a container. However, handling hard spheres without fine-tuning the assembling procedure commonly results in values around . The compaction of deformable grains allows larger packing fractions to be obtained than hard grain ensembles do, because the shape of individual grains can change. Whereas the crystallization of compacting hard grains would show up in the RDF, the evolution of the RDF during compaction is not given in ductile ensembles, as they might compact by structural ordering or grain deformation. Shape changes from that of a sphere or a disk are expected to cause disordering (e.g., there are no crystalline arrangement of pentagons). There are space filling crystalline structures (squares, pyramids), but these are very unstable under any geometrical perturbation, as more than three edges meet at each vertex of the structure.
The radial distribution functions in two and three dimensions as they were studied here, were both seen to lose some of the structure associated with hard grain arrangements as high packing fractions were approached. The RDF in 2D numerical hard disk ensembles has been shown Myroshnychenko and Brosseau (2005) to develop its structure considerably through packing fractions –0.83. The split second, the third, and the fourth peaks were seen to develop between –0.83, and the RDF at resembles the RDF of the 2D ductile experiment in the initial stage (Fig. 6). Our 2D ductile system, when further compacted, gives less distinct splitting of peaks, and the RDF thus loses some of its detailed structure toward (see Fig. 6). Interestingly, we saw that the peak at corresponded to a cluster of four grains in the configuration shown in Fig. 6 in the initial part of the experiment, the same configuration that contributes to the peak at in hard disk ensembles. Thus, the initial part of our experiment is dominated by similar configurations as in hard disk ensembles, but with shortened distances. At the end of our experiment, though, several different configurations contribute to this peak in the RDF, thus there are important structural changes compared to hard disk packings.
A similar evolution is expected for 3D ensembles; A certain packing fraction must be reached for locally ordered grain arrangements to occur, and for details in the RDF structure to emerge. When grain deformation becomes important for further compaction, the RDF structure becomes less distinct (Fig. 10). This ‘destructuring should become influential in the 3D ductile grain ensembles at packing fractions close to the random close packing, , assuming that frictional forces between the grains prevent rearrangements. The RDF of the ductile 3D system at has no clear peaks after , and has much smaller and broader peaks than that of the 2D system at . This difference could be due to the extra degree of freedom introduced by the third dimension, or possibly the differences in rheology between the materials used in 2D and 3D, and how they react to the way they were compacted. Also a size distribution of the grains would tend to broaden the peaks in the RDF, but the size distribution is similar for our 2D and 3D experiments (3% and 2.3%, respectively).
The evolution of the coordination number distribution suggests geometrical ordering to take place in the 2D ductile system. The distribution narrows considerably, and only the number of grains with six contacts increases, see Fig. 8. Grains with only two contacts occur for a limited range of packing fractions –0.918, and these are due to shear motion, during which two neighboring ordered regions align. In three dimensions, the evolution of the coordination number distribution is not as distinct. The average, , increases, but the width of the distribution stays practically constant during compaction. The reason for this could be that the 3D ductile systems are not as compacted as the 2D system is, thus a marked narrowing of the coordination number distribution might not take place until larger packing fractions are reached. Also, the mean coordination number in 2D has a maximum of six, while no established maximum exists in 3D. Thus, the distribution of in 2D must narrow as the system gets denser, whereas the 3D system does not have this strict constraint.
In 2D, the evolution of the average coordination number increased with packing fraction toward the theoretical value , which applies to 2D space filling structures (Voronoi cells). At the end of the 2D experiment, 1% of pore space remained, and according to Fig. 9, the increase in average coordination number must be steep for in the range 0.99–1. The evolution of follows the straight line between the square lattice () and the space filling structure () up to . Although an increase of with was expected, the linear evolution was not. The dominant crystalline structure is triangular from the start of the experiment, and regions of dense triangular structures () were thought to develop rapidly during the initial compaction.
3D deformable grains will approach a space filling structure of polyhedra with increasing packing fraction. This structure is not necessarily the packing’s Voronoi structure, as the interfaces between neighboring grains then would have to be normal to the center-to-center distance. However, the statistical features of the Voronoi structure might be applicable at . No theoretical value exists for the average coordination at in 3D, but a value around 13.6 was found by Bernal Bernal (1965) based on an experiment with compacted plasticine. The Voronoi tessellation of hard sphere packings at different packing fractions have shown that the average number of sides of a Voronoi cell, , decreases with increasing packing fraction Yang et al. (2002); Oger et al. (1996). From Voronoi analysis of the ductile ensemble at , we find that , and presume that in the ductile ensembles at must be below this value. At a packing fraction of , all the faces of the polygon must be touching a neighbor, thus at . This suggests that had the ductile ensembles been allowed to compact to , their average coordination number would be less than 14.5, and possibly close to Bernal’s experimental value of 13.6.
How the Voronoi cell structure changes during compaction must depend on the compaction procedure. If the packing is compacted isomorphically, the relative positions of the grains are fixed with respect to each other, and the Voronoi structure is constant. For grains on the square lattice, the Voronoi cells would remain squares throughout an isomorphic compaction, thus for all . A random initial packing, or a non-isomorphic compaction procedure, would instead result in an increase of the average coordination number toward . Thus the trajectories a compacting system makes in the ()-plane is not fixed, but is expected to depend on initial configuration and compaction procedure. As seen from Fig. 12, the ductile Play-Doh ensemble compacts in a self-compacting trajectory (apart from the last point on the curve), which evolves differently than the compacted bronze powder. The bronze powder was compacted by increasing uniaxial pressure, while our system sustained constant uniaxial pressure of gravity. Also, the Rampage model of compaction has a trajectory leading into the region where the ductile compaction starts, but has a different slope at than the trajectory of the ductile packings. The different compaction procedures might be an explanation for these different trajectories in the ()-plane.
Hard spherical ensembles can rather easily be compacted to the rcp value, , and are well represented by Finney’s packing in the ()-plane. This point might be fairly common for spherical ensembles, considering that both the Rampage model, and two of the ductile ensembles plot in the immediate neighborhood. Looser initial configurations might be obtained in packings of high cohesion or friction, which would change the starting point of the compaction in the ()-plane. That the bronze powder of Ref. Fischmeister et al. (1974) plots at a higher than the rcp is thought to be due to the wide size distribution of grains, and the sintering procedure used. The hard elliptical grain ensemble Donev et al. (2004) was assembled in the same way as the Finney packing, but produced a much higher packing fraction and average coordination number. The ability of the grains in the ductile packing to change their shape does not, however, take the ductile packing into the ellipsoid value of until for the Play-Doh ensembles, and for the bronze powder (see Fig. 12). Hence, the initial grain shape is an important factor for the initial compaction state in ()-plane.
V Conclusion
We have performed compaction experiments on two- and three-dimensional packings of mono-disperse ductile grains, and studied the evolution of their structure with increasing packing fraction. The radial distribution function and coordination number distribution were found for both systems. The radial distribution function developed broader and smoother peaks, seemingly loosing ordered structure in both 2D and 3D. The 2D local configuration around grains in distances revealed that while mainly one configuration contributed to the corresponding peak in the initial RDF, two configurations contributed to the same peak at the most compacted stage of the experiment. The coordination number distribution narrows considerably in the 2D-packing during the compaction, while no such narrowing is seen in the 3D-system. The average coordination number in 3D evolves beyond that of hard spherical ensembles, and its evolution is discussed in relation to other granular ensembles, as the compaction procedure and initial grain shape seems to be important parameters for the compaction trajectory in the ()-plane.
This is a new approach to the study of compaction in granular ensembles, which emphasizes the importance of grain ductility on the evolving structure. Further work is necessary to understand the importance of compaction procedure, initial grain shape, and rheology for the final structure. In particular, 3D in-situ experimental investigations of evolving geometry during compaction would give a strong contribution to the understanding of how local structure depends on compaction procedure.
Acknowledgements.
The project has been supported by the Norwegian Research Council through the Fluid Rock Interaction Strategic University Program (grant 113354-420). LU would like to thank Birger Sevaldson for use of the MicroScribe.References
- Donev et al. (2004) A. Donev, I. Cisse, D. Sachs, E. A. Variano, F. H. Stillinger, R. Connelly, S. Torquato, and P. M. Chaikin, Science 303, 990 (2004).
- Xu et al. (2004) J. Q. Xu, R. P. Zou, and A. B. Yu, Phys. Rev. E 69, 032301 (2004).
- Forsyth et al. (2001) A. J. Forsyth, S. R. Hutton, C. F. Osborne, and M. J. Rhodes, Phys. Rev. Lett. 87 (2001).
- Vanel et al. (1999) L. Vanel, D. Howell, D. Clark, R. P. Behringer, and E. Clément, Phys. Rev. E 60 (1999).
- Bloomquist and Shutt (1940) C. R. Bloomquist and R. S. Shutt, Ind. Eng. Chem. 32, 827 (1940).
- Nowak et al. (1997) E. R. Nowak, J. B. Knight, M. L. Povinelli, H. M. Jaeger, and S. R. Nagel, Powder Technology 94, 79 (1997).
- Finney (1970) J. L. Finney, Proc. Roy. Soc. Lond. A 319, 479 (1970).
- Bernal and Mason (1960) J. D. Bernal and J. Mason, Nature 188, 910 (1960).
- Knight et al. (1995) J. B. Knight, C. G. Fandrich, C. N. Lau, H. M. Jaeger, and S. R. Nagel, Phys. Rev. E 51, 3957 (1995).
- Ribiére et al. (2005) P. Ribiére, P. Richard, D. Bideau, and R. Delannay, Eur. Phys. J. E 16, 415 (2005).
- Richard et al. (2003) P. Richard, P. Philippe, F. Barbe, S. Bouries, X. Thibault, and D. Bideau, Phys. Rev. E 68 (2003).
- Weller (1959) J. M. Weller, AAPG Bulletin 43, 273 (1959).
- Fischmeister et al. (1974) H. Fischmeister, E. Arzt, and L. Olsson, Powder Metallurgy pp. 179–187 (1974).
- Torquato et al. (2000) S. Torquato, T. M. Truskett, and P. G. Debenedetti, Phys. Rev. Lett. 84, 2064 (2000).
- Hales (1727) S. Hales, Vegetable Staticks (W. and J. Innys, and T. Woodward, London, 1727), reprinted 1969 by Macdonald Ltd., London.
- Alberts (2005) L. J. H. Alberts, Ph.D. thesis, Delft University of Technology (2005).
- Pratt (1991) W. K. Pratt, Digital Image Processing (John Wiley and Sons Inc., New York, 1991).
- man (2005) Matlab 7.0.4.352 (R14) Library, The MathWorks Inc. (2005).
- Mason (1968) G. Mason, Nature 217, 733 (1968).
- Torquato (2002) S. Torquato, Annu. Rev. Mater. Res. 32, 77 (2002).
- Coxeter (1969) H. S. M. Coxeter, Introduction to geometry (John Wiley and Sons, Toronto, 1969).
- Bernal (1965) J. D. Bernal, in Liquids: structure, properties, solid interactions, edited by T. J. Hughel (Amsterdam (Elsevier), 1965), pp. 25–50.
- Scott (1962) G. D. Scott, Nature 194, 956 (1962).
- Pouliquen et al. (1997) O. Pouliquen, M. Nicolas, and P. D. Weidman, Phys. Rev. Lett. 79, 3640 (1997).
- Myroshnychenko and Brosseau (2005) V. Myroshnychenko and C. Brosseau, Phys. Rev. E 71 (2005).
- Yang et al. (2002) R. Y. Yang, R. P. Zou, and A. B. Yu, Phys. Rev. E 65, 041302 (2002).
- Oger et al. (1996) L. Oger, A. Gervois, J. P. Troadec, and N. Rivier, Philosophical Magazine B 74, 177 (1996).