Experimental study of the compaction dynamics for 2D anisotropic granular materials
Abstract
We present an experimental study of the compaction dynamics for two-dimensional anisotropic granular systems. The compaction dynamics of rods is measured at three different scales : (i) the macroscopic scale through the packing fraction , (ii) the mesoscopic scale through both fractions of aligned grains and ideally ordered grains , and (iii) the microscopic scale through both rotational and translational grain mobilities . At the macroscopic scale, we have observed two stages during the compaction process suggesting different characteristic time scales for grain relaxation. At the mesoscopic scale, we have observed the formation and the growth of domains made of aligned grains during the first stage of compaction. At the late stage, these domains of aligned grains are sheared to form ideally ordered domains. From a microscopic point of view, measurements reveal that the beginning of the compaction process is essentially related to translational motion of the grains. The grain rotations drive mainly the process during the late stages of compaction.
pacs:
45.70.Cc, 64.70.KbI Introduction
Most of the industrial products are processed, transported and stocked in a granular state. The packing fraction of those granular materials becomes therefore a relevant parameter for a broad range of applications. The best way to reduce the costs for the manipulation of such granular materials is to increase the packing fraction . This can be achieved by tapping or vibrating the vessel containing the grains.
Granular matter has been the subject of numerous studies since the last decade deGenne ; granularSolidLiquidsGases ; Duran ; Kudrolli ; Francois . From a scientific point of view, granular system are interesting system because they exhibit disorder, complex behaviors and strong analogies with glasses Glasses and colloids vanMegen .
Various experimental studies densFluc ; densityRelax ; kww1 ; richard ; LumayVandewalle2 have underlined the fact that the dynamics of compaction is a complex problem. The compaction is actually characterized by an extremely slow dynamics. Different laws have been proposed for the volume fraction of a granular assembly as a function of the number of taps. Since both initial and final packing fractions depend on the experimental conditions, a normalized parameter is defined. One has
| (1) |
with . This parameter has the great advantage to be reproducible.
It has been proposed by Knight et al. densityRelax , that the packing fraction obeys an inverse logarithmic law
| (2) |
where and are dimensionless parameters. This inverse logarithmic law was also obtained in numerical models like the Tetris one Tetris ; Tetris2 . The law (2) could also be derived from theoretical arguments slowRelax .
Some theoretical models boutreux ; arenzon1 ; arenzon2 are based on a relationship between the mobility of the grains and the global packing fraction of the packing. The mobility is a local property of the grains and corresponds to the grain ability to move inside the packing. By considering that the variation of the packing fraction induced by a tap is proportional to the grain mobility, one can write the simple equation
| (3) |
where is a constant. By considering a caging effect of the grains, some authors boutreux proposed the Vogel-Fulcher law for the decrease of the mobility with the packing fraction . One has
| (4) |
This relation could be combined with Eq. (3) in order to obtain an inverse logarithmic behavior for .
The slow dynamics of granular compaction has also been described by a cluster model clusterModel . A cluster is a group of grains ideally packed. The granular material is then considered as a system of various clusters competing in a random environment. Vibrations cause the slow growth of the cluster size. This growth leads to a logarithmic law (2) for the evolution of the packing fraction. The relevant parameter for measuring any grain ordering is the fraction of grains ideally packed. This parameter could also be normalized. One has
| (5) |
with .
More recently, Philippe and Bideau kww1 found that the compaction dynamics is better fitted by a stretched exponential law, like
| (6) |
This exponential law presents the great advantage to fit a saturation of the packing fraction which is sometimes accessible in experiments (for larges values). Both parameters and correspond respectively to a characteristic tap number and to a stretching exponent. One should notice that in the experiments of Philippe and Bideau, the steady state corresponds to a dynamical balance between convection and compaction.
In a previous experimental work LumayVandewalle2 , we have performed a multiscale study of the compaction dynamics for a 2D pile of spherical particles. We have shown that granular compaction dynamics could be viewed as a slow process of crystallization driven by the diffusion of defects in the packing. The evolution of the normalized fraction of ideally ordered grains is well described by the Avrami model. One has
| (7) |
The Avrami exponent depends on the nature of the growth and is a characteristic time. For the compaction of spherical particles, we have obtained an exponent . A new law for the compaction dynamics can be derived from this crystallization model. One has
| (8) |
i.e. a law similar to the Philippe and Bideau’s law. The combination of both Eq (3) and (8) gives a law for the mobility. One has
| (9) |
In a couple of previous papers PG2005Lum ; Tshape , we proposed an empirical law to fit the decrease of the mobility with the normalized packing fraction , instead of Eq. (9). One has
| (10) |
where is a constant initial mobility and is the decrease rate of the mobility with the normalized packing fraction . This exponential law presents a practical interest. Indeed, the value of the parameters and could be easily fitted and discussed.
The Table 1 summarizes the different laws proposed for describing the compaction of isotropic granular materials.
| Granular type | packing fraction | crystallization | grain mobility | comment | ref |
|---|---|---|---|---|---|
| 3D pile of spheres | semi-empirical law | densFluc ; densityRelax | |||
| 3D pile of spheres | semi-empirical law | kww1 | |||
| 2D pile of disks | theoretical law | LumayVandewalle2 | |||
| 2D pile of disks | empirical law | PG2005Lum ; Tshape |
Granular materials are rarely composed of perfectly spherical particles. Recently, some studies on 3D packing of anisotropic grains have been performed Kudrolli2 ; LumayVandewalle1 ; convectAnisotropic ; rods ; thin-rod ; spherocylinders . The major difference between sphere and cylinder packings is the tendency of cylinders to align themselves along their symmetry axis. Cylinders have also the tendency to align themselves along the container walls. Villaruel et al. rods studied the compaction of cylindrical particles with an aspect ratio in a thin tube. In their three-dimensional experiment, the ratio between the particle length and the container diameter is . During the compaction, they observe three stages. Underlining that the previous laws (1-10) capture only a part of the physical mechanisms behind compaction. The first stage is a rapid vertical collapse of the pile. The second stage is a slow ordering of the particles along the sidewalls. The final stage is a steady state. In a previous work LumayVandewalle1 , we have shown the importance of the grain aspect ratio on the compaction properties for three-dimensional packing. Stokely et al. prolatePacking investigated a 2D packing of extremely prolate granular material (aspect ratio ). They observed a strong orientational correlation for particles separated by less than two particle lengths. Furthermore, a general preference for horizontal alignment was observed.
In the present paper, we investigate the compaction of a 2D pile of cylindrical particles. In the first part of the paper, we give some details about the tap characteristics. Then, the compaction dynamics is analyzed at three different scales : (i) the macroscopic scale through the normalized packing fraction , (ii) the mesoscopic scale through both fractions of grains aligned and ideally ordered grains , and (iii) the microscopic scale through the grain rotational and translational mobilities .
II Experimental set-up
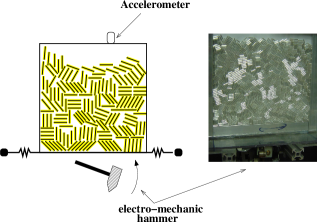
Cylindrical particles are placed between two vertical parallel plates. The number of particles is typically . The cylinder diameter is mm and the cylinder length is mm. Therefore, the aspect ratio of the cylinder is . In order to avoid the possible overlapping of the grains, the distance between both vertical plates is slightly greater than the particle diameter. The width of the pile is 150 mm () and the mean height is initially 140 mm (). Piles are formed by (1) randomly distributing particles on one glass plate, (2) fixing the second plate, and (3) slowly tilting the system to the vertical. A sketch and a picture of the setup are given in Figure 1.
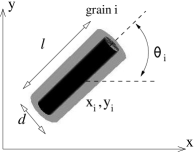
The grains we used are formed by a metallic rod enclosed in a glass cylinder (see Figure 2). The pile is rear illuminated by an homogeneous light source. In such a way, the metallic core of the grains appears black and their outline appears bright. With this configuration, parallel grains can be resolved. A camera records pictures of the pile during the experiment. Therefore, we can measure the position () and the orientation () of each grain by image treatment. The study of the grains motion during a tap is performed by an ultrafast camera. The compaction dynamics is analysed by a high resolution camera ( pixels).
To produce the successive taps, an electro-mechanic hammer is placed below the container. The hammer is tuned by a micro-controller that can adjust the intensity, the number and the frequency of the taps. The acceleration experienced by the system at each tap is measured by an accelerometer connected to an oscilloscope. Taps are characterized in the next section. Two successive taps are separated by 500 ms. This time is much longer than the relaxation time of the system after each acceleration peak (see below). Since the dynamics of compaction slows down with the number of taps , we recorded images of the system only for with . In order to improve the measurements, some additional images are recorded at the end of the process.
III Tap characteristics
Similarly to our previous works LumayVandewalle1 ; LumayVandewalle2 , we use an original system to produce taps. Some details about the tap characteristics and about the response of the pile are given in this subsection.
As we can see in Figure 3a, the system undergoes a short and strong peak of negative acceleration during a tap. The main peak lasts 0.25 ms and the maximum intensity reaches -15g. Some damped oscillations during a few milliseconds are observed. The movement amplitude of the system is very small with respect to others. In both Rennes richard ; kww1 and Chicago rods ; densityRelax ; slowRelax experiments, taps are produced by an electromagnetic exciter and consist of an entire cycle of a sine wave. For high accelerations, the considerable amplitude of the container movement produces some convection in the pile. It should be noted that such a global motion is not present in our experiment. With our set-up, we only observe the compaction phenomenon.

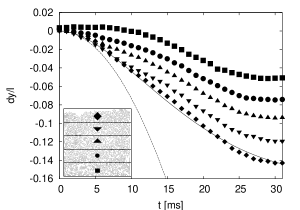
In order to characterize precisely the grain motions induced by a tap, we have recorded the pile with a fast video recorder (1000 images/s) just after the first tap of a series. The position of each grain (,) has been measured on each picture. The index is the number of the grain. The pile has been divide in five horizontal layers (see Figure 4 inset). The mean vertical displacement of the grains just after the tap has been compute in these layers (i.e. for different heights in the pile). For the layer L, one has
| (11) |
where is the number of grains in the layer. The evolution of this mean vertical displacement just after the first tap is presented in Figure 4. During and after the tap, we do observe neither upward movement nor take off from the bottom of the container. The movement of the grains situated on the top of the pile is well fitted by a free fall , with , for ms. After ms, the movement is damped. This damping is fitted by an exponential decay. The damping is due to friction and collisions with both other grains in the packing and the side walls. For grains situated in the center and in the bottom of the pile, the amplitude of the mean vertical displacement is small. Moreover, the dynamics is slower. Indeed, due to the Janssen effect, the influence of the friction with the side walls is more important. The fact that the five curves in Figure 4 do not coincide for large time is due to a densification witch depends on the depth in the packing. It should be noted that this tap is the first one of the series. For the followings taps, the displacements of the grains becomes much smaller and similar curves cannot be measured when the packing fraction increases.
IV General observations
At the macroscopic scale, compaction is measured through the packing fraction . The pile is made of cylindrical grains of length and of diameter . Therefore, the packing fraction is the ratio between the total surface of the grains on the picture and the total surface of the pile . The later is estimated by taking into account the average position of the surface grains. One has
| (12) |
Figure 5 presents snapshots of the pile during compaction. The packing fraction of the initial pile () is small in comparison with the same experiment made with spherical particles () LumayVandewalle2 . Furthermore, an angular disorder is clearly observed for . When increases, some domains of parallel grains appear and grow. The degree of disorder decreases. This growth of ordered domains could be compared to a crystallization process. The final packing fraction, at the end of the experimental run, is . For spherical particles in the same conditions, the final packing fraction is close to LumayVandewalle2 . The range of the packing fraction accessible to anisotropic particles is thus quite large with respect to spherical particles.
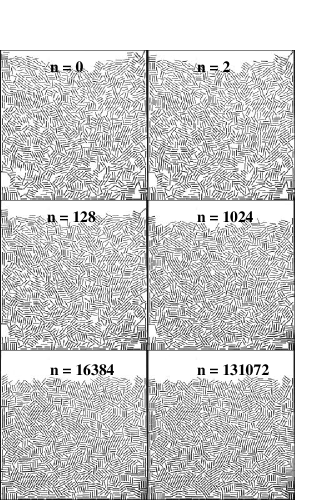
We do not observe a preferential orientation of the grains along the vertical sides or along the horizontal bottom wall. Indeed, the aspect ratio of the grains is too small to observe a preferred horizontal orientation as reported in prolatePacking . Moreover, the ratio between the pile width and the grain length is too large to observe a preferred vertical orientation as reported in rods . In our experimental configuration, we observe only local angular organization due to neighbouring grains oriented along their long axis.
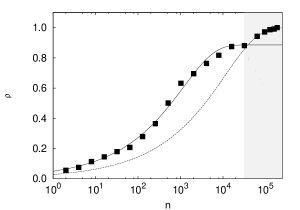
V Compaction curves
The evolution of the normalized packing fraction as a function of the tap number is presented in Figure 6. The normalized evolution is quite reproducible. We observe a change of the compaction dynamics in the experimental compaction curve above , i.e. after taps. Such a jump in the packing fraction evolution has been reported in earlier 3D experiments rods as quoted in the introduction. This effect was not observed in the case of sphere packings. Two compaction processes seems to occur at different stages. The first stage and the second stage of the compaction curve are well fitted by two independent “Avrami laws” (8) proposed in our earlier work LumayVandewalle2 with the exponents and characteristic times , . is has been fixed to 0.75. The characteristic time of the second stage of the compaction process is ten times larger than the characteristic time of the first stage. Therefore, the dynamics of the second stage is very slow in comparison with the first stage dynamics. Furthermore, the Avrami exponents are superior to 0.5. This can be explained by the existence of a favoured direction for the displacement of the grains. The presence of two stages can be understood as follows. In the first stage, the compaction is essentially due to fast spatial reorganisations (translations) of the grains. The second stage corresponds to slow orientational reorganisations (rotations) of the grains. This interpretation could be guessed in the snapshots of Figure 5 and this will be confirmed by both microscopic and mesoscopic studies in the next sections.
.
VI Grain organization
The aim of this section is to study the formation and the growth of mesoscopic structures, i.e. domains made of grains ideally packed. We attempt to relate this growth mechanism to the compaction dynamics.
For spherical particles in a 2D system LumayVandewalle2 , the only one ideal packing is the hexagonal compact arrangement. The corresponding packing fraction for 2D pile is . For cylindrical particles, the ideal packing could be reached using various structures. In Figure 7, many different organizations of anisotropic () grains lead to the unique ideal packing fraction . Beside two trivial configurations (Fig 7a and Fig 7b) in which grains are perfectly aligned, the ideal packing fraction is reached when domains of aligned grains are formed and well arranged. Therefore, anisotropic particles have to search for one among many ideal arrangement in a more complex way than spherical particles. In this respect, the grain anisotropy is an important parameter when looking at compaction. However, a study of compaction for different values is outside the scope of this paper.

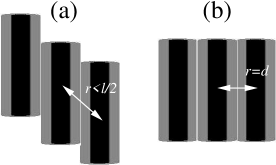
Let us study the grain organization in the packing. We define two fractions of ordered grains : the fraction of aligned grains (Figure 8a) and the fraction of ideally ordered grains (Figure 8b). The second type of grain ordering forms blocks. In order to measure these fractions, we use a simple criterion. For each grain in the pile, we search for its nearest neighbours. If at least one neighbour has the same orientation and is distant of a half grain length (respectively distant of a grain diameter ) from the grain, it is considered to belong to an aligned domain (respectively ideally ordered domain). Finally, we obtain the number of grains aligned (respectively the number of grains ideally ordered). The fraction of grains aligned (respectively the fraction of grains ideally ordered ) is the ratio between the number of grains aligned (the number of grains ideally ordered ) and the total number of grains in the pile. One has and .
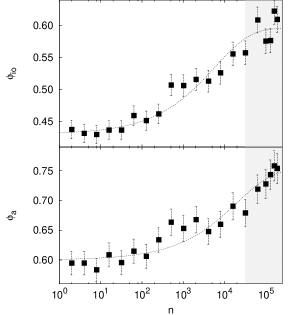
Figure 9 presents the fraction of aligned grains and the fraction of grains ideally ordered as a function of the number of taps . The error bars correspond to the standard deviation observed when we repeat the experiment many times. The fluctuations of both fractions and do not come from measurement imprecisions, but from natural fluctuations in the system. Both fractions increase with , meaning that domains form and grow during compaction. Since the ideal ordering is more restrictive than grain alignment, is always below . Both experimental data are well fitted by the Avrami law avrami . One has
| (13) |
and
| (14) |
The experimental data is fitted by these equations with an exponent fixed to 0.75 (i.e. the value obtained with the fit of the compaction curve) and with characteristic times and . The initial fractions are and . The final fractions are given by the fit and respectively. It is remarkable that the long time is similar to the long relaxation time obtained in density curves.
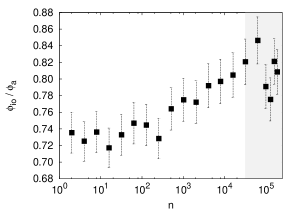
The ratio between both fractions (Figure 10) allow us to measure the proportion of grains ideally ordered. During the first stage of compaction (for ), this ratio increases with the tap number . This increase could be interpreted as follows. At the beginning of the process, the domains are formed of aligned grains (Figure 8a). Afterwards, the domains are sheared to form domains ideally ordered (Figure 8b). During the second stage of compaction (for ), the ratio start to fluctuate. Indeed, both fractions and are close to the saturation.
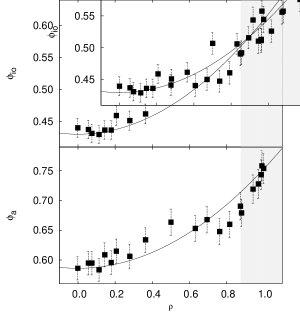
Figure 11 presents both fractions of grains aligned and fraction of grains ideally ordered as a function of the normalized packing fraction . Of course, both fractions increase with the packing fraction. The growth seems to be parabolic as in our previous work LumayVandewalle2 . Indeed, in two dimensions, the growth of the packing fraction is related to the slow diffusion of domain boundaries. Data on Figure 11 is fitted with such a parabolic law.
VII Grain mobilities
In this section, local displacements are studied during the compaction process. Since all grain positions are recorded, it is possible to measure the vertical displacement , the horizontal displacement and the angle variation of each grain after a single tap or after a series of taps. A dimensionless average translational mobility can be defined from the ratio between particle displacements and the length of the cylinders . One has
| (15) |
During the compaction process, grains also experience rotations. A dimensionless average rotational mobility can also be defined from the ratio between particle extremity displacements and the length of the cylinders . One has
| (16) |
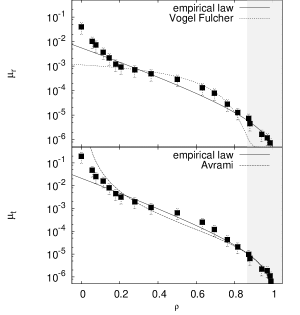
Figure 12 presents the decrease of the translational and the rotational mobilities and as a function of the normalized packing fraction . The shape of the two curves is similar. In order to avoid a surcharge of the figure we do not fit both mobilities by the laws Eq. (4), (9) and (10). Both mobilities are fitted by the empirical law. One has
| (17) |
and
| (18) |
where and are the initial translational and rotational mobilities respectively. Caging parameters and are the decaying rates of both mobilities. The decrease of the rotational mobility is also fitted by the Voguel-Fulcher law Eq. (4) and the translational mobility is also fitted by the the Avrami law Eq. (9). The shape of the curve is quite well fitted by the Avrami law.
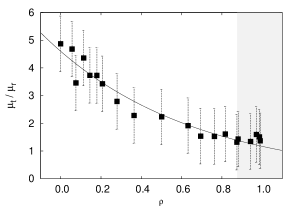
The ratio between the translational and the rotational mobilities as a function the normalized packing fraction is presented in figure 13. For low densities (), the compaction is mainly related to translational moves. For high packing fraction, the proportion of rotational moves increases. This transition (translational to rotational moves) could explain the change of dynamics compaction observed in the compaction cureve (Figure 6).
VIII Conclusion
In summary, we have measured three physical quantities during the granular compaction of cylindrical particles. They correspond to three different scales in the system. At the macroscopic scale, we have observed two stages during the compaction process. Both stages could be fitted by the “Avrami law” LumayVandewalle2 . The presence of two dynamical stages could be explained by the mesoscopic and by the microscopic analysis. At the mesoscopic scale, we have observed the formation and the grow of domains made of aligned grains. Our experiments suggest that after formation, such domains are sheared to order ideally. At the microscopic point of view, the measurements of both translational and rotational mobilities reveal that the beginning of the compaction process is essentially related to translational motion of the grains. At the late stages of compaction, the grain rotations are more pronounced and drive the process. Therefore, the first stage corresponds to a fast spatial reorganisation of the grains to forms domains of aligned grains. The second stage corresponds to a slow orientational reorganisation of the grains to form domains of ideally ordered grains.
IX Acknowledgements
This work has been supported by the contract ARC 02/07-293. The authors thank C. Becco, S. Dorbolo, H. Caps, E. Clément, F. Ludewig an P. Richard for valuable discussions.
References
- (1) P. G. de Gennes, Rev. Mod. Phys. 71, S374 (1999)
- (2) H. M. Jaeger, S. R. Nagel and R. P. Behringer, Rev Mod Phys, 68, 1259 (1996)
- (3) J. Duran, Sables, poudres et grains (Eyrolles Sciences, Paris, 1999)
- (4) A. Kudrolli, Rep. Prog. Phys. 67, 209 (2004)
- (5) F. Ludewig and N. Vandewalle, EPJE 18, 367 (2005)
- (6) A. Coniglio, A. Fierro, H. Herrmann and M. Nicodemi, Unifying concepts in granular media and glasses (Elsevier,2004)
- (7) P.N. Pusey and W. van Megen, Nature 320, 340 (1986)
- (8) E. R. Nowak, J. B. Knight, E. Ben-Naim, H. M. Jaeger, and S. R. Nagel, Phys. Rev. E 57, 1971 (1998)
- (9) J. B. Knight, C. G. Fandrich, Chun Ning Lau, H. M. Jaeger, and S. R. Nagel, Phys. Rev. E 51, 3957 (1995)
- (10) P. Richard, M. Nicodemi, R. Delannay, P. Ribière, and D. Bideau, Nature Materials 4, 121 (2005)
- (11) P. Philippe, and D. Bidau, Europhys. Lett. 60, 677 (2002)
- (12) G. Lumay and N. Vandewalle, Phys. Rev. Lett. 95, 028002 (2005)
- (13) E. Caglioti, V. Loreto, H.J. Herrmann and M. Nicodemi, Phys. Rev. Lett. 79, 1575 (1997)
- (14) F. Ludewig, S. Dorbolo and N. Vandewalle, Phys. Rev. E 70, 051304 (2004)
- (15) E. Ben-Naim, J. B. Knight, E. R. Nowak, H. M. Jaeger, and S. R. Nagel, Physica D 123, 380 (1998)
- (16) T. Boutreux and P.G. de Gennes, Physica A 244, 59 (1997)
- (17) Y. Levin, J.J. Arenzon and M. Sellitto, EuroPhys. Lett. 55, 767 (2001)
- (18) J.J. Arenzon, Y. Levin and M. Sellitto, Physica A 325, 371 (2003)
- (19) K. L. Gavrilov, Phys. Rev. E 58, 2107 (1998).
- (20) D.L. Blair, T. Neicu, and A. Kudrolli, Phys. Rev. E 67, 031303 (2003)
- (21) G. Lumay and N. Vandewalle, Powders & Grains 2005
- (22) F. Ludewig, N. Vandewalle and S. Dorbolo, Gran. Mat. 8, In press (2006)
- (23) G. Lumay and N. Vandewalle, Phys. Rev. E 70, 051314 (2004)
- (24) P. Ribière, P. Richard, R. Delannay and D. Bideau, Phys. Rev. E 71, 011304 (2005)
- (25) F. X. Villarruel, B. E. Lauderdale, D. M. Mueth, and H. M. Jaeger, Phys. Rev. E 61, 6914 (2000)
- (26) K. Stokely, A. Diacou, and Scott V. Franklin, Phys. Rev. E 67, 051302 (2003)
- (27) A.P. Philipse and A. Verberkmoes, Physica A 235, 186 (1997)
- (28) S.R. Williams and A.P. Philipse, Phys. Rev. E 67, 051301 (2003)
- (29) P. Philippe, Etude théorique et expérimentale de la densification des milieux granulaires, PhD thesis, Université de Rennes 1, (2002)
- (30) M. Avrami, J. Chem. Phys. 7, 1103-1112 (1939); M. Avrami, J. Chem. Phys. 8, 212 (1940).