Evolution of Superconductivity in Electron-Doped Cuprates: Magneto-Raman Spectroscopy
Abstract
The electron-doped cuprates Pr2-xCexCuO4-δ (PCCO) and Nd2-xCexCuO4-δ (NCCO) have been studied by electronic Raman spectroscopy across the entire region of the superconducting (SC) phase diagram. The SC pairing strength is found to be consistent with a weak-coupling regime except in the under-doped region where we observe an in-gap collective mode at while the maximum amplitude of the SC gap is . In the normal state, doped carriers divide into coherent quasi-particles (QPs) and carriers that remain incoherent. The coherent QPs mainly reside in the vicinity of (, ) regions of the Brillouin zone (BZ). We find that only coherent QPs contribute to the superfluid density in the channel. The persistence of SC coherence peaks in the channel for all dopings implies that superconductivity is mainly governed by interactions between the hole-like coherent QPs in the vicinity of (, ) regions of the BZ. We establish that superconductivity in the electron-doped cuprates occurs primarily due to pairing and condensation of hole-like carriers. We have also studied the excitations across the SC gap by Raman spectroscopy as a function of temperature () and magnetic field () for several different cerium dopings (). Effective upper critical field lines at which the superfluid stiffness vanishes and at which the SC gap amplitude is suppressed by field have been determined; is larger than for all doping concentrations. The difference between the two quantities suggests the presence of phase fluctuations that increase for . It is found that the magnetic field suppresses the magnitude of the SC gap linearly at surprisingly small fields.
pacs:
74.25.Gz, 74.72.Jt, 78.30.-jI Introduction
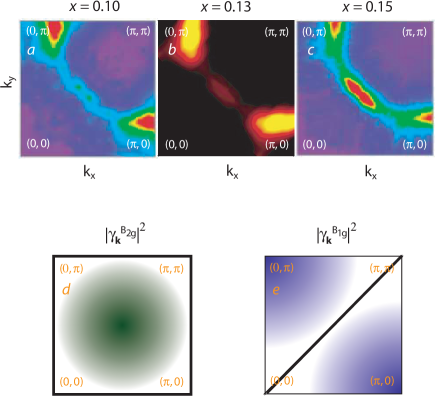
The electron doped (n-doped) superconducting (SC) cuprates are an important component in the puzzle of high superconductivity. There is evidence from transport measurements for both electron-like and hole-like carriers in the n-doped cuprates Pr2-xCexCuO4-δ (PCCO) and Nd2-xCexCuO4-δ (NCCO) for Ce dopings in the vicinity of .ongtwocarrier ; wujiang ; patrickprl ; patrickprb97 ; gollnik ; yoram Subsequently, angle-resolved photoemission spectroscopy (ARPES) data (Fig. 1a-c) show that well-defined electron-like Fermi surface (FS) pockets exist near the (, ) and (, ) regions of the Brillouin zone (BZ) for Ce dopings of . For , ARPES intensity map reveals emergence of a hole-like FS around (, ) regions of the BZ which spectral weight increases for .Armitage:2002 ; NCCOARPES The Ce doping at which the onset of the superconductivity in the under-doped side of the phase diagram is observed approximately coincides with the appearance of the hole-like FS seen by ARPES. However, the question of whether one or both, electron- and hole-like carriers are responsible for the superconductivity has remained unresolved. Despite the fact that conduction and superconductivity occur in the copper-oxygen planes in both the n-doped and hole-doped (p-doped) cuprates, there are lingering differences in properties between the two types of cuprates that require further investigation if one is to arrive at a comprehensive and unified understanding of the electronic properties of these materials.
While the magnitude and symmetry of the SC order parameter (or SC gap) have been thoroughly studied and understood in the p-doped cuprates,Harlingen ; kirtleyreview ; kirtley similar studies have yet to reach a consensus in the optimally-doped n-doped counterparts. Moreover, there is disagreement among the experiments that have studied the doping dependence of the SC order parameter and superfluid density in the n-doped cuprates.Amlan ; skinta1 ; skinta2 ; prozorov2 ; josephjunc As far as the distribution of doped carriers is concerned, ARPES at optimal doping above indicates the presence of defined quasi-particles (QPs) and ill-defined incoherent background.Armitage:2002 ; claesson However, there is a lack of clear understanding of the relationship between the coherence properties of introduced carriers and development of the SC order parameter with doping.
Enhanced temperatures and magnetic fields are known to be detrimental to superconductivity. The effect of temperature on the SC order parameter and superfluid density in the high- cuprate superconductors is extensively documented. However, the influence of magnetic field on these SC properties at temperatures well below has rarely been investigated spectroscopically, especially for -doped cuprates. Most studies on the -doped cuprates have concentrated on the effect of magnetic field on transport properties.ongtwocarrier ; wujiang ; patrickprl ; patrickprb97 ; gollnik ; yoram ; Maple ; Ong ; taillefer ; hamzanernst ; patrick On the theoretical side, researchers have mainly focused on explaining the effects of temperature on SC properties.Hirschfeld ; Maki Spectroscopic experiments, as well as theoretical frameworks are necessary for understanding fundamental properties of high- superconductors in magnetic fields. These properties are also critical to SC applications.
Here we report a systematic low energy electronic Raman spectroscopy study of Pr2-xCexCuO4-δ (PCCO) and Nd2-xCexCuO4-δ (NCCO) single crystals and films with different cerium dopings covering the entire SC region of the phase diagram and determine the magnitude of the order parameter as a function of doping. We find that the -doped cuprates are in the -wave weak-coupling regime for Ce dopings greater than or equal to optimal doping. The under-doped sample is in the strong-coupling regime and we observe an in-gap collective mode due to strong final state interactions. We establish that the pairing of coherent hole-like carriers near (, ) regions of the BZ leads to superconductivity in the -doped cuprates. We also compare the coherent part of the “Raman conductivities” (Refs.Sriram ; BlumbergRamanDrude ) above and below . We show that a weighted superfluid density can be extracted from the SC coherence peaks normalized to the frequency shifts. We find that only coherent QPs contribute to the superfluid density. Moreover, we study the influence of magnetic field and temperature on quasi-particle excitations across the SC gap directly by a spectroscopic method. We plot the variation of the SC gap and weighted superfluid density as a function of field. We also extract upper critical field lines at which the superfluid stiffness vanishes and at which the SC amplitude is suppressed by the field. We find a rapid linear suppression of the SC gap with field.
II Experimental Methods
Raman scattering was performed from natural surfaces of single crystals and films of PCCO and single crystals of NCCO. Crystals with different Ce dopings were grown using a flux method.JPeng After growth, the crystals were annealed in an Ar-rich atmosphere to induce superconductivity. The SC transitions were measured by a SQUID magnetometer. The Ce concentration of the crystals was measured with x-ray wavelength dispersion spectroscopy. C-axis oriented PCCO films were grown on strontium titanate substrates using pulsed laser deposition.Maiser ; Peng The films were grown to a thickness of about 0.8 to 1 m to minimize the substrate contribution to the Raman signal. The SC transitions were measured by ac susceptibility. Rutherford Backscattering on the films reveals that these thick films are epitaxial and highly oriented. The films provide an opportunity to study the extremes of the SC phase because of better control of Ce doping in under-doped and highly over-doped samples.Maiser ; Peng Numerous previous studies have established that the phase diagram, crystal structure and electronic properties of PCCO and NCCO are very similar.
The samples were mounted in an optical continuous helium flow cryostat. The study of polarization dependence of the Raman spectra in zero magnetic field was performed in the pseudo-backscattering geometry with linearly polarized 647 nm and 799 nm excitations from a Kr+ laser. Incident laser powers between 0.5 and 4 mW were focused to a m spot on the sample surface. For measurements in magnetic field, the samples were mounted in an optical continuous helium flow cryostat which was inserted into the bore of a superconducting magnet. The magnetic field was applied normal to the ab plane of the samples (i.e. along the -axis of the samples). Raman spectra were measured in a direct backscattering geometry with an incident wavelength of 647 nm. Incident laser powers between 0.5 and 1 mW were focused to a 50 m diameter spot on the sample surface. The measurements in magnetic field were performed with circularly polarized light. The spectra displayed in this manuscript were measured at temperatures between 4 and 30 K by a custom triple grating spectrometer and the data were corrected for instrumental spectral response. The sample temperatures quoted in this work have been corrected for laser heating.
III Raman scattering symmetries
The polarization directions of the incident, ei, and scattered, es, photons are indicated by (eies) with , , , , and . The data were obtained in , , , and scattering geometries. For the tetragonal symmetry of the n-doped cuprates, these geometries correspond to +, + +, + and + representations. Using circularly polarized light we confirmed that the contribution to the channel is very weak for both PCCO and NCCO. The spectra in scattering geometry were subtracted from the spectra in the scattering geometry to obtain the Raman response.
The electronic Raman response function, , for a given polarization geometry (eies) is proportional to the sum over the density of states at the FS weighted by the square of the momentum (k) dependent Raman vertex .Dierker ; Hackl ; Klein ; Devereaux1 Because the scattering geometries selectively discriminate between different regions of the FS, electronic Raman spectroscopy provides information about both the magnitude and the k dependence of the SC OP. In the effective mass approximation and where and are nearest and next-nearest neighbor hopping integrals in the tight-binding model. For the channel, the Raman vertex is most sensitive to (, ) regions of the BZ and vanishes along (0, 0)(, 0) and equivalent lines. For the channel, nodal (0, 0)(, ) diagonals do not contribute to the intensity that mainly integrates from regions near intersections of the FS and the BZ boundary. The pictorial representations of the and channels are shown in Fig. 1d,e. On comparison with ARPES data, one can see that the scattering channel probes the hole-like pockets in the vicinity of the (, ) regions of the BZ while Raman intensity in the channel originates from the electron-like FS near the (, ) and (, ) regions of the BZ. The unscreened Raman response in channel does not have symmetry imposed nodal lines and measures an overall average throughout the BZ. However, the full symmetric response is expected to be screened by Coulomb interaction induced charge backflow that redistributes and strongly suppresses the spectral intensity. The screening is expected to be weaker if the Raman vertex is rapidly changing with wavevector.Devereaux96
IV Doping and Polarization Dependence
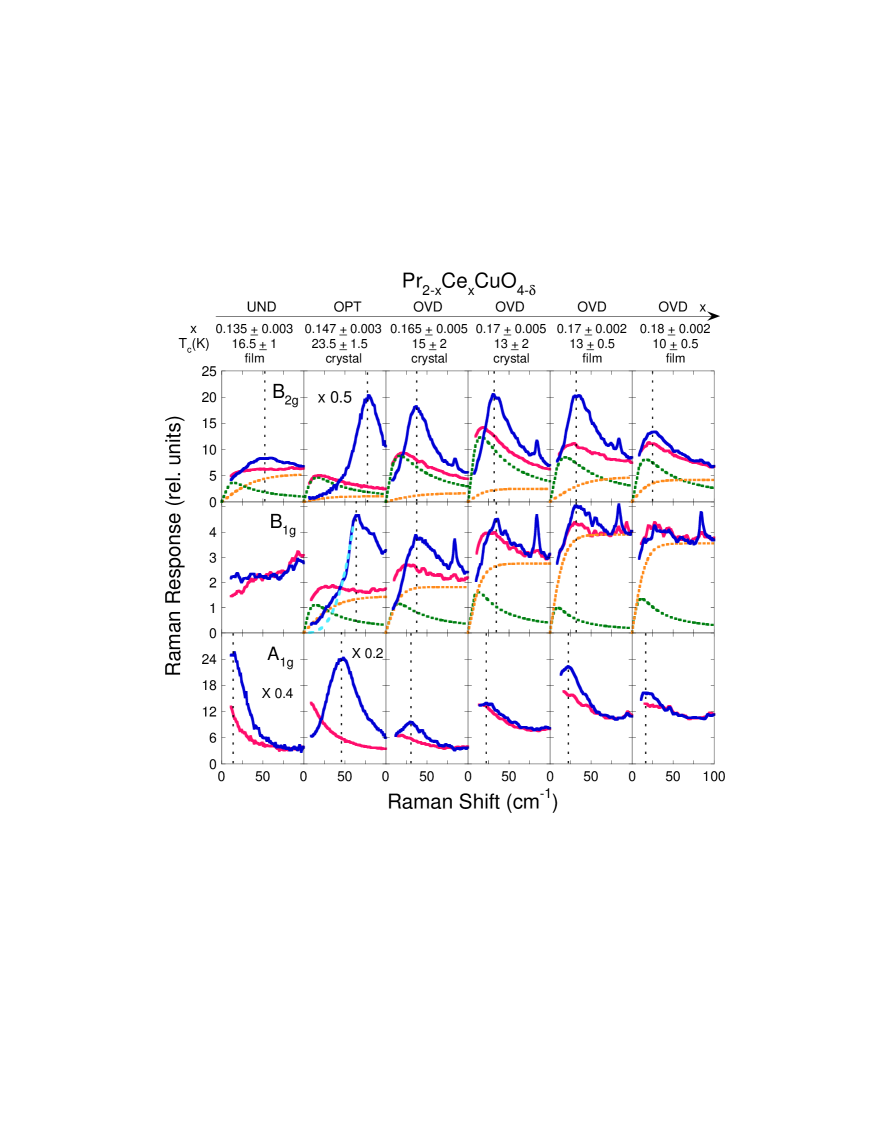
In Fig. 2 we show doping dependence of the low energy electronic Raman response of PCCO single crystals and films. One can see that the Raman scattering intensity is significantly stronger in the than in the channel for all Ce concentrations. This is only partly due to resonance resulting from inter-band transitions.BlumbergNCCO More importantly, it underlines the significance of next-nearest neighbor hopping in n-doped cuprates and is in contrast with p-doped cuprates where the response in the channel is generally weaker than in .Liu Coulomb screening should lead to a much weaker Raman response in the fully symmetric channel. However, we find that the intensities in the channel are of the same order of magnitude as those in the non-symmetric and channels in the over-doped samples and are significantly stronger in the under- and optimally-doped samples. This lack of screening is possible if the effective mass on the FS changes sign.Cardona This is the case in the electron-doped cuprates where strong evidence exists for both electron- and hole-like carriers.ongtwocarrier ; wujiang ; patrickprl ; yoram ; Armitage:2002 ; NCCOARPES
We decompose the Raman response in the normal state into two parts, a featureless continuum and a low-frequency quasi-elastic scattering peak (QEP):
| (1) |
The QEP response
| (2) |
is described in a Drude model as QP contribution from doped carriersBlumbergRamanDrude ; Andreas while the featureless continuum
| (3) |
represents a collective incoherent response.Varma Symmetry dependent and parameters control the spectral weight in these coherent and incoherent channels, is a cut-off frequency of order (Ref.Varma ) and the QEP position is the Drude scattering rate that at low temperatures is about 2 meV for the entire doping range studied. The Drude part describes the relaxation dynamics of the QPs that results from electron-electron interactions and is therefore strongly temperature dependentAndreas in contrast to scattering from impurities which is expected to be independent of temperature. This deconvolution of the Raman response into two components presented here is consistent with the ARPES data that displays defined QPs as well as ill-defined excitations in different parts of the FS.Armitage:2002 ; claesson One can observe from the deconvolution that the Raman response in the channel is dominated by the QP (Drude) response while the channel is dominated by the incoherent continuum.films The well-defined hole-like QP states reside mainly in the vicinity of the (, ) regions of the BZ. The evolution of the integrated QP spectral weight of the “Raman conductivity” (Refs.Sriram ; BlumbergRamanDrude )
| (4) |
as a function of Ce doping is shown in Fig. 4(c). While on the under-doped side, exhibits the expected increase proportional to , the integrated coherent contribution saturates above optimal doping . At higher Ce doping, additional carriers contribute mainly to the electron-like incoherent response and can be observed as an increasing intensity of the featureless Raman continuum , particularly in the channel.
V Pair breaking excitations
In the SC state, the strength of the low-frequency intensity in the normal state is reduced and the spectral weight moves to the coherence peak resulting from excitations out of the SC condensate. In the and channels, the “pair-breaking” SC coherence peaks appear for all dopings while in the channel these SC coherence peaks are negligibly weak in the under- and the most over-doped films. For the optimally-doped crystal (Tc = 23.5 K), the SC coherence peak energy is larger in the channel compared with that in , and for all channels it is larger than the scattering rate obtained from the spectra in the normal state. The intensity below the SC coherence peaks vanishes smoothly without a threshold to the lowest frequency measured. The absence of a threshold that has been observed in -wave superconductors precludes interpretation in terms of a fully gapped FS.Dierker ; Hackl The smooth decrease in the Raman response below the SC coherence peak is consistent with nodes in the gap. We compare the low-frequency tail in the response (Fig. 2) to an power law that is expected for a -wave superconductor in the clean limit.Devereaux2 The observed deviation from a cubic to a linear response at the lowest frequencies is an indication of low-energy QP scattering.Devereaux3 The data for optimally-doped PCCO is very similar to that for optimally-doped NCCO (see Fig. 3) which was interpreted in terms of a non-monotonic -wave order parameter with nodes along the (0, 0)(, ) diagonal and the maximum gap being closer to this diagonal than to the BZ boundaries.BlumbergNCCO Recent evidence from ARPES that the SC gap maximum is located closer to the nodal direction in optimally doped samples confirms the interpretation of the Raman data. Takahashi
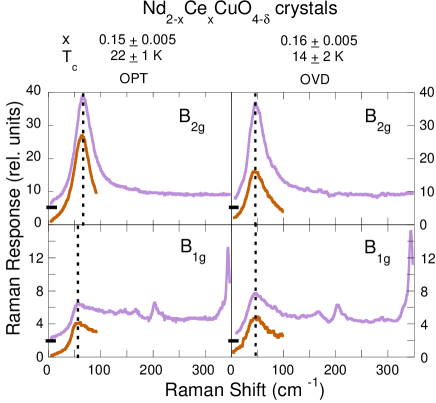
Interestingly, in the over-doped PCCO samples (Fig. 2) and over-doped NCCO crystal (Fig. 3), the SC coherence peak positions are at the same energies for both the and channels. The peak positions and intensities decrease in the over-doped regime compared to the optimally-doped samples. Moreover, the peak energies are similar to indicating that superconductivity is departing from the clean limit.Devereaux3 The Raman response below the SC coherence peaks vanishes smoothly and no well-defined threshold is observed. The data for the 799 nm excitation is measured down to 4.5 cm-1 and shows no obvious sub-gap threshold. The peak positions and the sub-gap Raman response in the NCCO crystals are almost independent of the laser excitation energies (Fig. 3). Similar symmetry independent “pair-breaking” peak energies with continuously decreasing Raman scattering intensity down to low frequencies have been observed in the Raman spectra in over-doped samples of p-doped Bi-2212.kendziora ; hacklSPIE ; tajima The Raman data presented in Figs. 2-3 for over- n-doped samples is similar to the Raman data for over-doped Bi-2212. The coincidence of coherence peak energies in the and channels may be caused by enhanced QP scattering,Devereaux3 although this remains an open question. Nevertheless, the smooth and continuous decrease in Raman intensity below the coherence peak is consistent with a nodal gap structure.prozorov2 ; josephjunc
In Fig. 4(a) we show that the SC coherence peak energy (2) has a pronounced maximum at optimal doping. For comparison, we include the value of twice the SC gap energy obtained from point contact tunneling spectroscopy.Amlan ; Qazilbash For optimally- and over-doped samples the maximum values of the Raman SC coherence peak energies are very similar to the single particle spectroscopy gap values and can therefore be associated with twice the SC gap magnitude. This is not the case for under-doped samples where the tunneling spectroscopy data exhibits a gap (2) that is larger than the Raman SC coherence peak energy of 52 cm-1 ( 6.4 meV). The normalized tunneling gap value in Fig. 4b suggests that the under-doped n-doped cuprates are in the strong coupling regime. Therefore, in under-doped samples the two QPs excited out of the SC condensate by Raman processes continue to interact, binding into a collective excitonic state that costs less energy than excitation of two independent QPs. The SC coherence peak in the channel in the under-doped sample is actually an in-gap collective mode. Similar observations were made previously in the p-doped cuprates in the channel.Liu ; Blumberg:97 ; Blumberg:98 The significance of final state interactions in the formation of a collective mode in under-doped -doped cuprates has been demonstrated in Refs. BardasisSchrieffer:61 ; Chubukov:99 ; Chubukov:05 The important difference here is that in the -doped cuprates the collective mode appears in the channel.
We note for the sample the first appearance of the SC coherence peak in the channel coincides with the appearance of a hole-like FS near the (, ) regions of the BZ as viewed by ARPES (see Fig. 1b and Ref.NCCOARPES ) while the response in the channel does not show any comparable signatures of superconductivity. These observations relate superconductivity to the appearance of the hole-like FS. The electron-like carriers that are clearly present near the (, ) and (, ) regions of the FS do not show contribution to superconducting pairing. When Ce doping is increased to , ARPES data shows that the electron pocket persists and the excitations around hole-like FS acquires more coherent spectral weight.Armitage:2002 Well-defined SC coherence peaks appear in both and channels with the peak energy about twenty percent higher in the channel. One can infer that for optimal doping the superconductivity exists in both hole and electron bands but the gap is larger in the hole channel. For over-doped samples, it is likely that the FS is hole-like and centered at (, ) points. The evolutionary trend of the FS with doping in the ARPES data supports this view though ARPES data on over-doped samples is still lacking. The situation may be more complicated because there is evidence from Hall effect data that both hole-like and electron-like carriers exist even for over-doped samples with .patrickprl ; yoram Nevertheless, hole-like carriers dominate the low temperature Hall effect data for dopings . Therefore, one can hypothesize that in the over-doped samples, condensation of hole-like carriers is primarily responsible for the SC coherence peaks in all Raman scattering symmetries.
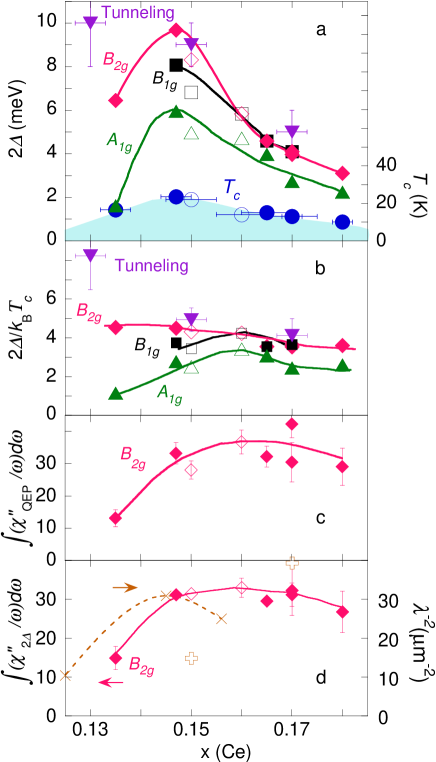
Reduced energies of the Raman SC coherence peaks, , are plotted in Fig. 4b as a function of doping. For the channel that exhibits the highest ratio, , the values fall between 4.5 for the optimally-doped samples and 3.5 for the most over-doped samples. These ratios are consistent with those inferred from electron tunneling and infrared reflectivity measurements,Amlan ; Qazilbash ; zimmers and within the prediction of the mean-field BCS values for d-wave superconductors.Maki . The coherence peak energy remains below for the channel and is even lower for the channel. The reduced energies for all the channels are lower than for p-doped materialsLiu ; Blumberg:97 ; Blumberg:98 ; Kendziora:95 suggesting a -wave BCS weak coupling limit in the n-doped cuprates for optimally- and over-doped samples.
VI Raman sum-rule
In Fig. 4(d) we plot the integrated reduced coherence peak intensity in the SC state,
| (5) |
where is the SC coherence response with the incoherent continuum subtracted. The details of the analysis are given in the appendix. For the non-symmetric channels in limit
| (6) |
is proportional to the superfluid density
| (7) |
weighted by the square of the Raman coupling vertex.muzikar ; Maki Here is the QP dispersion in the SC state and is the SC gap. The superfluid densities () obtained from penetration depth () measurementsskinta1 ; prozorov2 are plotted in Fig. 4(d) for comparisonresonance . We note that the values of the integrated reduced coherence intensities in the channel do not change from the normal to SC state (Fig. 4c and d) demonstrating a partial sum rule similar to the Ferrell-Glover-Tinkham sum-rule in optics. Also, the equality implies that only Drude QPs control the superfluid density and that the electron-like incoherent carriers doped above optimal doping do not contribute to the superfluid stiffness.
Certain aspects of the observations in the preceding paragraph need further comment. For conventional superconductors that are Fermi liquids above , theory does not predict a partial sum-rule for low energy Raman scattering connecting the normal and SC states akin to the Ferrell-Glover-Tinkham sum-rule in optics. However, we have experimentally demonstrated the existence of a partial Raman sum-rule at low energies in the normal and SC states for the -doped cuprates. The question of whether this partial sum-rule is limited to the -doped cuprates or is more generic encompassing -doped cuprates as well can be decided by a similar analysis of the Raman data that exists for several families of -doped cuprates.
VII Effects of temperature and magnetic field
Circularly polarized light in the right-left (RL) scattering geometry was used for the data displayed in this section. For the tetragonal symmetry, this geometry corresponds to the sum of + representations. It has been shown in previous Raman measurements that for 647 nm incident laser light the scattering in the channel is resonantly enhanced and is about an order of magnitude greater than scattering intensity in the channel.BlumbergNCCO Therefore, the channel dominates the spectra for right-left polarization.
To recap, the QP excitations across the SC gap lead to a pair-breaking 2 coherence peak close to twice the gap energy. The 2 peak is a measure of the magnitude of the SC order parameter for optimally- and over-doped samples, while the integrated intensity of the reduced 2 coherence peak
| (8) |
is related to the superfluid density . This is the framework that forms a basis for analysis of the Raman data in this section.
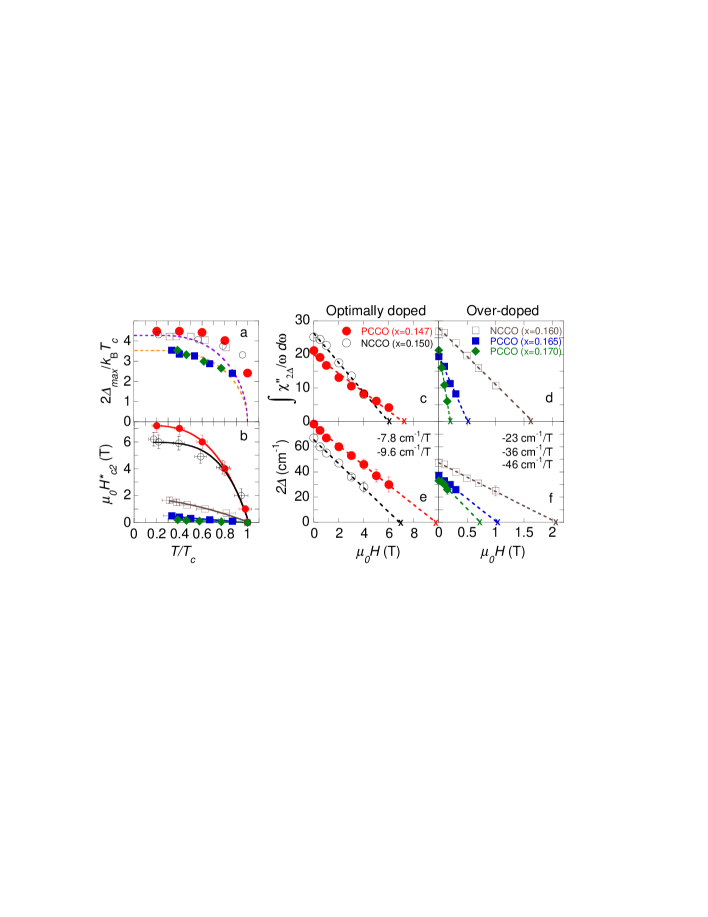
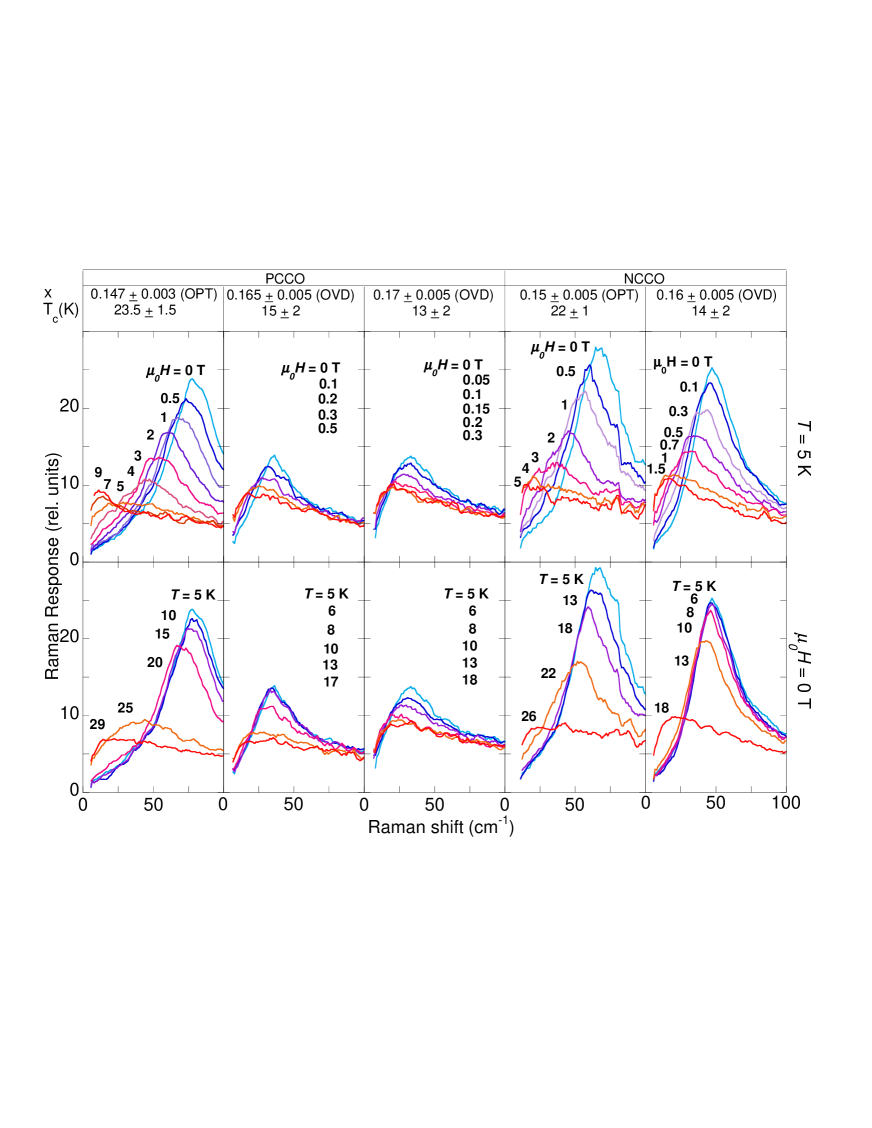
Fig. 5 exhibits the field and temperature dependence of the SC coherence peak at the maximum gap value (2) for the optimally-doped () and over-doped () PCCO and NCCO crystals. The coherence peak loses intensity and moves to lower energies by either increasing the temperature or magnetic field. We define an effective upper critical field, , as the field that completely suppresses the coherence peak intensity: the Raman response remains field independent for . Above or the SC coherence peak vanishes and the Raman response acquires a low-frequency QEP. The non-SC response is similar for both cases: and at the lowest temperature, and therefore is independent of the means used to quench superconductivity. As discussed previously, the Raman response in the normal state can be described by a QEP Drude response of doped QP carriers above an incoherent featureless continuum, eqs. (1-3). At low temperatures meV for the entire studied doping range.
Reduced gap values, 2, from Raman data in zero field on five single crystals of various doping levels are plotted in Fig. 6a as a function of the reduced temperature (). For the lowest measured temperature, 2 values fall between 4.5 for the optimally doped crystals and 3.5 for the most over-doped PCCO crystals. For optimally doped samples, the gap appears to open up faster than the mean-field BCS predictionMaki as the temperature is reduced below suggesting phase fluctuations and a finite pairing amplitude above . The temperature dependence of the gap energy for the most over-doped samples is close to the prediction of BCS theory.d_vs_s
The mixed state consists of normal regions inside vortex cores coexisting with SC regions surrounding the vortices. The Raman response in a field, , is assumed to be a sum of contributions from the SC and normal regions. The normal state contribution to the measured Raman spectra is further assumed to be proportional to the number of vortices which itself is proportional to the applied field:
| (9) |
Here is the normal state Raman response at or above the critical field value . We extract the Raman response of the SC regions from the data using eq. (9). We then decompose into a low-frequency SC 2 coherence peak, , and a featureless continuum above the peak frequency. in eq. (9) is the estimate of the upper critical field at which the SC coherence peak vanishes in the raw data.
VIII Upper critical fields and superconducting coherence length
Estimates of for different temperatures and Ce concentrations are plotted vs. in Fig. 6b. displays negative curvature to the lowest measured temperature (5 K). saturates at low temperatures for samples near optimal doping. With increasing doping we observe a dramatic reduction of in the entire temperature range.
In Fig. 6c,d we plot for optimally- and over-doped crystals, the integrated coherence intensity at K, as a function of field. is proportional to the superfluid density weighted by the square of the Raman coupling vertex (eqs. (6)-(7)). In the panels Fig. 6e,f the coherence peak energy is displayed as a function of field at 5 K. It appears that both the superfluid stiffness and the SC gap magnitude show a monotonic almost linear decrease with field. We use a linear continuation to determine critical values of and that completely suppress the superfluid density and amplitude of the SC order parameter correspondingly. is thus determined self-consistently and agrees with our initial estimates based on the raw data. We find that the SC gap still remains open at a finite value at the effective critical fields . We find that the rate of gap suppression, , is strongly doping dependent: cm-1T-1 for the optimally doped crystal rapidly increases with doping to a surprisingly large cm-1T-1 for over-doped PCCO with .
These observations are in sharp contrast to -doped cuprates where the field induced suppression of the SC coherence peak intensity is not accompanied by any observable shift in the gap magnitude.BlumbergTl Moreover, these observations are also different from the weak shift of the SC mode energy with field in the Raman spectra on NbSe2, a BCS-type s-wave superconductor.Soory1 ; Soory2 The Doppler shift due to circulating supercurrents cannot explain the rapid suppression of the SC gap magnitude. The rate of change of the Zeeman energy with field is much less than the observed rate of gap magnitude suppression and can be ruled out as a cause of this suppression. A possible scenario for the rapid reduction of with doping is related to the non-monotonic -wave form of the SC gap in -doped cuprates for which the points of maximum gap amplitudes with opposite phase are close to each other in reciprocal space.BlumbergNCCO ; Takahashi In this situation, introduction of vortices leads to QP scattering between points of large gap amplitude with opposite phase which is self-damaging for the gap amplitude.
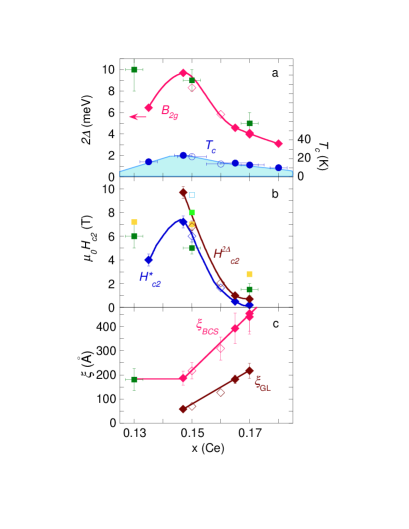
We turn to Fig. 7 where the upper critical fields, and , and the related Ginzburg-Landau SC coherence length ( is the fluxoid quantum) are plotted vs. Ce doping .underdoped The value of 7.2 0.5 T for the optimally doped PCCO crystal is in agreement with T determined by thermal conductivitytaillefer and specific heat measurements.hamza This value also agrees with the estimated by tunneling spectroscopy on optimally doped samples.Qazilbash ; alffprb ; alffnature Nernst effect measurements estimate T for optimally doped samples,Ong consistent with = 9.7 0.5 T. The SC phase coherence vanishes at a lower critical field while the pairing amplitude persists up to a higher field. This supports our earlier interpretation of the temperature dependence of the gap in terms of phase fluctuations above . With increasing doping, drops by an order of magnitude reducing to 0.7 T for the over-doped PCCO crystal.overdoped Correspondingly, rapidly increases with doping from 60 Å at optimal doping to 220 Å for PCCO.
We note that the value of optimally doped films from magneto-resistivity, using the full recovery of resistivity criterion,patrick is consistent with that obtained from Raman and thermodynamic measurements. However, for the over-doped film (x 0.17), (at 5 K) based on the appearance of resistancepatrick is consistent with from the Raman data on similarly doped crystals. This could mean that vortex flow physics, which plays a dominant role in cuprate superconductors with short coherence lengths, becomes less important in the over-doped -type cuprates with longer coherence lengths.tinkham ; footnote
In Fig. 7c we show that the values for are related to the SC gap. We compare here to the BCS coherence length , where the Fermi velocity m/s is estimated from ARPES measurementsARPES and the lowest temperature SC gap values are used from Raman and tunneling data.Qazilbash The comparison plot reveals that the trend resembles the doping dependence of and therefore confirms the relation of to the pairing potential . It also indicates that is still about two times lower and is about four times higher than expected for a conventional BCS superconductor with corresponding isotropic gap.
for the -doped cuprates is significantly larger than for their -doped counterparts and that leads to important differences. First, the size of the Cooper pair is larger than the average inter-particle spacing: ranges between 40 and 150, still smaller than for conventional BCS superconductors but an order of magnitude larger than for the -doped cuprates. Second, a larger Cooper pair size requires further pair interactions to be taken into account and leads to a more complicated non-monotonic momentum dependence of the SC gap rather than the simplest -wave form that well describes the gap function for -doped cuprates with very tight Cooper pairs.BlumbergNCCO ; Takahashi
IX Conclusions
The superconducting (SC) phase diagram of the electron-doped cuprates has been explored by Raman spectroscopy. The SC gap magnitudes in optimally- and over-doped samples are in agreement with the single particle spectroscopy measurements. The coupling decreases with increasing Ce concentrations from the strong-coupling regime for the under-doped sample to a weak-coupling at optimal doping and beyond. For the under-doped film, a collective mode in the Raman data in the SC state implies strong final state interactions. This collective mode appears in the channel in contrast to the p-doped cuprates where it appears in the channel. At this stage we can only stress the importance of this observation that has the potential of giving us an insight into the pairing mechanism in the SC state Chubukov:99 ; Chubukov:05 . The full ramifications of this observation deserve further contemplation and are deferred to a later publication.
The persistence of SC coherence peaks in the channel for all dopings implies that superconductivity is mainly governed by interactions in the vicinity of (, ) regions of the Brillouin zone (BZ). Moreover, the appearance of SC coherence as a collective mode in the channel in the under-doped sample () coincides with the appearance of hole-like carriers near (, ) regions of the BZ as seen by ARPES in under-doped NCCO.NCCOARPES For the sample with Ce doping , our Raman data shows that SC pairing first occurs primarily near the (, ) regions of the BZ where hole-like carriers reside while the more numerous electron-like carriers show no comparable sign of SC pairing in the channel. The presence of hole-like carriers near (, ) regions of the BZ appears to be vital for superconductivity in the electron-doped cuprates.
Well-defined SC coherence peaks in the channel occur for optimally-doped samples and this implies that the electron-like carriers near the (, ) and (, ) regions of the BZ are also gapped at this doping. Whether the pairing of electron-like carriers is driven by pairing of hole-like carriers or occurs independently is an important question that requires further investigation.
Low energy scattering below the SC coherence peak energies for all dopings and Raman symmetries is most likely due to nodal QPs and means that the SC gap has nodes on the Fermi surface. This is consistent with phase sensitive measurements that find the SC pairing symmetry to be predominantly .Tsuei ; josephjunc However, the order parameter is likely to be more complicated than monotonic BlumbergNCCO ; Takahashi ; luo given the occurrence of two-band superconductivity and long SC coherence lengths.
We have also carried out a systematic spectroscopic study of magnetic field and temperature dependence of the electron-doped cuprates in the SC state. We have plotted the field and temperature dependence of the SC gap magnitude and the integrated intensity of the reduced 2 coherence peaks for various electron concentrations. From the temperature and doping dependence of the SC coherence peak, we extract an effective upper critical field line at which the superfluid stiffness vanishes. The field dependence of the measured SC gap reveals an estimate of , an upper critical field at which the SC amplitude is completely suppressed by field. For optimally-doped samples, the field effectively suppresses the superfluid stiffness while the SC amplitude survives higher fields suggesting a phase fluctuation regime for these samples. We find that magnetic field applied parallel to the -axis linearly suppresses the SC gap magnitude at a rapid rate, a phenomenon different from observations in other type II superconductors in the clean limit.Soory1 ; Soory2 ; BlumbergTl This implies a novel pair-breaking mechanism for -doped cuprates in a magnetic field.
We find that the SC coherence length, , increases from 60 Å for optimal doping to 220 Å for the over-doped sample with K. There appears to be a doping-dependent crossover in physical properties associated with superconductivity: relatively robust SC pairing at optimal doping becomes tenuous in the over-doped regime where field suppresses the pairing potential at an anomalously large rate while still remains relatively high. We also find that carriers doped beyond optimal doping remain mainly incoherent and do not contribute to the Drude conductivity and superfluid density. This possibly explains the fragility of superconductivity in the over-doped regime of the electron-doped cuprates.
Acknowledgements
The authors thank B. Liang, Y. Dagan, V. N. Kulkarni, Z. Y. Li, C. P. Hill and M. Barr for assistance with preparation and characterization of samples. MMQ and RLG acknowledge support of NSF grants DMR 01-02350 and DMR 03-52735. CAK acknowledges support from ONR/NRL.
APPENDIX
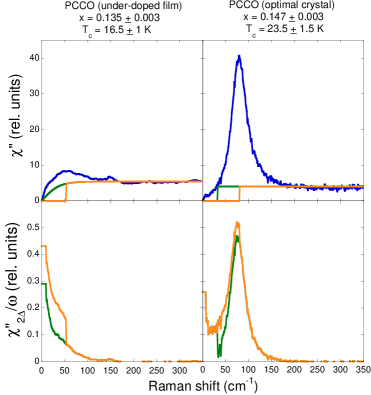
The panels in Fig. 8. show the main steps in the procedure for computing for two doping concentrations of PCCO, under-doped PCCO in the left column and optimally-doped PCCO in the right column. The measured Raman response in the SC state at lowest temperature is depicted by blue curves (at the lowest frequency, below 6 cm-1, the data is linearly extrapolated to 0 limit). The yellow and green curves in the upper two panels are the MFL continua based on two assumptions respectively: (i) that the continuum vanishes just below 2, and (ii) that it falls off at in the same way as it was derived from the fit to the data just above . In the case of the optimally-doped crystal, the scattering in the SC state falls off more rapidly at low frequencies than the continuum based on assumption (ii), and therefore the continuum is truncated at 30 cm-1. The two lower panels show after the continua are subtracted in two ways: yellow, using assumption (i) and green, for assumption (ii). The average of the areas under the two curves for each sample gives the value of the integrated intensity in the SC state and one-half the difference between the two areas was used as an estimate of the uncertainty. The same analysis was applied to the spectra from all other samples.
References
- (1) Corresponding author. E-mail: girsh@bell-labs.com
- (2) Permanent address: University of California at San Diego, La Jolla, CA 92093.
- (3) Permanent address: ISSMR, P.O. Box 270016, D-01171 Dresden, Germany.
- (4) Permanent address: Brookhaven National Laboratory, Upton, NY 11973.
- (5) Z. Z. Wang, T. R. Chien, N. P. Ong, J. M. Tarascon, and E. Wang, Phys. Rev. B 43, 3020 (1991).
- (6) W. Jiang, S. N. Mao, X. X. Xi, X. Jiang, J. L. Peng, C. J. Lobb, and R. L. Greene, Phys. Rev. Lett. 73, 1291 (1994).
- (7) P. Fournier et al., Phys. Rev. Lett. 81, 4720 (1998).
- (8) P. Fournier, X. Jiang, W. Jiang, S. N. Mao, T. Venkatesan, C. J. Lobb, and R. L. Greene, Rev. B 56, 14149 (1997).
- (9) F. Gollnik and M. Naito, Phys. Rev. B 58, 11734 (1998).
- (10) Y. Dagan, M. M. Qazilbash, C. P. Hill, V. N. Kulkarni, and R. L. Greene, Phys. Rev. Lett. 92, 167001 (2004).
- (11) N. P. Armitage et al., Phys. Rev. Lett. 88, 257001 (2002).
- (12) H. Matsui et al., Phys. Rev. Lett. 94, 047005 (2005).
- (13) D. van Harlingen, Rev. Mod. Phys. 67, 515 (1995).
- (14) C. C. Tsuei and J. R. Kirtley, Rev. Mod. Phys. 72, 969 (2000).
- (15) C. C. Tsuei, J. R. Kirtley, G. Hammerl, J. Mannhart, H. Raffy, and Z. Z. Li, Phys. Rev. Lett. 93, 187004 (2004).
- (16) A. Biswas, P. Fournier, M. M. Qazilbash, V. Smolyaninova, H. Balci, and R. L. Greene, Phys. Rev. Lett. 88, 207004 (2002).
- (17) J. A. Skinta, M. Kim, T. R. Lemberger, T. Greibe, and M. Naito, Phys. Rev. Lett. 88, 207005 (2002).
- (18) M. Kim, J. A. Skinta, T. R. Lemberger, A. Tsukada, and M. Naito, Phys. Rev. Lett. 91, 087001 (2003).
- (19) A. Snezhko, R. Prozorov, D. D. Lawrie, R.W. Giannetta, J. Gauthier, J. Renaud, and P. Fournier, Phys. Rev. Lett. 92, 157005 (2004).
- (20) Ariando, D. Darminto, H. -J. H. Smilde, V. Leca, D. H. A. Blank, H. Rogalla, and H. Hilgenkamp, Phys. Rev. Lett. 94, 167001 (2005).
- (21) T. Claesson, M. Mansson, C. Dallera, F. Venturini, C. De Nadai, N. B. Brookes, and O. Tjernberg, Phys. Rev. Lett. 93, 136402 (2004).
- (22) Y. Dalichaouch, B. W. Lee, C. L. Seaman, J. T. Markert, and M. B. Maple, Phys. Rev. Lett. 64, 599 (1990).
- (23) Y. Wang, S. Ono, Y. Onose, G. Gu, Y. Ando, Y. Tokura, S. Uchida, and N. P. Ong, Science 299, 86 (2003).
- (24) R. W. Hill, C. Proust , L. Taillefer, P. Fournier, and R. L. Greene, Nature 414, 711 (2001).
- (25) H. Balci, C. P. Hill, M. M. Qazilbash, and R. L. Greene, Phys. Rev. B 68, 054520 (2003).
- (26) P. Fournier and R. L. Greene, Phys. Rev B 68, 094507 (2003).
- (27) P. J. Hirschfeld and N. Goldenfeld, Phys. Rev. B 48, 4219 (1993).
- (28) H. Won and K. Maki, Phys. Rev. B 49, 1397 (1994).
- (29) B. S. Shastry and B. I. Shraiman, Phys. Rev. Lett. 65, 1068 (1990).
- (30) G. Blumberg and M. V. Klein, J of Low. Temp. Phys. 117, 1001 (1999).
- (31) J. L. Peng, Z. Y. Li, and R. L. Greene, Physica C 177, 79 (1991).
- (32) E. Maiser, P. Fournier, J. -L. Peng, F. M. Araujo-Moreira, T. Venkatesan, R. L. Greene and G. Czjzek, Physica C 297, 15 (1998).
- (33) J. L. Peng, E. Maiser, T. Venkatesan, R. L. Greene, G. Czjzek , Phys. Rev. B 55, R6145 (1997). Rev. Lett. 90, 149702 (2003).
- (34) S. B. Dierker, M. V. Klein, G. W. Webb, and Z. Fisk, Phys. Rev. Lett. 50, 853 (1983);
- (35) R. Hackl, R. Kaiser, and S. Schicktanz, J. Phys. C 16, 1729 (1983).
- (36) M. V. Klein and S. B. Dierker, Phys. Rev. B 29, 4976 (1984).
- (37) T. P. Devereaux and D. Einzel, Phys. Rev. B 51, 16336 (1995).
- (38) T. P. Devereaux, A. Virosztek, and A. Zawadowski, Phys. Rev. B 54, 12523 (1996).
- (39) G. Blumberg, A. Koitzsch, A. Gozar, B. S. Dennis, C. A. Kendziora, P. Fournier, and R. L. Greene, Phys. Rev. Lett. 88, 107002 (2002).
- (40) H. L. Liu, G. Blumberg, M. V. Klein, P. Guptasarma, and D. G. Hinks, Phys. Rev. Lett. 82, 3524 (1999).
- (41) T. Strohm and M. Cardona, Phys. Rev. B. 55, 12725 (1997).
- (42) A. Koitzsch, G. Blumberg, A. Gozar, B. S. Dennis, P. Fournier, and R. L. Greene, Phys. Rev. B 67, 184522, (2003).
- (43) C. M. Varma, P. B. Littlewood, S. Schmitt-Rink, E. Abrahams, and A. E. Ruckenstein, Phys. Rev. Lett. 63, 1996 (1989).
- (44) The featureless continuum is stronger for the film samples compared to the single crystals. This is an indication of additional disorder and/or possible strain fields.
- (45) T. P. Devereaux, D. Einzel, B. Stadlober, R. Hackl, D. H. Leach, and J. J. Neumeier, Phys. Rev. Lett. 72, 396 (1994).
- (46) T. P. Devereaux, Phys. Rev. Lett. 74, 4313 (1995).
- (47) H. Matsui, K. Terashima, T. Sato, T. Takahashi, M. Fujita, and K. Yamada, Phys. Rev. Lett. 95, 017003 (2005).
- (48) C. Kendziora, R. J. Kelley, and M. Onellion, Phys. Rev. Lett. 77, 727 (1996).
- (49) R. Hackl, G. Krug, R. Nemetschek, M. Opel, and B. Stadlober, SPIE (Bellingham) Vol. 2696, 194 (1996).
- (50) T. Masui, M. Limonov, H. Uchiyama, S. Lee, S. Tajima, and A. Yamanaka, Phys. Rev. B 68, 060506(R) (2003).
- (51) M. M. Qazilbash, A. Biswas, Y. Dagan, R. A. Ott, and R. L. Greene, Phys. Rev. B 68, 024502 (2003).
- (52) G. Blumberg, M. Kang, M. V. Klein, K. Kadowaki, and C. Kendziora, Science 278, 1427 (1997).
- (53) G. Blumberg, M. V. Klein, K. Kadowaki, C. Kendziora, P. Guptasarma, D. Hinks, J.Phys. Chem. Solids 59, 1932 (1998).
- (54) A. Bardasis and J. R. Schrieffer, Phys. Rev.121, 1050 (1961).
- (55) A.V. Chubukov, D.K. Morr, and G. Blumberg, Solid St. Comm. 112, 183 (1999).
- (56) A.V. Chubukov, T. P. Devereaux, and M. V. Klein, cond-mat/0508643.
- (57) A. Zimmers, R. P. S. M. Lobo, N. Bontemps, C. C. Homes, M. C. Barr, Y. Dagan, and R. L. Greene, Phys. Rev. B 70, 132502 (2004).
- (58) C. Kendziora and A. Rosenberg, Phys. Rev. B 52, 9867 (1995).
- (59) C. H. Choi and P. Muzikar, Phys. Rev. B 39, 11296 1989.
- (60) Comparison of with doping-dependence of 1/ is relevant if one assumes that the resonant properties of the Raman vertex, i.e. the optical conductivity near the laser excitation of 647 nm (1.9 eV), do not change with doping. Indeed, there is only a weak change in optical conductivity above 0.8 eV with doping in the relevant doping range (0.13 x 0.18).arima ; onose
- (61) T. Arima, Y. Tokura, and S. Uchida, Phys. Rev. B 48, 6597 (1993).
- (62) Y. Onose, Y. Taguchi, K. Ishizaka, and Y. Tokura, Phys. Rev. B 69, 024504 (2004).
- (63) G. Blumberg, M. Kang, and M. V. Klein, Phys. Rev. Lett. 78, 2461 (1997).
- (64) R. Sooryakumar and M. V. Klein, Phys. Rev. Lett. 45, 660 (1980).
- (65) R. Sooryakumar and M. V. Klein, Phys. Rev. B 23, 3213 (1981).
- (66) A fit to the BCS theory does not necessarily mean that the gap in the over-doped samples has -wave symmetry.
- (67) Weak SC coherence peak intensity from the under-doped PCCO film makes it difficult to determine the gap values for higher fields. At present, we can only estimate the upper critical field at which the SC coherence peak vanishes.
- (68) H. Balci and R. L. Greene, Phys. Rev. Lett. 93,067001 (2004).
- (69) A. Biswas, P. Fournier, V. N. Smolyaninova, R. C. Budhani, J. S. Higgins, and R. L. Greene, Phys. Rev. B 64, 104519 (2001).
- (70) S. Kleefisch, B. Welter, A. Marx, L. Alff, R. Gross, and M. Naito, Phys. Rev. B 63, 100507(R) (2001).
- (71) L. Alff, Y. Krockenberger, B. Welter, M. Schonecke, R. Gross, D. Manske, M. Naito, Nature 422, 698 (2003).
- (72) Point contact tunnelingQazilbash gives a higher of 1.5 T for over-doped samples because the tunneling measurements were performed at lower temperature (1.4 K).
- (73) M. Tinkham, Introduction to Superconductivity, Second edition, McGraw-Hill Inc. (1996).
- (74) The higher estimates for over-doped samples extracted from resistivity and Nernst measurements may be due to distribution in those samples.patrick ; hamzanernst
- (75) N. P. Armitage et al., Phys. Rev. B 68, 064517 (2003).
- (76) C. C. Tsuei and J. R. Kirtley, Phys. Rev. Lett. 85, 182 (2000).
- (77) H. G. Luo and T. Xiang, Phys. Rev. Lett. 94, 027001 (2005).