Infrared Hall effect in the electron-doped high cuprate Pr2-xCexCuO4
Abstract
The electron-doped cuprate Pr2-xCexCuO4 is investigated using infrared magneto-optical measurements. The optical Hall conductivity shows a strong doping, frequency and temperature dependence consistent with the presence of a temperature and doping-dependent coherent backscattering amplitude which doubles the electronic unit cell. The data suggest that the coherent backscattering vanishes at a quantum critical point inside the superconducting dome and is associated with the commensurate antiferromagnetic order observed by other workers. Using a spectral weight analysis we have further investigated the Fermi-liquid like behavior of the overdoped sample. The observed Hall-conductance spectral weight is about 10 times less than that predicted by band theory, raising the fundamental question concerning the effect of Mott and antiferromagnetic correlations on the Hall conductance of strongly correlated materials.
pacs:
74.25.Gz, 74.72.Jt, 75.30.Fv, 75.40.-sDoping a Mott insulator yields a number of exotic properties due to strong correlations in a great number of materials Imada . Among these, the properties of cuprates remain one of the greatest challenges in condensed matter physics. The last few years have seen remarkable progress on the synthesis of high critical temperature (high T cuprates, followed by reliable and high performance energy and momentum spectroscopic measurements. It is now possible to compare quantitatively the electron-doped side and the hole-doped side in the cuprate phase diagram. One striking difference is the presence of antiferromagnetic order in a much larger region on the electron-doped side of the phase diagram. This characteristic has been seen directly by neutron Greven1 ; Greven2 , Sr Uefuji and indirectly by optics Zimmers and angle resolved photoemission (ARPES) Armitage . However, the exact location of the antiferromagnetic region with respect to the superconducting region remains an open question as does the effect of antiferromagnetic order and fluctuations on electronic properties. Recent inelastic neutron studies Greven2 have concluded that these two phases do not overlap by showing that the antiferromagnetic phase is destroyed at dopings just before the appearance of the superconducting dome. On the contrary, various ARPES Armitage ; Matsui2005 ; Matsui2006 and optical Zimmers studies have shown the presence of a large energy pseudogap in this material. At low temperature this feature, which may be a signature of the antiferromagnetism, persists at dopings well inside the superconducting dome and ends at a quantum critical point at = 0.165 above optimal doping. These results are consistent with DC Hall experiments Dagan which have also shown strong evidence of this quantum critical point inside the superconducting dome. At high temperatures, standard optical measurement and ARPES data have also shown that this large energy pseudogap disappears Zimmers ; Matsui2005 .
To investigate further signatures of antiferromagnetism in the electron-doped cuprates, we have performed infrared Hall (IR Hall) measurements of the electron-doped Pr2-xCexCuO4 (PCCO) cuprate over a wide range of dopings and temperatures. The IR Hall response exhibits a rich structure, including frequency and temperature dependent sign changes, which can reveal more about the electronic structure of materials than the longitudinal conductivity . For example, IR Hall measurements have been found to be an extremely sensitive probe to the strong correlation effects in the hole-doped cuprates Rigal ; Grayson ; Cerne1 . In this Letter we show clear evidence at low temperatures and low dopings of a gap-like feature well inside the superconducting dome and its closing at higher dopings. These results support the scenario of a strong change in the Fermi surface in the electron-doped cuprates due to antiferromagnetic ordering and the presence of a quantum critical point inside the superconducting dome.
Thin films of Pr2-xCexCuO4 of several compositions were grown on LaSrGaO4 (LSGO) substrates using pulsed laser deposition Matsui . In this experiment we have studied the following samples: a highly underdoped (=0.12) K (thickness 1260 Å), optimally doped (=0.15) K (thickness 1450 Å) and overdoped (=0.18) K (thickness 1250 Å). We have measured the reflectance (R), transmittance (T) and the complex Faraday rotation angle. From these we have extracted the longitudinal conductivity () and Hall conductivity (). The reflectance and transmittance were measured for all samples in the 400-4000 cm-1 spectral range with a Bomem Fourier Transform spectrometer, enabling us to determine in this frequency range. Data were typically taken at 5 temperatures between 30 K and 300 K using a continuous flow cryostat. The Faraday rotation and ellipticity, represented by the complex Faraday angle , were measured using a photoelastic polarization modulation technique Cerne3 from 30K to 300K and from -8T to 8T. Experimental errors generated by this analysis in the real and imaginary part of due to errors in measurements of and are estimated to be .
As previous studies of the longitudinal conductivity Zimmers have shown, the low temperature and low doping (x=0.12) reflectance and transmittance data clearly show an extra spectral contribution at 1500cm-1 compared to the standard optical response in cuprates. This spectral shape translates into the opening of a partial gap in the optical conductivity . At low temperatures, the gap magnitude is smaller in the intermediate doping (x=0.15) than it is at the x=0.12 concentration. And it is not present at all at x=0.18. At room temperature none of the dopings presents the signature of this spectral gap in R, T or spectral functions.
Using the measured values of , the Faraday angle can be translated into other response functions such as the infrared Hall conductivity (the off diagonal term in the complex conductivity tensor ) or the complex Hall coefficient Cerne3 . In this work we focus on as the fundamental magneto-transport quantity. Previous studies have validated this technique by measuring the IR Hall response of simple metals such as gold and copper Cerne2 . The optical properties of simple metals are well described by a Drude model, and the IR Hall spectra for these cases were found to be consistent with a Drude model with mass parameter taken from band theory and measured scattering rate from .
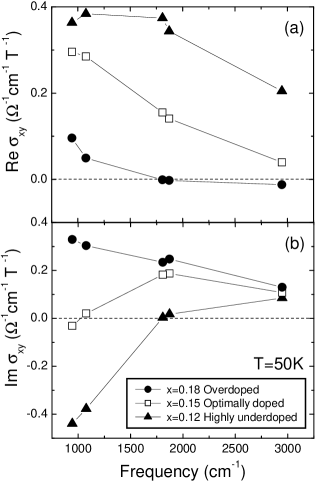
Figure 1 shows our principal results: the real and imaginary parts of as a function of frequency for x=0.12, 0.15 and 0.18 at T=50K. We begin our discussion of these data with reference to the Drude model with scattering rate , in which , with determined by band structure. In this model Im() has the same sign at all frequencies, while Re() has one sign change at a frequency set by . The data for x=0.18 are qualitatively consistent with the Drude model: Im() has the hole-like signature predicted by the band structure at this doping, does not change sign over the experimentally accessible frequency range, and at low frequencies, Re() has the hole-like sign found in the DC measurement Dagan , along with one sign change (at 1750cm-1) in the experimental frequency range. One qualitative inconsistency with the Drude model is that, in the model the maximum of Im() occurs only slightly above the frequency at which Re() crosses zero. Extended Drude models with frequency dependent scattering rates also exhibit this feature. However in the data the maximum of Im() obviously lies well below the zero-crossing of Re(). We believe that this difference arises because of electron-like contributions to below the frequency range of our measurements due to magnetic fluctuation effects. From Kramers-Kronig relations these low frequency contributions would increase Re() while doing little to Im() in our frequency range and therefore push the zero-crossing of Re() to higher frequencies. Evidence for these effects are also seen in the DC Hall coefficient in similarly doped samples as multiple zero-crossings of with temperature.
The data we have obtained for the lower doping x=0.15 and x=0.12 differ qualitatively from the predictions of the Drude model. In the less doped samples Im() exhibits zero-crossings at frequencies which increases as doping decreases. While Re() is concomitantly larger (in the experimental frequency range), DC Hall measurements indicate an electron-like sign at both x=0.15 and x=0.12 which implies a sign change must occur below our lowest measured frequency.
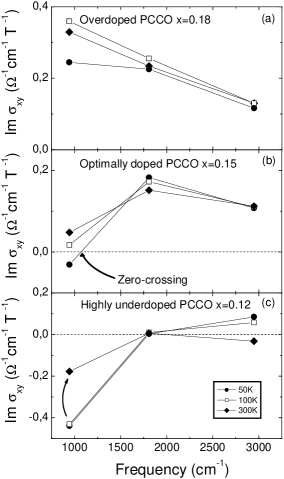
Figure 2 shows the temperature variation of Im() for all three dopings. As expected the overdoped sample x=0.18 does not present a zero-crossing in this response function at any temperature. For the optimally doped sample x=0.15 the zero-crossing clearly shifts to lower frequencies (see arrow in panel (b)) below the measured frequency range as the temperature is raised. This feature is not observed for x=0.12, however the low frequency response is moving to smaller values as temperature is raised (see arrow in panel (c)). These variations could indicate the closing of the high energy pseudogap as seen in ARPES Matsui2005 , Zimmers and DC Hall measurements Dagan . The DC Hall and IR Hall measurements seem however to be more sensitive than ARPES and standard optical measurements when probing the temperature evolution of this gap since they still clearly show the presence of the high energy pseudogap at room temperature in underdoped samples.
To go beyond the Drude model and understand the entire set of data, we now develop a spin density wave (SDW) model. We consider a mean field theory of electrons moving on a square lattice with dispersion
| (1) |
and parameters eV=3056 cm-1, and , chosen to reproduce the Fermi surface measured in the photoemission experiments, Armitage ; Millis . The electrons are scattered by a commensurate spin density wave with scattering amplitude . The electric and magnetic fields are represented by vector potentials and coupled via the Peierls phase approximation, . At the relevant carrier concentration, the Fermi surface is such that the scattering vector connects Fermi surface points, causing reconstruction of the Fermi surface. At a doping of , for less than eV, the calculated Fermi surface exhibits both an electron-like pocket centered at and hole-like pockets centered at as observed in photoemission Armitage ; for larger only the electron pocket remains. The longitudinal and Hall conductivities are calculated by direct evaluation of the Kubo formula; for we used the expressions given by Voruganti et. al. Voruganti92 . While this approach does not capture the physics of the Mott transition, it does give a reasonable picture of the effect of the SDW gap on the quasiparticle properties.
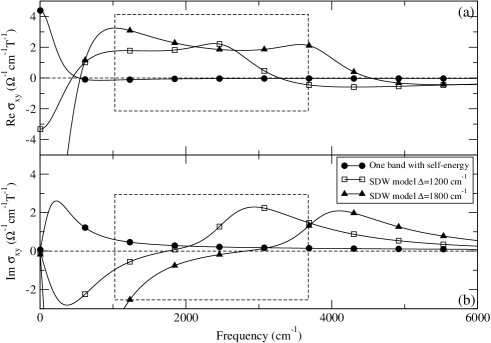
Figure 3 shows the calculated IR Hall response for . For and we used a constant scattering rate . The qualitative resemblance of the calculated curves to the data obtained for and is striking (compared to figure 1). For non-zero a sign change occurs at a -dependent frequency and correspondingly, in the range of frequencies actually measured, Re() becomes larger as increases and two sign changes occur; one at high and one at low frequency. The zero-crossing seen in the Im() may be understood as follows: the SDW model predicts a Fermi surface made up of hole-like and electron-like pockets. Im is negative (electron-like) at low frequencies where the large electron-like pocket dominates the transport. However, at high frequency (frequencies much higher than the SDW gap ) the response must revert to the hole-like response of the underlying hole-like band structure. Similarly, the changes observed with increasing temperature are clearly similar to those occurring as the gap is reduced in the model calculation. Although the qualitative correspondence between calculation and data is striking an important difference exists: the magnitude of the calculated Hall response is bigger than the measured values by factors of the order of 5. We believe this difference is the signature of the suppression of AC charge response by Mott physics. Understanding this in more detail is an important open problem.
Figure 3 also shows a calculation of the IR Hall response for ; this is to be compared to the data obtained for . For this doping we have used a frequency dependent scattering model previously used to fit the data Voruganti92 . The rough magnitude and frequency dependence are in qualitative accord with the measurement, but the incorrect position of the zero-crossing in Re() demonstrates that despite its success in fitting the longitudinal conductivity the extended Drude model is an inadequate description of transport even in overdoped PCCO.
It is useful to consider the small measured values of in terms the general issue of optical sum rules. For the longitudinal conductivity the appropriate partial sum is Re. In high temperature superconductors, theoretical and experimental evidence suggests that for 0.1eV 1eV , i.e. above the Drude peak but well below the interband and upper Hubbard band features, the partial integral is proportional to the product of the doped hole density per Cu atom and the band theory conduction band kinetic energy 0.4eV : for 0.18-doped PCCO, (0.4eV ) = Millis . For frequencies below this value the extended Drude parametrization is physically meaningful. For the Hall conductivity, the appropriate partial sum is Im Drew and the corresponding extended Drude parametrization is . For the low doped samples the effects of the SDW gap extends through our measurement range. Therefore we focus on the overdoped x=0.18 sample for which there are no obvious high frequency SDW effects. We can estimate S(0.4eV, 0.1eV) = directly from the data, finding about 0.045. We may estimate the contribution arising from below our measurement range in two independent ways; the two methods yield consistent answers. First, we observe that the very low frequency longitudinal conductivity is characterized by a Drude peak of width and a Hall resistance not too far from the band value, suggesting that at low frequencies a picture of weakly scattered quasiparticles is appropriate, so that , allowing us to estimate the integral over the low frequency region as Im, leading to the estimate S(0.4eV ) . Second, model calculations Lin show that in the frequency range 0.2eV the quantity Im is about a factor of two larger than . Using this factor of two and our data gives the estimate S(0.4eV ). Thus, we conclude that the IR hall data at x = 0.18 imply a suppression of the Hall effect which is approximately a factor of two greater than the suppression of the longitudinal conductivity, rasing the possibility of different Mott renormalizations of the Hall and longitudinal conductivities. We suggest that refining the experimental estimates and extending them to other materials, as well as developing an appropriate body of theoretical results, are urgent open problems.
We have reported the transverse optical conductivity of the electron-doped cuprate Pr2-xCexCuO4. At low doping and temperatures, the results are consistent with a spin density wave scenario which was previously used to explain photoemission and standard optical conductivity data. At high doping, we find no sign of this SDW gap, however a spectral weight analysis shows that the material could still manifest effects from this gap in its optical response function.
The authors thank Dr. S. Dhar for RBS / Channeling measurements and Y. Dagan for his initial work on film preparation using LSGO substrates. We wish to acknowledge useful discussions with A. V. Chubukov and H. Kontani. The work at the University of Maryland was supported by NSF grants DMR-0352735 and DMR-0303112. The work at the University at Buffalo was supported by the Research Corporation Cottrell Scholar Award and NSF-CAREER-DMR0449899. A. J. Millis and J. Lin acknowledge support from NSF DMR 0403167.
References
- (1) (a) Deceased.
- (2) M. Imada , Rev. Mod. Phys. 70, 1039-1263 (1998)
- (3) P. K. Mang , Phys. Rev. Lett. 93, 027002 (2004).
- (4) E.M. Motoyama , cond-mat/0609386 (2006).
- (5) T. Uefuji .,Physica C 357-360, 208-211 (2001).
- (6) A. Zimmers ., Europhys. Lett., 70 (2), 225 (2005).
- (7) N.P. Armitage , Phys. Rev. Lett.88, 257001 (2002).
- (8) Matsui , APS March meeting 2006.
- (9) Matsui , Phys. Rev. Lett. 94, 047005 (2005).
- (10) Y. Dagan ., Phy. Rev. Lett. 92, 167001 (2004).
- (11) L.B. Rigal , Phys. Rev. Lett. 93, 137002 (2004).
- (12) M. Grayson , Phys. Rev. Letters 89, 037003 (2002).
- (13) J. Cerne , Phys. Rev. Letters 84, 3418 (2000).]
- (14) E. Maiser ., Physica C 297, 15 (1998).
- (15) J. Cerne , Rev. Sci. Instrum. 74, 4755 (2003).
- (16) J. Cerne , Phys. Rev. B 61, 8133-8140 (2000).
- (17) A. J. Millis, et. al., Phys. Rev. B72, 224517 (2005).
- (18) P. Voruganti , Phys. Rev. B45, 13945 (1992).
- (19) H. D. Drew and P. Coleman Phys. Rev. Lett. 78, 1572-1575 (1997).
- (20) J. Lin qand A. J. Millis, in preparation.