Successive Phase Transitions in Antiferroelectric Liquid Crystal
Systems
-
Axial Next-Nearest-Neighbor XY Model with Biquadratic Interaction
Abstract
An axial next-nearest-neighbor XY model is studied as a model of chiral liquid crystals which exhibit many ferro-, ferri- and antiferroelectric tilted smectic phases. Depending on the values of interaction parameters, this model exhibits Ising symmetric (i.e., the tilt directions of directors are parallel or anti parallel) phases or XY symmetric phases. Phases with each type-of-symmetry show the character of devil’s staircase, which has been observed in experiments.
1 Introduction
Several chiral liquid crystal (LC) compounds have found to exhibit intermediate subphases, SmC (also called SmC), SmC (also called AF), and other ferrielectric phases (FIH, FIL and FI) between ferroelectric SmC∗ and antiferroelectric SmC phases [1, 2]. All these phases are tilted smectic phases and they have approximately the same tilt angle from the layer normal. Each phase consists of a helical stack of unit-set-of-layers (unit cells); the helix pitch is typically on the order of several [3]. Structures of SmC, SmC and SmC among those are well-known [2, 4, 5, 6, 7]: the unit cells characterizing SmC∗, SmC, SmC, and SmC consist of 1, 2, and 3, 4 layers, respectively. The early experiments [1, 2, 8] have identified that the -directors (the projection of a director onto layer-plane) of neighboring layers are parallel or antiparallel. This experimental result indicates that the system can be described with an Ising model. In fact, it has shown that an axial next nearest neighbor Ising (ANNNI) model, which has competing interactions, exhibits infinitely many subphases and can reproduce the transition sequence shown in experiments [9, 10]. However, the assumption of the Ising symmetry on these LC systems is unnatural. In practice, the -directors of layers are proved to deviate slightly from the parallel-antiparallel configuration by later high-resolution experiments [4, 5, 6, 7]. In this context, various phenomenological theories have been carried out to clarify the transition phenomena of the intermediate phases [12, 13, 14, 15, 16]. In these models a continuous rotational freedom of tilt direction is taken into account. To a greater or less extent, these models are generalization of ANNNI model and the models are called axial next-nearest-neighbor XY (ANNNXY) models. Although the ANNNXY model exhibits infinitely many subphases, the system does not undergo discrete transitions between these subphases but continuously changes. By introducing an external aligning field on ANNNXY model, the transitions between subphases are shown to be recovered [11, 17]. However such external field is artificial and its origin is ambiguous.
As a more realistic model applicable to the antiferroelectric materials, the ANNNXY model with a biquadratic interaction has been introduced and introductory remarks on the crossover from XY character to Ising character are given [18]. In the present paper, we investigate the ANNNXY model with the biquadratic interaction and disclose general properties of this model.
2 ANNNXY Model with a Biquadratic Interaction
Following ref. [18], we introduce a Hamiltonian of the ANNNXY model with a biquadratic interaction as
| (1) |
| (2) |
where the denotes the azimuthal angle of a molecule in -th layer. The parameter is the interaction parameter between molecules belonging to the same layer. The summation in the first term of eq.(2) is done over all neighboring pairs in the -th layer. The parameters and are the interaction parameters between molecules in the nearest neighboring layers and next nearest neighboring layers, respectively. Let be positive without loss of generality since the transformation followed by leaves the above Hamiltonian invariant. In the following, we set to be negative. The last term of eq.(2) is the biquadratic interaction with an interaction parameter . This biquadratic interaction term stabilizes the parallel and antiparallel configuration of -directors. This Hamiltonian can be viewed as a truncated Fourier approximation of an exact Hamiltonian.
Our model turns to the ordinary ANNNXY model for vanishing value of . In the limit of , it turns to the ANNNI model. Thus for sufficiently large the ordered phase has parallel and antiparallel -directors; we call such phases Ising symmetric phases. We call the other phases XY symmetric phases.
In the present paper, we ignore the helical structure of the chiral smectic phases, and assume these phases as simple periodic repetitions of unit cells. Thus a smectic phase is characterized by a set of order parameters in the unit cell, and may be labeled with its wavenumber . We note that the transformation results in . Thus, e.g., (SmC) and (SmC) phases under negative correspond, respectively, to and phases under positive .
At zero temperature, there are three stable phases [18]: phase, phase, and a phase Q in which the wave number changes continuously in the range . The phase diagram for temperature is shown in the inset of Fig. 1. In the phase , irrespective of the value , the azimuthal angles in a unit cell can be written as and , i.e., this phase has Ising symmetry. The stable distribution of azimuthal angle in phase Q is , and the stable wave number is determined by interaction parameters as .
3 Theoretical Methods and Results
3.1 Mean Field Approximation
In this section, we investigate the stability of phases at finite temperature within the mean field approximation. We choose the order parameters of -th layer as
| (3) |
where the angular brackets indicate a thermal average over all molecules in a single layer. We can assume, without loss of generality, that in Ising symmetric phases the -directors are parallel to -axis and thus . The mean fields due to these order parameters are
| (4) |
where we assumed that each molecule interacts molecules in the same layer, one molecule in each of the two nearest neighboring layers, and one molecule in each of the two next nearest neighboring layers. We can derive the mean field free energy per layer [18] using the above order parameters and mean fields as
| (5) |
where is a period (number of layers in a unit cell). The function in the last term of eq.(5) is the one-molecule partition function defined as
| (6) |
From the derivatives of the free energy with respect to the mean fields, we obtain a set of self-consistent equations:
| (7) |
where , , , and in the right-hand sides are functions of order parameters defined in eqs.(4). One of the solutions of eqs.(7) which minimizes the free energy gives a set of order parameters of the thermodynamically stable state.
The transition temperature between ordered and disordered phases is
| (8) |
where and are, respectively,
| (9) | |||
| (10) |
with the -th order modified Bessel functions . The variable is a solution of
| (11) |
thus is given by solving eqs.(8) and (11) self-consistently. The above critical temperature is derived [18], under the assumption that the transition is second-order, by expanding the free energy around , and , and letting the quadratic terms of the expansion vanish at critical temperature. The order-disorder transition temperature deviates from eq.(8) if the transition is first-order. Indeed, as we will see below, the transition temperature is slightly higher than when is comparable to .
In the following, we restrict our consideration to a set of major ordered phases with wavenumbers , , , , , and a disordered phase. Since we discuss the relative stability of these phases rather than infinitely many phases, the resulting phase diagrams should be viewed as rough approximations of correct phase diagrams. However, we can expect, from the analogy of ANNNI model, that other than the above six phases will occupy relatively small regions on the phase diagrams, and that we can safely ignore these minor phases.
In order to reduce the number of order parameters, we make a reasonable assumption that the ordered phases are highly symmetric. In precise, when the period is odd (i.e., in this paper), we assume that a set of -directors of a unit cell has mirror symmetry with respect to a plane perpendicular to the smectic layers; when is even, we assume a two-fold rotational symmetry of the set of -directors, in addition to the mirror symmetry.
In the following calculation, we set and . We take as the unit of energy. Each ordered phase has a set of (reduced number of) self-consistent equations (7). We solved the sets of equations numerically, and determined the thermodynamic stable phase by comparing the free energy per molecule.
3.2 Phase Diagrams
At , our model is reduced to an ordinary ANNNXY model. Then the system transits through the phases of continuously [12, 13, 14, 15, 16] and thus the successive phase transitions are never observed. We show the phase diagram for in Fig. 1, in which we considered the relative stability of , , , , and phases.
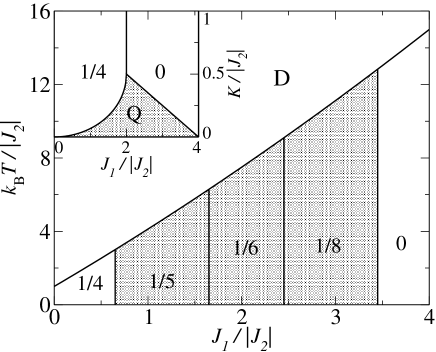
The phases with , , and have XY symmetry, while and phases have Ising symmetry. It seems there is a contradiction between - diagram (inset) and - diagram at and , i.e., stable regions of and phases are overestimated in - diagram; such a contradiction, which can be observed in all the following phase diagrams, is due to our approximation in which infinitely many minor phases are ignored.
Since the effect of the biquadratic interaction stabilizes the Ising symmetric phases, and phases dominate larger regions as increases. The phase diagram for , Fig. 2, shows that the Ising symmetric phases spread from the lower-temperature region.
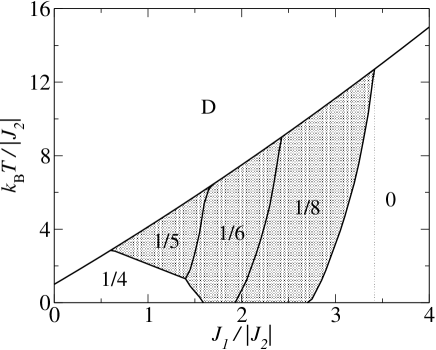
The phases with , , and still have XY symmetry.
When exceeds , the phases with vanish for any at zero-temperature (see the inset of Fig. 1). The phases with , , and change qualitatively at this stage. In these phases, Ising symmetric phases appear at lower temperature region and the Ising symmetric regions expand as increases. Figure 3 is a phase diagram for .
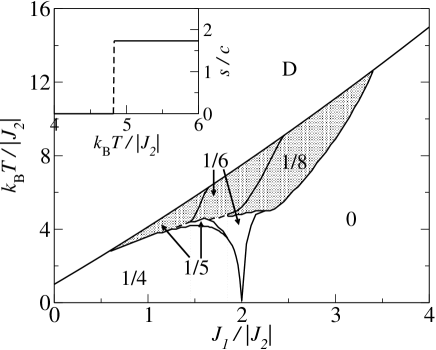
In this phase diagram, we can clearly observe the cross-over from XY symmetric phases to Ising symmetric phases.
Figure 4 shows the phase diagram for .
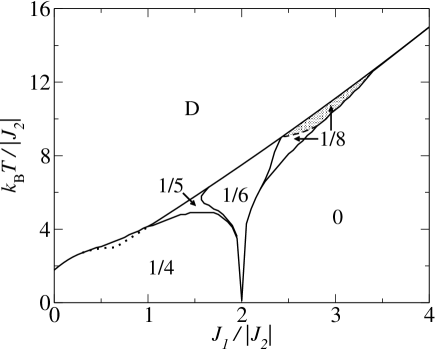
The Ising symmetric phases are spread out almost the whole region. This figure also shows a difference from Figs. 1, 2 and 3 in the order-disorder transition temperature. The temperature (the order-disorder transition temperature under the assumption of the second-order transition) deviates from when exceeds unity (see eqs.(8) and (11)); the deviation arises from the region where . However the does not give correct order-disorder transition temperature. In fact, the actual transition temperature is slightly higher than the calculated in the region where and are comparable, as shown in Fig. 4. This fact indicates that the order-disorder transition is first-order, rather than second-order. Indeed, we observed that the order parameters changes discontinuously at the region where the order-disorder transition temperature is different from .
4 Summary and Discussions
We studied the transition behavior of ANNNXY model with biquadratic interaction which can be applicable to the successive phase transitions of antiferroelectric smectics; the biquadratic interaction is interpreted as the second Fourier component of a pair directional interaction. The crossover from the XY symmetry to the Ising one is identified for several representative phases. The Ising symmetric phase has been suggested to appear from the low temperature region as the strength of biquadratic interaction is increased [18]. At the XY symmetric phase with period , the difference of tilt directions of directors in successive layers, , is shown to be , which indicates a simple helical structure.
Our results show that the ANNNXY model with biquadratic interaction reproduce the phase sequence observed in the experiments. However, we may not expect the quantitative agreement with experiments. As an example, let us consider the LC molecules in phase, which is essentially equivalent to phase for negative , and thus this phase corresponds to the 3-layer SmC. Ellipsometric experiments have shown that -directors of this phase do approximately but not exactly lie in a co-plain [6]. In precise, the azimuthal angles of molecules in a period are , , and , with rad (). In terms of our model, this fact corresponds to the situation where . The inset of Fig. 3 shows a typical behavior of in phase at the XY-Ising transition temperature. As shown in Fig. 3, the ratio is rather large() at high temperature and approximately zero at low temperature; we cannot find any region where is comparable to the experimental results. For quantitative agreement of the present results with experimental ones, some additional modification to the present model is required. We may expect to obtain quantitatively reliable results by introducing a chiral interaction together with long range interactions [9, 19, 20], as done by Olson et al. [21] to explain the in the framework of phenomenological free energy.
The profile of phase diagram for Ising symmetric phases in Fig. 4 suggests apparently a character of devil’s staircase [9, 10] and thus the system undergoes successive phase transitions. For phases of XY symmetry in Figs. 2 and 3, however, it is not clear from our present analysis whether the system exhibits the successive phase transitions or not. Analysis of the stability of the soliton excitation can be a powerful tool to certify the successive transitions between XY symmetric phases. In the ANNNXY model under the two-fold external field, the character of devil’s staircase is certified even in the ground state [11]. However, in the present model, the phase changes continuously at the ground state for small biquadratic interaction as shown in the inset of Fig. 1. In this respect, the phase boundary of main phase should be studied at finite temperature, which will disclose the character of successive phase transitions.
References
- [1] T. Isozaki, T. Fujikawa, H. Takezoe, A. Fukuda, T. Hagiwara, Y. Suzuki and I. Kawamura, Phys. Rev. B 48 (1993) 13439.
- [2] T. Matsumoto, A. Fukuda, M. Johno, Y. Motoyama, T. Yui, S. S. Seomun and M. Yamashita, J. Mater. Chem. 9 (1999) 2051.
- [3] L. S. Hirst, S. J. Watson, H. F. Gleeson, P. Cluzeau, P. Barois, R. Pindak, J. Pitney, A. Cady, P. M. Johnson, C. C. Huang, A-M. Levelut, G. Srajer, J. Pollmann, W. Caliebe, A. Seed, M. R. Herbert, J. W. Goodby, and M. Hird, Phys. Rev. E 65 (2002) 041705.
- [4] P. Mach, R. Pindak, A.-M. Levelut, P. Barois, H. T. Nguyen, C. C. Huang, and L. Furenlid, Phys. Rev. Lett. 81 (1998) 1015.
- [5] P. Mach, R. Pindak, A.-M. Levelut, P. Barois, H. T. Nguyen, H. Baltes, M. Hird, K. Toyne, A. Seed, J. W. Goodby, C. C. Huang, and L. Furenlid, Phys. Rev. E 60 (1999) 6793.
- [6] P. M. Johnson, D. A. Olson, S. Pankratz, T. Nguyen, J. Goodby, M. Hird, and C. C. Huang, Phys. Rev. Lett. 84 (2000) 4870.
- [7] A. Cady, J. A. Pitney, R. Pindak, L. S. Matkin, S. J. Watson, H. F. Gleeson, P. Cluzeau, P. Barois, A.-M. Levelut, W. Caliebe, J. W. Goodby, M. Hird, and C. C. Huang, Phys. Rev. E 64 (2001) 050702.
- [8] A. Fukuda, Y. Takanishi, T. Isozaki, K. Ishikawa and H. Takezoe, J. Mater. Chem. 4 (1994) 997.
- [9] M. Yamashita and S. Miyazima, Ferroelectrics 148 (1993) 1.
- [10] M. Yamashita, Ferroelectrics 181 (1996) 201.
- [11] M. Yamashita and S. Takeno, J. Phys. Soc. Jpn. 68 (1999) 1493.
- [12] V. L. Lorman, A. A. Bulbitch and P. Toredano, Phys. Rev. E 49 (1994) 1369.
- [13] M. Cepic and B. Zeks, Mol. Cryst. Liq. Cryst. 263 (1995) 61.
- [14] X. Y. Wang and P. L. Taylor, Phys. Rev. Lett. 76 (1996) 640.
- [15] A. Roy and N. V. Madhusudana, Europhys. Lett. 36 (1996) 22.
- [16] M. Skarabot, Mojca Cepic, B. Zeks, R. Blinc, G. Heppke, A. V. Kityk, and I. Musevic, Phys. Rev. E 58 (1998) 575.
- [17] S. Tanaka and M. Yamashita, Ferroelectrics 245 (2000) 209.
- [18] M. Yamashita and S. Tanaka, Ferroelectrics 245 (2000) 217.
- [19] M. Yamashita, J. Phys. Soc. Jpn. 65 (1996) 2122.
- [20] M. Cepic and B. Zeks, Phys. Rev. Lett. 87 (2001) 85501.
- [21] D. A. Olson, X. F. Han, A. Cady, and C. C. Huang, Phys. Rev. E 66 (2002) 021702.