Quantitative analysis of ferroelectric domain imaging
with piezoresponse force microscopy
Abstract
The contrast mechanism for ferroelectric domain imaging via piezoresponse force microscopy (PFM) is investigated. A novel analysis of PFM measurements is presented which takes into account the background caused by the experimental setup. This allows, for the first time, a quantitative, frequency independent analysis of the domain contrast which is in good agreement with the expected values for the piezoelectric deformation of the sample and satisfies the generally required features of PFM imaging.
pacs:
77.80.Dj, 68.37.Ps, 77.84.-sDomain engineering in ferroelectric crystals is of increasing importance for quasi-phase-matched second-harmonic generation Fej92 , nonlinear photonic crystals Bro00 , and ultra-high density data storage devices Cho02 . Among the techniques utilized for the visualization of ferroelectric domains Soe05 piezoresponse (or piezoelectric) force microscopy has become an established standard tool because of its non-destructive imaging capability with high lateral resolution Alexe ; Par05 . This detection technique is based on the deformation of the sample due to the converse piezoelectric effect. The piezoresponse (or piezoelectric) force microscope (PFM) is a standard scanning force microscope (SFM) operated in contact mode with an additional small alternating voltage applied to the tip. In piezoelectric samples this voltage causes thickness changes and therefore vibrations of the surface which lead to oscillations of the cantilever that can be read out with a lock-in amplifier. However, although widely used, the contrast mechanism for domain detection with PFM is still under discussion mainly because of inconsistencies of the measured data that concern the following features:
-
Frequency dependence: the domain contrast should be independent of the frequency of the alternating voltage applied to the tip. This applies of course only for frequencies far away from any intrinsic resonance frequencies of the cantilever. As the mechanical resonances of bulk ferroelectric crystals are very high, they are irrelevant for our considerations Bur75 .
-
-
Vibration amplitude: the vibration amplitude of a and a domain face must be equal. Its value should be in agreement with the theoretical prediction with being the appropriate piezoelectric constant and the voltage applied to the tip Lin03 .
-
-
Phase shift: a phase difference of 180∘ between the piezoelectric response on a and on a domain face is considered mandatory.
-
-
Cantilever stiffness: the domain contrast should be independent of the stiffness of the cantilever used.
However, frequency scans of the alternating voltage applied to the tip are reported to show a complex spectrum, i.e. the measured domain contrast strongly depends on the frequency. The vibration amplitude measured is not equal on differently orientated domains and the reported values differ by orders of magnitude. The phase difference of 180∘ is not generally obtained. Finally the domain contrast in PFM measurements was observed to be affected by the stiffness of the cantilever. See e.g. Refs. Kol95 ; Eng98 ; Lab00 ; Lab01 ; Hong02 ; Har02 ; Har03 ; Har04 ; Scr05a ; Agr05 .
Indeed, because of these basic inconsistencies with the features listed above alternative origins for the domain contrast in PFM measurements have been discussed. For the same experimental setup the term ”dynamic-contact electrostatic force microscopy” (DC-EFM) was introduced and domain contrast was explained by specific electrical properties of the and the domain faces Hon98 . Differences in the work functions were also proposed for causing the domain contrast Shv02 . To achieve a deeper insight the electrostatic and the electromechanical contributions of the tip-surface junction were calculated taking into account the field and potential distributions as well as the indentation force of the tip Kal02 .
Even though numerous approaches for an understanding of the PFM contrast mechanism of ferroelectric domains have been reported, a full (quantitative) analysis is still lacking. Although there is no doubt that PFM imaging is sensitive to ferroelectric domains, the opposite situation (a contrast in PFM imaging unambiguously proving the existence of ferroelectric domains) is not yet established because of the above mentioned inconsistencies. A more detailed understanding of the PFM detection method is therefore needed.
In this letter we present a novel analysis of the data acquired with PFM. This allows for the first time a clear understanding of the contribution of the converse piezoelectric effect which is found to fully satisfy the features listed above.
For the investigations, we used a conventional experimental setup with a commercial scanning force microscope (SMENA, NT-MDT), modified to allow application of voltages to the tip. We utilized four different cantilevers C1-C4 with Pt/Ir-coated tips (Micromasch) of lengths , resonance frequencies kHz, and stiffness : = 5.3 N/m, : = 9.8 N/m, : = 11.4 N/m and : = 26.4 N/m. For PFM operation we applied an alternating voltage (amplitude: 10 Vpp) to the tip and detected the resulting oscillation of the cantilever with a lock-in amplifier (SRS 830), the phase being set to , the time constant to 3 ms. We simultaneously recorded the in-phase () and the orthogonal () output, denoting the phasing with respect to the alternating voltage applied to the tip. In the following these output signals of the lock-in amplifier will be named PFM signals, and being the PFM signal on a and a domain face respectively. The sample was a periodically poled, -cut, congruently melting lithium niobate crystal ( mm3) with a period length of 8 m.
The experimental procedure was as follows: we firstly recorded a PFM image of the sample in order to subsequently position the tip accurately on a or a domain face. We then measured the frequency dependence of the amplitude of the cantilever oscillations by scanning the alternating voltage applied to the tip from 10 kHz to 100 kHz. The scan duration was about 10 minutes. The graphs in this letter are averages over three separate frequency scans taken at different positions on the sample surface.
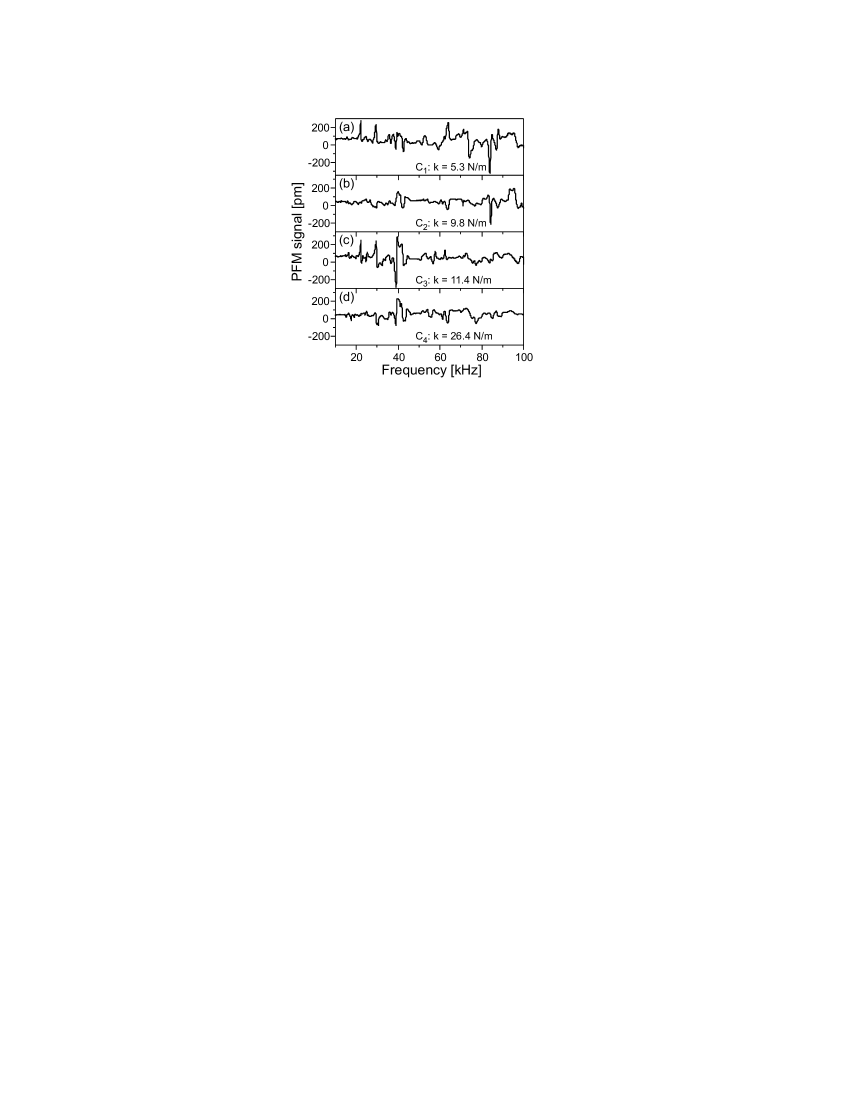
Figure 1 shows frequency scans of the in-phase PFM signal on a domain face for the four different cantilevers used. The frequency spectra look apparently random, although some specific features recur (for example at 22 and at 29 kHz for C1 and C3 and at kHz for C1 and C2). The PFM signal reaches values of more than 250 pm whereas only 75 pm are predicted for the surface vibration due to the converse piezoelectric effect in -cut . Moreover at some specific frequencies, no PFM signal is measured and even negative values are obtained. The PFM signal of the orthogonal output of the lock-in amplifier shows a similar behavior, however, with completely different spectra.
Frequency spectra similar to the ones shown in Fig. 1 have already been reported Lab00 ; Har04 ; Scr05a . For their explanation the excitation of resonant modes of the cantilever was proposed, tip and sample surface being in contact with each other. Lab00 . We observed, however, that frequency scans with no sample in the vicinity of the tip result in similar spectra, admittedly with a smaller amplitude. If the tip is in contact with the sample, the frequency spectrum can be affected e.g. by changing the coupling conditions between the tip and the SFM head. We therefore wrapped the silicon chip (to which the tip is attached) with conductive scotch tape. This led to an altered spectrum with much larger amplitudes. These results indicate a complex mechanical resonance behavior of the whole setup comprising the sample, the tip with cantilever and the SFM head. From the spectra shown in Fig. 1 and the findings described above, it is obvious that only a small part of the PFM signal on can be attributed to the ferroelectric properties of the sample. The PFM signal is completely dominated by a complex background signal.
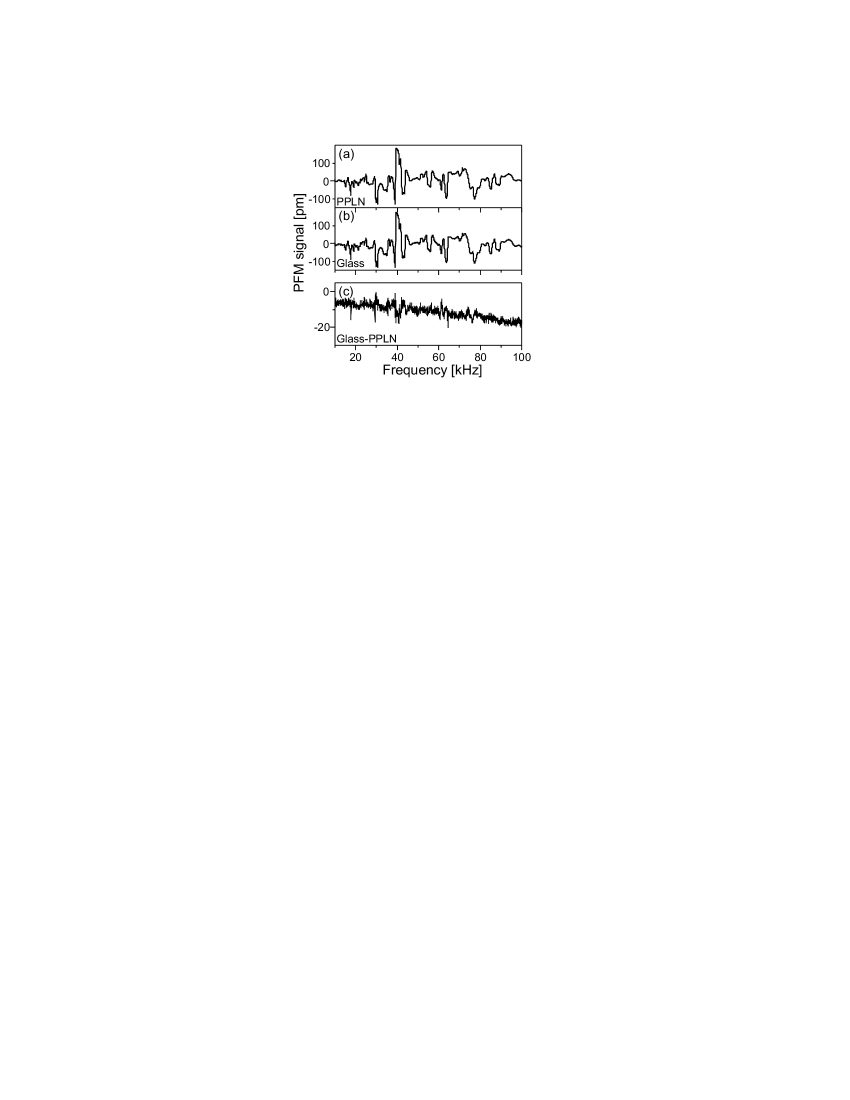
To determine this background signal, we averaged over the and domain faces: , therefore eliminating the contributions of the ferroelectric properties of the sample to the PFM signal (Fig. 2(a)). To prove this statement we performed reference measurements with the same cantilever on a standard glass microscope slide (Fig. 2(b)). The difference between these two frequency spectra is shown to be extremely small (Fig. 2(c) the vertical scale being expanded by a factor of ten). The slight decrease towards higher frequencies might be due to a drift of the experimental setup during the scan time of 10 minutes. The graphs clearly show a reproducible, frequency dependent PFM signal independent of the kind of sample used. In the following this PFM signal will be denoted as the background PFM signal .
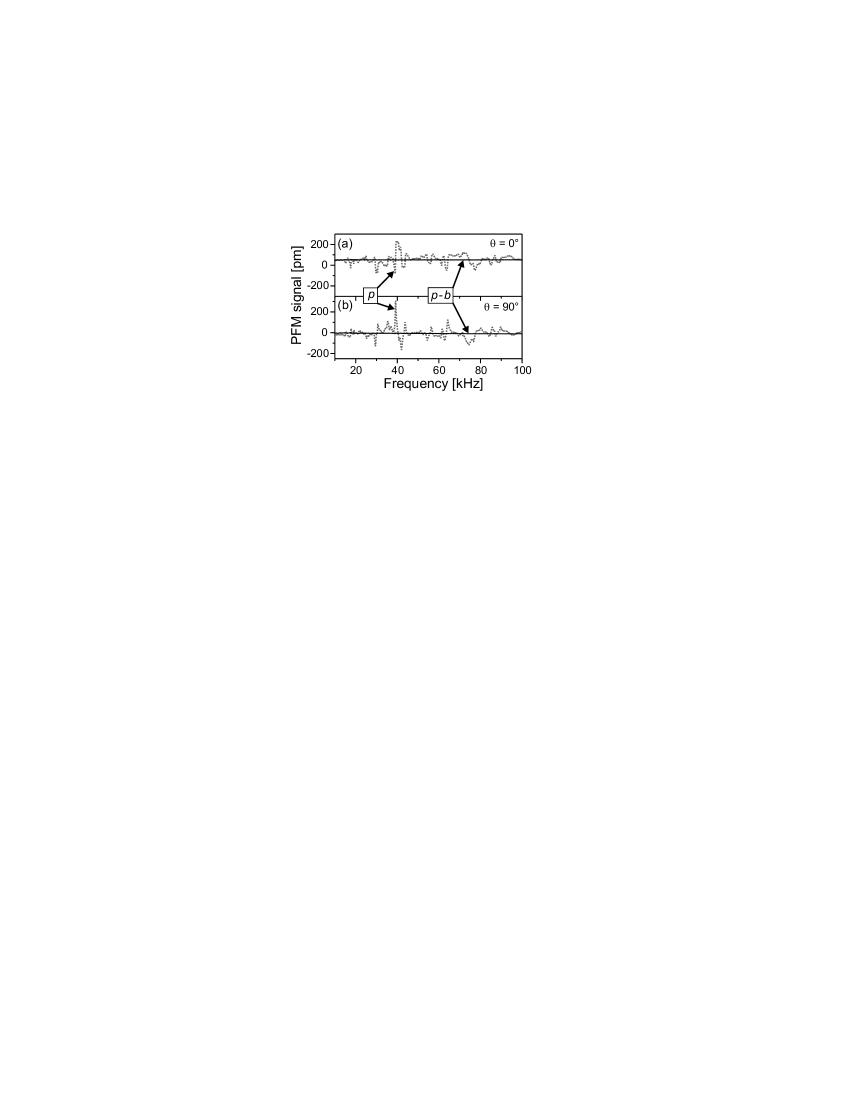
In order to extract the contributions of the ferroelectric properties of the sample from the PFM signal we subtracted the background PFM signal from the measured data. The result is shown in Fig. 3 on a domain face for the in-phase (a) and the orthogonal (b) output of the lock-in amplifier. The background-corrected curves (, black lines) are plotted together with the measured PFM signals (, gray lines). As can be clearly seen, the part of the PFM signal causing the domain contrast appears only in phase with the applied voltage with a constant amplitude.
For an interpretation of the background-corrected PFM signal we performed a quantitative analysis of the measurements. Figure 4 shows the frequency spectra of the background-corrected in-phase PFM signals for the four cantilevers, the vertical scale being expanded by a factor of ten with respect to Fig. 3. All cantilevers show a frequency independent spectrum, the averaged values are C1: 62.1 pm, C2: 58.8 pm, C3: 70.5 pm, and C4: 51.8 pm. This has to be compared with the theoretically expected value for the converse piezoelectric effect of pm with C/m2 and N/m2 being the appropriate piezoelectric and stiffness tensor elements respectively Jaz02 .
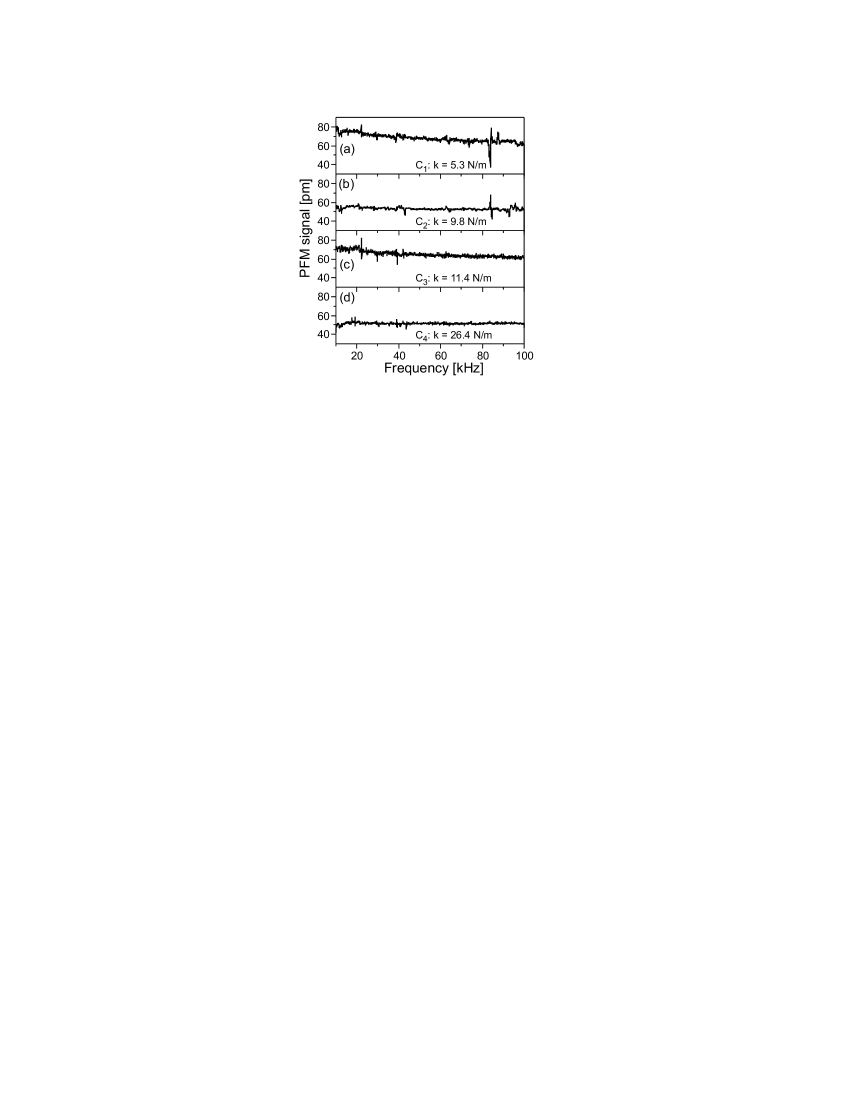
Although the background-corrected PFM signals are of the right magnitude, they are all too small however by 5 - 30 % as compared to the theoretically expected value 111This has to be compared to published values that vary from 20 pm for KTP () Eng98 to 30 nm for GASH Kol95 (), both with 10 V applied to the tip.. A possible explanation lies in the mechanical constrictions of the deformation. The electrical field at the tip, causing the piezoelectric deformation, spatially decays extremely fast due to the small radius of curvature of the tip ( nm) Kol95 . As a consequence, the thickness changes of the crystal occur in a volume comparable to the tip size. Because of its stiffness, the crystal cannot fully follow the required deformation which could be the cause for measuring too small values. Using larger tips should result in higher values for the piezoelectric deformation 222Note that although at the very tip, the electric field might be as high as 107 V/m (with 10 V applied to the tip), this has no influence on the theoretically expected piezoelectric thickness change which is determined only by the applied voltage Lin03 ..
An important point here is that the PFM signal was found to be independent of the stiffness of the cantilever. Because we always operate the PFM at the same set-point of the feedback circuit (i.e. the same bending of the cantilever), the graphs in Fig. 4 this already indicate that the indentation of the tip has no influence on the PFM signal. We confirmed this statement by using a stiff cantilever and varying the set-point, thus changing the indentation force by two orders of magnitude. The observed frequency spectra remained mainly unchanged. Note that a too strong indentation can trigger a local switching of the polarization of the material Alp01 .
With the results described above, the contrast mechanism in PFM imaging of ferroelectric domains can be fully explained through the thickness change of the sample due to the converse piezoelectric effect, taking into account the background PFM signal as determined above.
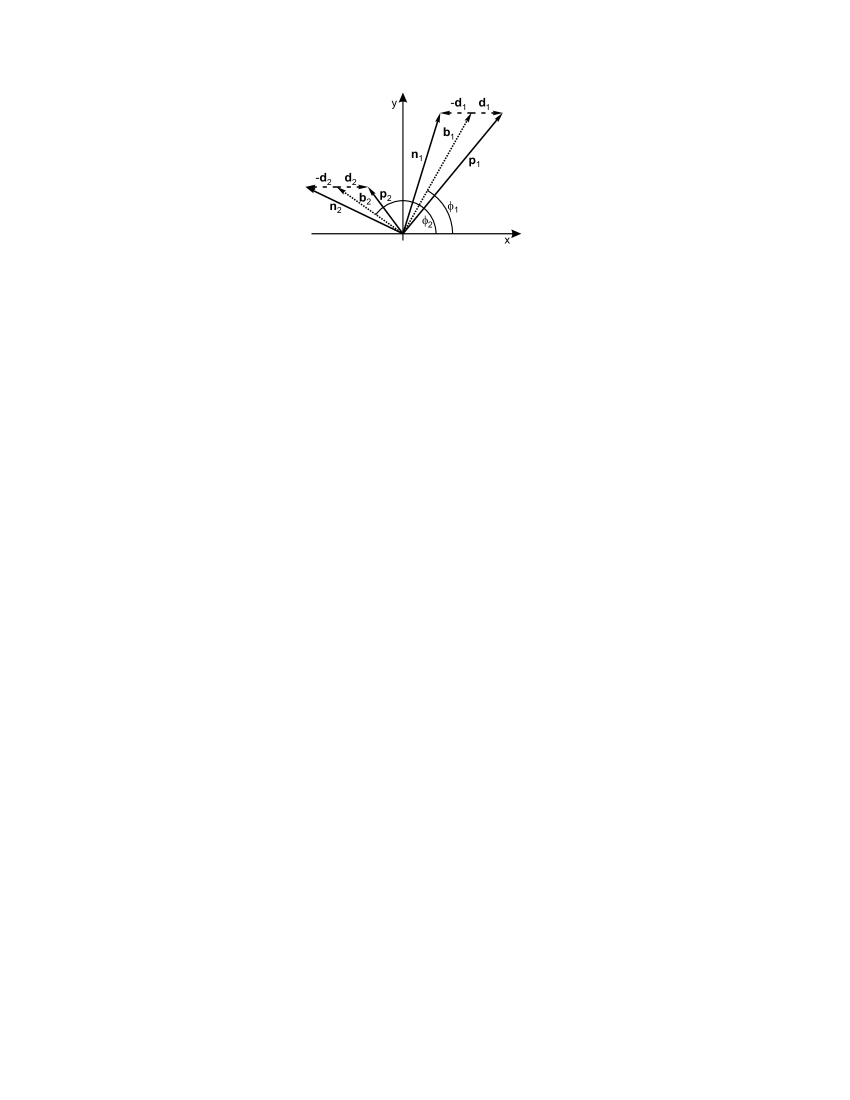
To summarize the situation, a vector diagram illustrates the case for two different frequencies and of the alternating voltage applied to the tip (Fig. 5). At a certain frequency , a background PFM signal is present. The ferroelectric domains contribute for the face and for the face to the PFM signal, both of same amplitude with a 180∘ phase shift between. This results in the measurement of for the face and for the face. It is important to note that the phasing between and is not , their amplitudes are unequal and larger than the expected value. The same considerations apply of course for any other frequency . It is obvious from Fig. 5 that although the domain contrast is the same () the PFM signals measured at different frequencies differ with respect to amplitude and phase.
In conclusion we have presented a novel analysis of the detection mechanism of ferroelectric domains with piezoresponse force microscopy. Taking into account the background PFM signal caused by the whole experimental setup, basic inconsistencies in PFM measurements concerning frequency dependence, amplitude, phasing and stiffness of the cantilever could be removed. Thus the origin of the domain contrast on PPLN could be explained solely via the converse piezoelectric effect, satisfying the generally required features of PFM imaging. The experimental data were found to be in good agreement with the theoretically expected values. Performing a quantitative analysis of the PFM signal it can thus be determined whether an observed contrast in PFM imaging can be attributed to the converse piezoelectric effect of the sample, therefore unambiguously proving the existence of domains in ferroelectric materials.
Acknowledgements.
We thank R.W. Eason for stimulating discussions. Financial support of the DFG research unit 557 and of the Deutsche Telekom AG is gratefully acknowleged.References
- (1) M. M. Fejer, G. A. Magel, D. H. Jundt, and R. L. Byer, IEEE J. Quantum Electron. 28, 2631 (1992).
- (2) N. G. R. Broderick, G. W. Ross, H. L. Offerhaus, D. J. Richardson, and D. C. Hanna, Phys. Rev. Lett. 84, 4345 (2000).
- (3) Y. Cho, K. Fujimoto, Y. Hiranaga, Y. Wagatsuma, A. Onoe, K. Terabe, and K. Kitamura, Appl. Phys. Lett. 81, 4401(2002).
- (4) E. Soergel, Appl. Phys. B to be published (2005).
- (5) M. Alexe and A. Gruverman, eds., Nanoscale Characterisation of Ferroelectric Materials (Springer, Berlin; New York, 2004) 1st ed.
- (6) P. Paruch, T. Giamarchi, and J.-M. Triscone, Phys. Rev. Lett. 94, 197601 (2005).
- (7) J. W. Burgess, J. Phys. D 8, 283 (1975).
- (8) H.-N. Lin, S.-H. Chen, S.-T. Ho, P.-R. Chen, and I.-N. Lin J. Vac. Sci. Technol. B 21, 916 (2003).
- (9) O. Kolosov, A. Gruverman, J. Hatano, K. Takahashi, and H. Tokumoto, Phys. Rev. Lett. 74, 4309 (1995).
- (10) L. M. Eng, H.-J. Güntherodt, G. Rosenman, A. Skliar, M. Oron, M. Katz, and D. Eger, J. Appl. Phys. 83, 5973 (1998).
- (11) M. Labardi, V. Likodimos, and M. Allegrini, Phys. Rev. B 61, 14390 (2000).
- (12) M. Labardi, V. Likodimos, and M. Allegrini, Appl. Phys. A 72, S79 (2001).
- (13) S. Hong, H. Shin, J. Woo, and K. No, Appl. Phys. Lett. 80, 1453 (2002).
- (14) C. Harnagea, A. Pignolet, M. Alexe, and D. Hesse, Integr. Ferroelectr. 44, 113 (2002).
- (15) C. Harnagea, M. Alexe, D. Hesse, and A. Pignolet, Appl. Phys. Lett. 83, 338 (2003).
- (16) C. Harnagea, A. Pignolet, M. Alexe, and D. Hesse, Integr. Ferroelectr. 60, 101 (2004).
- (17) D. A. Scrymgeour and V. Gopalan, Phys. Rev. B 72, 024103 (2005).
- (18) A. Agronin, M. Molotskii, Y. Rosenwaks, E. Strassburg, A. Boag, S. Mutchnik, and G. Rosenman, J. Appl. Phys. 97, 084312 (2005).
- (19) J. W. Hong, K. H. Noh, S. Park, S. I. Kwun, and Z. G. Khim, Phys. Rev. B 58, 5078 (1998).
- (20) M. Shvebelman, P. Urenski, R. Shikler, G. Rosenman, Y. Rosenwaks, and M. Molotskii, Appl. Phys. Lett. 80, 1806 (2002).
- (21) S. V. Kalinin and D. A.Bonnell, Phys. Rev. B 65, 125408 (2002).
- (22) M. Jazbinšek and M. Zgonik, Appl. Phys. B 74, 407 (2002).
- (23) M. Abplanalp, J. Fousek, and P. Günter, Phys. Rev. Lett. 86, 5799 (2001).