Magnetic relaxation of exchange biased (Pt/Co) multilayers studied by time-resolved Kerr microscopy
Abstract
Magnetization relaxation of exchange biased (Pt/Co)5/Pt/IrMn multilayers with perpendicular anisotropy was investigated by time-resolved Kerr microscopy. Magnetization reversal occurs by nucleation and domain wall propagation for both descending and ascending applied fields, but a much larger nucleation density is observed for the descending branch, where the field is applied antiparallel to the exchange bias field direction. These results can be explained by taking into account the presence of local inhomogeneities of the exchange bias field.
I Introduction
Many spin electronic devices like spin valves and tunnel junctions use the exchange bias effect to pin the magnetization of a ferromagnetic film in a particular direction by interfacial exchange interaction with an antiferromagnetic layer.
In exchange bias systems in which an antiferromagnetic (AF) layer is in contact with a ferromagnetic (F) layer, the most important effects on the magnetization are a shift of the hysteresis loop (by the exchange bias field ) and an increase of the coercivity of the F layer. Maximum exchange bias fields can be obtained by field cooling the bilayer system through the Néel temperature of the AF layer.
The microscopic phenomena leading to exchange bias have been studied for more than 40 years, since the discovery of the effect by Meiklejohn and BeanMeiklejohn and Bean (1956). A review of the main microscopic models proposed to explain exchange bias effects can be found in referencesNogués and Schuller (1999); Berkowitz and Takano (1999); Stamps (2000). Models taking into account domain walls in the AF and in the F layerMauri et al. (1987); Néel (1967); Koon (1997) and surface roughness and defectsTakano et al. (1997) predict the right order of magnitude for .
It is nowadays admitted that the exchange bias field originates from the unidirectional anisotropy associated with uncompensated interfacial spins that are pinned in the AF layer and do not reverse with the F layer spins when an external magnetic field is appliedStiles and McMichael (1999). Recent work on Co/NiO and Co/IrMn, using X-ray circular magnetic dichroism (XMCD) as a local probe Ohldag et al. (2003), has shown that only a small fraction of the uncompensated interfacial spins is pinned to the AF layer and does not switch with the magnetic field.
The increase of coercivity has been explained taking into account the thermally activated reversal of the magnetization of the AF grains when the F magnetization rotatesStiles and McMichael (1999); Camarero et al. (2003). The experimental manifestation of these thermal effects is the rotatable anisotropy exhibited by exchange bias systems, which has been recently explained theoretically by Stamps et al.Mewes and Stamps (2004) and measured by McCord et al.McCord et al. (2004).
While exchange bias in thin film systems with in-plane magnetization has been explored extensively, the study of exchange bias in systems with perpendicular anisotropy is more recent Maat et al. (2001); Hellwig et al. (2002); Kagerer et al. (2000); Liu and Adenwalla (2003); Zhou et al. (2004); Garcia et al. (2002, 2003a, 2003b); Sort et al. (2003, 2004, 2005); van Dijken et al. (2005). These systems are important from an application viewpoint as they are very promising as ultra high density magnetic recording mediaMoritz et al. (2002); Landis et al. (2000) or as storage element in high density magnetic random access memoriesNishimura et al. (2002).
Unbiased M/Co/M trilayers and multilayers with M = Pt, Pd and Au have been studied to clarify the origin of perpendicular anisotropy and its relation to enhanced interface orbital moments and anisotropiesBruno (1989); Weller et al. (1995). Magnetization dynamics in Pt/Co/Pt and Au/Co/Au trilayers has been widely investigated by Ferré et al. by Kerr microscopyFerré (2002). The variation of the domain structure with the amplitude of the applied field has been recently studied by Woodward et al.Woodward et al. (2003).
Magnetization reversal in exchange bias systems is one of the most debated subjects. Different mechanisms of magnetization reversal of the F layer for fields applied parallel and antiparallel to the direction, showing up as asymmetric hysteresis loops, have been observed by several groups for both continuous and patterned exchange biased systems with in-plane magnetizationFitzsimmons et al. (2000); Nikitenko et al. (2000); Kirilyuk et al. (2002); Radu et al. (2003); McCord et al. (2003); Blomqvist et al. (2005); Gierlings et al. (2002). Theoretical modelsBeckmann et al. (2003) have been developped to explain these observations. Experimental data on different systems with in-plane exchange bias do not however agree on the mechanisms dominating the reversal in the two hysteresis branches. For some of the systems Fitzsimmons et al. (2000); Nikitenko et al. (2000); Kirilyuk et al. (2002); Radu et al. (2003) the reversal in the ascending branch, where the field is applied parallel to the exchange bias direction, was attributed to nucleation and domain wall propagation, while the reversal in the descending branch was interpreted as due either to coherent rotation or to propagation of a larger density of domain walls. For a few other systems Blomqvist et al. (2005); McCord et al. (2003); Gierlings et al. (2002) the opposite behaviour was found. This subject is still very controversial. Nikitenko et al. Nikitenko et al. (2000), in their work on a FeNi wedge deposited on FeMn, have explained the asymmetry observed in the nucleation process in the two branches in terms of the inhomogeneity of the exchange bias field along the wedge. They also claim that this asymmetry is the evidence of remagnetization effects in the AF layer and in particular the formation of a F-AF “exchange-spring” during magnetization reversal. A recent paper by Mc Cord et al also attributes the asymmetry in the hysteresis loop to different degrees of disorder induced in the AF layer by ascending and descending fieldsMcCord et al. (2004).
Magnetization reversal in perpendicular exchange biased systems has been much less investigated. X-ray reflectivity measurements on exchange biased (Pt/Co) multilayersHellwig et al. (2002) suggested a difference in the nucleation density for the two hysteresis branches, followed by a symmetric evolution of the domain structure. Evidence for an asymmetric magnetization reversal in perpendicular exchange bias systems was also shown by our previous macroscopic Kerr measurementsGarcia et al. (2002) on a series of (Pt/Co)4/FeMn multilayers. Dynamic coercivity measurements suggested that the density of pinning centers hindering the domain wall motion was larger for the descending branch than for the ascending branch.
In a recent workRomanens et al. (2005), we studied by macroscopic Kerr effect measurements the magnetization relaxation of exchange biased (Pt/Co)5/Pt/FeMn multilayers. Our measurements revealed that the mechanisms leading to magnetization reversal strongly depend on the amplitude of the exchange bias field. As already observed for Pt/Co/Pt trilayersFerré (2002), in unbiased samples domain wall propagation dominates the magnetization reversal. In the presence of a strong exchange bias, obtained by inserting a thin Pt spacer between the Pt/Co multilayer and the FeMn film, the reversal is instead dominated by domain nucleation and a difference between the magnetization reversal for decreasing and increasing fields is observed for a sample with moderate exchange bias.
In this paper, we present a time-dependent Kerr microscopy study of the domain structure of (Pt/Co)5/Pt/IrMn multilayers. Our aim is to illustrate the mechanisms involved in the magnetization reversal and to give the first direct evidence for the existence, in exchange biased systems with perpendicular anisotropy, of a difference between the reversal mechanism in the descending and ascending branches of the hysteresis loop. Direct observation of the magnetic domain structure and its dynamics in exchange biased and unbiased (Pt/Co)5/Pt/IrMn multilayers reveal that in both cases the reversal is dominated by propagation of domain walls. A much larger density of domains is found for reversal occurring in the descending branch of the exchange biased sample. These results will be interpreted as being due to an inhomogeneous distribution of exchange bias fields over the probed sample volume.
II Experimental methods
The magnetization reversal of (Pt(2nm)/Co(0.4nm))4 and (Pt(2nm)/Co(0.4nm))5/Pt()/IrMn() multilayers was measured by time-resolved polar Kerr effect and by time-resolved polar Kerr microscopy. Four samples were investigated: sample I (Pt/Co)4; sample II ( nm; nm); sample III ( nm; nm); sample IV ( nm; nm). The samples were grown on thermally oxidized Si wafers by DC magnetron sputtering. The details of the preparation of these multilayers with perpendicular anisotropy and their magnetic properties can be found elsewhere Garcia et al. (2002, 2003b); Sort et al. (2005). The effect of the presence of a Pt spacer between the topmost Co layer and the IrMn layer on the exchange bias has been studied by Garcia et al.Garcia et al. (2003b); Sort et al. (2005). A thin Pt spacer increases the perpendicular anisotropy of the Co layer and therefore enhances the exchange bias. Maximum enhancement is observed for 0.2 to 0.4 nm of Pt. For thicker Pt spacers the exchange bias decreases and vanishes for about 2 nm of Pt. The samples, which present a weak (111) texture, were field cooled from 150∘C under a magnetic field of 0.25 T applied perpendicular to the film plane. After this thermal process, sample IV exhibits an exchange bias field perpendicular to the plane and an enhanced coercivity compared with the pure (Pt/Co)4 sample. No exchange bias nor increase of coercivity are observed for the other samples. For sample II this indicates that the IrMn layer is paramagnetic for this small thickness (2 nm), while for sample III this is due to the thickness of the Pt spacer.
Macroscopic hysteresis loops and magnetic relaxation curves were measured at room temperature using a Kerr magnetometer in a polar configuration. After saturation of the magnetization to , an opposite field is applied at time and kept constant. The temporal variation of the magnetization, while it relaxes from to , is then measured as a function of time. This is repeated for several values of the applied field, giving relaxation times from some microseconds to several seconds. For the exchange biased sample the experiment is carried out for the two branches of the hysteresis loop.
Relaxation curves can be understood qualitatively in the light of the theory first developed by Fatuzzo Fatuzzo (1962) and adapted by LabruneLabrune et al. (1989), which assumes that the reversal is thermally activated and proceeds by random nucleation of reversed domains and domain wall propagation. Magnetic relaxation is quantified by a parameter where is the domain wall velocity, the nucleation rate and the initial domain radius. It can be shown that the shape of the curve depends on the process which dominates the reversal. S-shaped curves are found when domain wall propagation dominates (), while an exponential decay is found when the nucleation dominates ().
The domain structure of the four samples was imaged by time-resolved polar Kerr microscopy Hubert and Schäfer (1998). The light source of our Kerr microscope is a Xe flash lamp with a pulse length of a few s. Light is polarised by a Glan-Thomson prism, and focused on the sample by a objective lens. In order to optimise the magneto-optical contrast, the incidence angle is nearly perpendicular to the sample surface. The polarization rotation of the reflected light due to the Kerr effect is analysed by another Glan-Thomson prism. Images with a field of view of 250 m are recorded with a 16 bits depth Peltier cooled CCD camera.
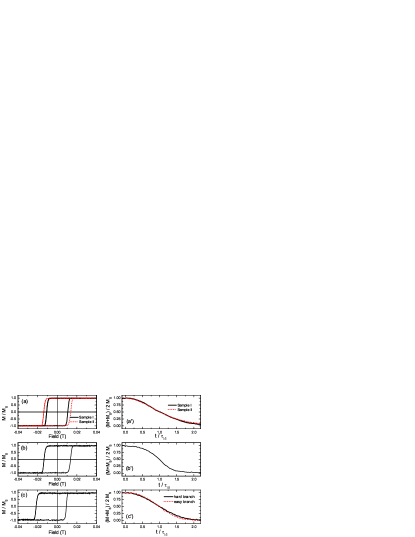
(a) and (a’): (Pt(2nm)/Co(0.4nm))4 (sample I) and (Pt(2nm)/Co(0.4nm))5/ Pt(0.4nm)/IrMn(2nm) (sample II);
(b) and (b’): (Pt(2nm)/Co(0.4nm))5/ Pt(2nm)/IrMn(5nm) (sample III);
(c) and (c’): (Pt(2nm)/Co(0.4nm))5/ Pt(0.4nm)/IrMn(5nm) (sample IV). (c’) shows reversal against the direction of the exchange bias (hard branch) and in the same direction as the exchange bias (easy branch).
The magnetic field produced by a ferrite electromagnet is applied perpendicular to the sample surface. Like for the macroscopic Kerr measurements, in order to measure magnetization relaxation the sample is first saturated with a strong enough field (), then the field is suddenly reversed and kept at a constant value.
In all the samples observed here, the magnetization reverses by nucleation of domains and propagation of domain walls. The time evolution of the domains is imaged using a pump-probe approach in which the light pulse (probe) is synchronised with the magnetic field (pump), with a tunable delay. By adjusting the delay between pump and probe, a particular step of the magnetic relaxation can be imaged. The magneto-optical contrast is strong enough to carry out single-shot measurements and these measurements clearly reveal the statistical character of the reversal. For a particular nucleation site, the nucleation probability per unit of time is given byNéel (1949); Wernsdorfer et al. (1997):
| (1) |
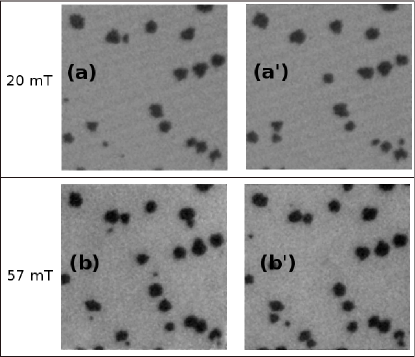
where is the attempt frequency (typically Hz) and is the energy barrier for nucleation. Due to stochastic effects, a nucleation site will not reverse at the same time for every relaxation. This is why two single shot images measured at the same delay time will not present exactly the same domain pattern (Figure 2). In order to average out this effect, measurements consisting of the average of 15 shots were also acquired. Note also that due to the presence of a distribution in the nucleation energy barriers, a larger number of domains appears when a larger field is applied.
In order to determine the domain wall velocity, we measure the time-dependence of the domain radius . As the average domains obtained for 15 shots images are almost circular, we assume that where is the domain area and is the domain perimeter. Domain area and perimeter were determined, after thresholding the original image, with a particle analysis algorithm.
III Results and discussion
Hysteresis loops (at a field sweep rate of T/s) and some typical relaxation curves measured for the multilayer samples are shown in Figure 1. Sample II with 2nm and nm and sample III with 5nm and nm have the same coercivity and no exchange bias. The values of the coercivities are very similar to those of the (Pt(2nm)/Co(0.4nm))4 sample but slightly larger, probably due to the larger number of multilayer periods which increase the perpendicular anisotropy. The same coercivity found for samples II and III is consistent with the fact that in the two cases the IrMn layer has no effect on the magnetization reversal of the F layer. For sample II the 2 nm IrMn layer is paramagnetic at room temperature and does not induce coercivity effects. For sample III the 2 nm thick Pt spacer decouples the F and AF layers.
Sample IV presents an increased coercivity and an exchange bias field of 9.5 mT. Note that the exchange bias field is smaller than the one obtained for similar samples covered with a FeMn AF layerRomanens et al. (2005). This may be related to the weaker anisotropy of the IrMn layer with respect to FeMn or to grain size effects.
The relaxation curves M(t) measured for various values of the constant applied field exhibit an S-like shape for all the unbiased samples and for fields in both the ascending and the descending branches of the hysteresis loop of sample IV. Analysis of the curves allows to obtain values of , which give an estimation of the dominating reversal process.
Values of are found for all the samples and indicate that the reversal is initiated by the nucleation of a few domains, and proceeds essentially by the propagation of domain walls. For sample IV, and are found respectively for the descending (hard) and ascending (easy) branches of the hysteresis loop. The larger value of for the easy branch indicates that a smaller number of domains is present when the field is applied parallel to the exchange bias direction.
Relaxation curves measured with different constant fields can be superposed when plotted against a reduced time (time divided by the time needed to reverse half the sample magnetization). This reveals that the reversal mechanism is the same for the range of fields investigated here.
In one of our previous papersRomanens et al. (2005), similar relaxation curves were measured for (Pt/Co)5/Pt()/FeMn. In these samples, the magnetization reversal process was shown to be strongly dependent on the thickness of the Pt spacer and therefore on the strength of the exchange bias. While S-shaped curves, indicating propagation-dominated reversal, were found in the absence of exchange bias ( nm), exponential M(t) curves indicating nucleation-dominated reversal were found for exchange biased samples (0.2 and 0.4 nm). Moreover, a larger nucleation density was found when reversal occurs opposite to the direction of the exchange bias.
In the equivalent samples studied here, the magnetic relaxation curves indicate that the density of nucleation centers for the unbiased sample III (2 nm and 5 nm) is smaller than for the exchange biased sample IV (0.4 nm), but in the two cases the reversal is largely dominated by propagation of domain walls (). This different behavior with respect to the samples with a FeMn AF layer is certainly related to the exchange bias field of sample IV ( mT) which is much smaller than that found for the previous samples with FeMn ( around 22-25 mT) in which nucleation dominated the reversal.
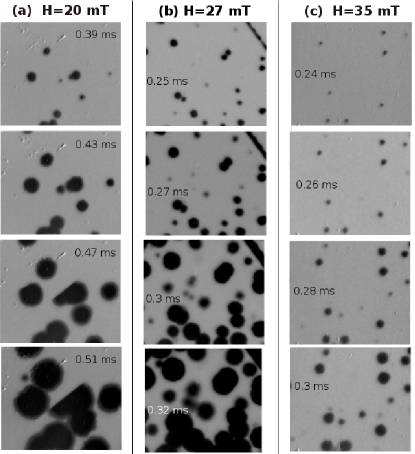
Images of the domain structure and their evolution as a function of time confirm the results of the macroscopic relaxation measurements and give a better view of the mechanisms involved in the magnetization reversal of these (Pt/Co) samples. These results are presented in Figures 2, 3 and 4. For all the samples, the images show clearly that the reversal occurs by nucleation of a relatively small number of domains, and proceeds by propagation of their domain walls. The nucleation sites, corresponding to the lowest energy barriers, are probably associated with structural defects or local weakening of the AF anisotropy. Single shot measurements, shown in Figure 2 for sample IV, clearly show that for all the fields studied here the domains are not perfectly circular, but present a jagged profile as expected for applied fields corresponding to the thermally activated regime in the presence of a narrow distribution of propagation energy barriersLyberatos and Ferré (2000). In the images resulting from the average of 15 shots, the domains appear more circular since the average domain wall speed is isotropic. Since nucleation is a statistical process governed by an Arrhenius law (Equation 1), some domains, corresponding to high energy barriers, do not appear at every relaxation. This causes the intermediate gray scales which can be seen in the images obtained from the average of 15 shots (Figure 3 and 4). Note also that due to the presence of a broad distribution of the nucleation energy barriers, a larger number of domains is activated for larger applied fields.
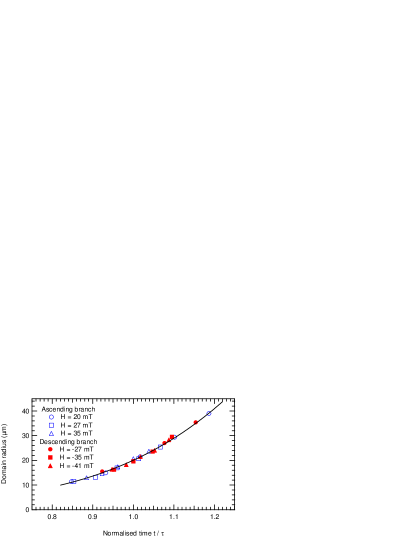
For each multishot image, we have supposed that the “mean domain” is circular and we have analyzed the radius of some domains as a function of time. The most isolated domains not overlapping too rapidly with other domains were chosen for the analysis. The time-dependence of the average domain radius is shown on Figure 5 for sample IV for several applied fields. If the domain wall velocity were depending only on the applied magnetic field, we should expect a constant speed as a function of time, and therefore a straight line for the time-dependence of the domain radius. However, data presented in Figure 5 deviate from a linear behavior and show that the domain radius expansion rate increases as the domain size increases. This behavior has been predicted by Monte Carlo simulations performed by Lyberatos and FerréLyberatos and Ferré (2000). Due to local fluctuations of the pinning strength, domains expand locally, choosing the path where the pinning is weaker, leading to a jagged shape. This increases the energy cost of domain growth because of the larger domain wall energy, thus leading to a slower domain expansion. When the domain is large enough, fluctuations average out, leading to a constant domain wall speed. The domain expansion versus time deviates from a linear behavior for all field values and all samples studied here. This indicates that for all the field values considered here the reversal of the FM layer occurs by thermal activation over a distribution of energy barriersPommier et al. (1990). This is also confirmed by the shape of the domains, which stays irregular even for the highest field values.
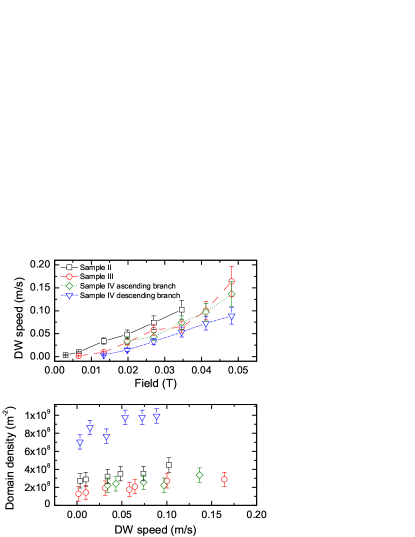
For every sample, we have extracted the domain wall velocity from the tangent of versus time for a delay corresponding to a domain radius of 20 m. Domain wall speeds are shown in Figure 6(a) as a function of the applied field . In the range of fields used here, the reversal is related to thermal activation across energy bariers, thus leading to a non linear dependence of the domain wall speed on the applied fieldPommier et al. (1990).
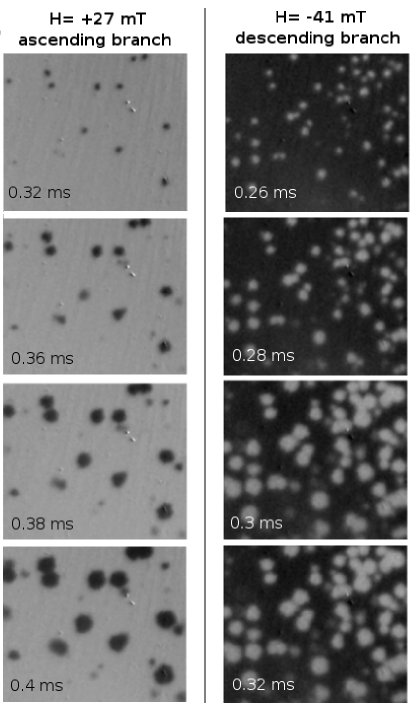
In order to compare the nucleation density in the two branches of the exchange biased sample, equivalent positive and negative effective fields have to be chosen. Since we want to study the relative importance of reversal by nucleation and propagation in the two branches, we have chosen to compare the nucleation density for applied fields leading to the same domain wall propagation speeds for the descending and ascending branches.
The density of domains shown in Figure 6(b) as a function of the domain wall speed is similar in samples I, II, III and in the ascending branch of the hysteresis loop of sample IV. However, for equivalent domain wall speeds, a much larger density of domains is found for fields applied in the descending branch of the exchange biased sample IV (Figure 4). In the region of the sample reported in Figure 4, the nucleation rate in the descending branch is about 5 times larger than that obtained for the ascending branch. Images taken with a larger field of view show that the nucleation rate is inhomogeneous, and that on average for this sample the nucleation rate in the descending branch is about 2-3 times larger than in the ascending branch. Note that due to the weak sensitivity of the shape of the relaxation curves to values when , this difference in the magnetization behavior does not show up as a clear difference between the two relaxation curves of sample IV. Note also that for the four samples the nucleation rates increase as the field increases. This points to the presence of a distribution of energy barriers.
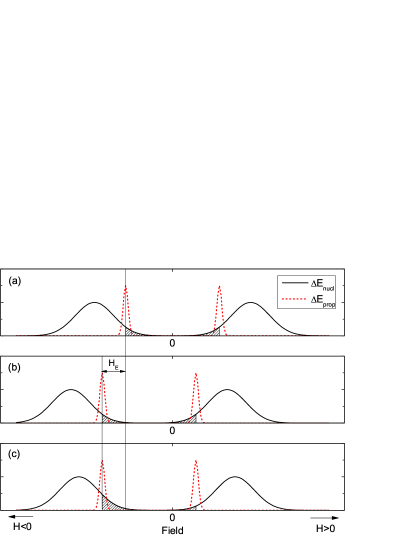
To explain the larger nucleation rate observed for the exchange biased sample when the field is applied along the descending branch, let us refer to Figure 7. The time-dependent images reported in Figure 3 and 4 show that in all the samples studied here the reversal process is initiated by the nucleation of a few reversed domains, probably at defects, and that it proceeds by domain wall propagation. The coercivity is then determined by the (average) propagation barrier . We assume that a certain distribution of nucleation/propagation barriers exists for all samples, as confirmed by the field dependence of the nucleation rate and by the jagged profile of the magnetic domains. This is schematised in Figure 7(a) for the case of an unbiased sample. The same density of domains is obviously observed for equivalent propagation fields in the two branches of the hysteresis loops (i.e. positive and negative external fields giving the same domain wall propagation speed), since the same part of the distribution is “switched on”. Let us now switch on a negative exchange bias field , which we assume to be homogeneous over the whole sample, including the locations where nucleation takes place. The exchange bias field then acts as an external field which shifts both the positive and the negative nucleation and propagation energies by a value (Figure 7(b)). This situation is similar to case (a): for equivalent propagation fields the domain density is the same in the two branches, since the relative positions of the propagation and nucleation barrier distributions have not changed. This means that a homogeneous value of the exchange bias field cannot explain the difference of nucleation density in the descending and ascending branches. Let us then assume that the exchange bias field is inhomogeneous, and that smaller values are obtained at some defects in the sample, where nucleation takes place preferentially. The shift towards negative fields induced by the local exchange bias is then smaller for the nucleation barrier distribution than for the propagation barrier distribution. As shown in Figure 7(c) this leads to an asymmetry in the relative positions of the positive and negative nucleation/propagation energies. For equivalent propagation fields a larger density of domains is then ’switched on’ for negative fields in the descending branch of the hysteresis loops, in agreement with our experimental data.
In summary, we have carried out Kerr microscopy measurements on unbiased and exchange biased Pt/Co multilayers. Single shot measurements show that in the range of fields used here, the domains have a jagged shape as expected for thermally activated reversal in a system caracterised by a distribution of propagation energy barriers. The non-linearity of the domain wall growth as a function of time can be explained in terms of the distribution of propagation barriers. The main result of this study is the asymmetry of the reversal process in the descending and ascending branches of the hysteresis loop. A larger nucleation density is observed for external fields applied along the descending branch. This asymmetry in the reversal mechanism can be related to the presence of locations in the sample where the exchange bias field is smaller than the average. Local weakening of the nucleation barriers can be due to structural defects in the F layer which weaken the interface coupling. It may also be due to inhomogeneities in the AF layer, which give rise locally to smaller uniaxial anisotropy and therefore easier AF domain wall formation and nucleation in the descending branch. The exact origin of the exchange bias inhomogeneities is not relevant for our model.
Note that this interpretation of the asymmetric reversal mechanism could explain the asymmetry of the reversal mechanisms observed by polarised neutron reflectivity (PNR) measurements Fitzsimmons et al. (2000); Radu et al. (2003). The larger magnetization component perpendicular to the applied field, observed by PRN for the descending branch, can be interpreted as being due to a larger domain wall density and therefore to a larger nucleation rate for fields against the exchange bias direction. Our results go also in the same direction as the Kerr microscopy work of Kirilyuk et al.Kirilyuk et al. (2002) who observed smaller magnetic domains in the descending branch.
Acknowledgements.
This work was partially supported by the European Community through the RTN grant NEXBIAS. Financial support from the PICASSO program, project HF2003-0173, is gratefully acknoledged.References
- Meiklejohn and Bean (1956) W. H. Meiklejohn and C. P. Bean, Phys. Rev. 102, 1413 (1956).
- Nogués and Schuller (1999) J. Nogués and I. K. Schuller, J. Magn. Magn. Mat. 192, 203 (1999).
- Berkowitz and Takano (1999) A. E. Berkowitz and K. Takano, J. Magn. Magn. Mat. 200, 552 (1999).
- Stamps (2000) R. L. Stamps, J. Phys. D 35, R247 (2000).
- Mauri et al. (1987) D. Mauri, H. C. Siegmann, P. S. Bagus, and E. Kay, J. Appl. Phys. 62, 3047 (1987).
- Néel (1967) L. Néel, Ann. Phys. (Paris) 2, 61 (1967).
- Koon (1997) N. C. Koon, Phys. Rev. Lett. 78, 4865 (1997).
- Takano et al. (1997) K. Takano, R. H. Kodama, A. E. Berkowitz, W. Cao, and G. Thomas, Phys. Rev. Lett. 79, 1130 (1997).
- Stiles and McMichael (1999) M. D. Stiles and R. D. McMichael, Phys. Rev. B 59, 3722 (1999).
- Ohldag et al. (2003) H. Ohldag, A. Scholl, F. Nolting, E. Arenholz, S. Maat, A. T. Young, M. Carey, and J. Stöhr, Phys. Rev. Lett. 91, 017203 (2003).
- Camarero et al. (2003) J. Camarero, Y. Pennec, J. Vogel, S. Pizzini, M. Cartier, F. Fettar, F. Ernult, A. Tagliaferri, N B. Brookes, and B. Dieny, Phys. Rev. B 67, 020413(R) (2003).
- Mewes and Stamps (2004) T. Mewes and R. Stamps, Appl. Phys. Lett. 84, 3840 (2004).
- McCord et al. (2004) J. McCord, R. Mattheis, and D. Elefant, Phys. Rev. B 70, 094420 (2004).
- Maat et al. (2001) S. Maat, K. Takano, S. S. P. Parkin, and E. E. Fullerton, Phys. Rev. Lett. 87, 087202 (2001).
- Hellwig et al. (2002) O. Hellwig, S. Maat, J. B. Kortright, and E. E. Fullerton, Phys. Rev. B 65, 144418 (2002).
- Kagerer et al. (2000) B. Kagerer, C. Binek, and W. Kleemann, J. Magn. Magn. Mat. 217, 139 (2000).
- Liu and Adenwalla (2003) Z. Y. Liu and S. Adenwalla, J. Appl. Phys. 94, 1105 (2003).
- Zhou et al. (2004) S. M. Zhou, L. Sun, P. C. Searson, and C. L. Chien, Phys. Rev. B 69, 024408 (2004).
- Garcia et al. (2002) F. Garcia, J. Moritz, F. Ernult, S. Auffret, B. Rodmacq, B. Dieny, J. Camarero, Y. Pennec, S. Pizzini, and J. Vogel, IEEE Trans. Magn. 38, 2730 (2002).
- Garcia et al. (2003a) F. Garcia, F. Fettar, S. Auffret, B. Rodmacq, and B. Dieny, J. Appl. Phys. 93, 8397 (2003a).
- Garcia et al. (2003b) F. Garcia, J. Sort, B. Rodmacq, S. Auffret, and B. Dieny, Appl. Phys. Lett. 83, 3537 (2003b).
- Sort et al. (2003) J. Sort, B. Rodmacq, S. Auffret, and B. Dieny, Appl. Phys. Lett. 83, 1800 (2003).
- Sort et al. (2004) J. Sort, B. Dieny, M. Fraune, C. Koenig, F. Lunnebach, B. Beschoten, and G. Güntherodt, Appl. Phys. Lett. 84, 3696 (2004).
- Sort et al. (2005) J. Sort, V. Baltz, F. Garcia, B. Rodmacq, and B. Dieny, Phys. Rev. B 71, 054411 (2005).
- van Dijken et al. (2005) S. van Dijken, J. Moritz, and J. M. D. Coey, J. Appl. Phys. 97, 063907 (2005).
- Moritz et al. (2002) J. Moritz, B. Dieny, J. P. Nozières, S. Landis, A. Lebib, and Y. Chen, J. Appl. Phys. 91, 7314 (2002).
- Landis et al. (2000) S. Landis, B. Rodmacq, and B. Dieny, Phys. Rev. B 62, 12271 (2000).
- Nishimura et al. (2002) N. Nishimura, T. Hirai, A. Koganei, T. Ikeda, K. Okano, Y. Sekiguchi, and Y. Osada, J. Appl. Phys. 91, 5246 (2002).
- Bruno (1989) P. Bruno, Phys. Rev. B 39, R865 (1989).
- Weller et al. (1995) D. Weller, J. Stöhr, R. Nakajima, A. Carl, M. G. Samant, C. Chappert, R. Mégy, P. Beauvillain, P. Veillet, and G. A. Held, Phys. Rev. Lett. 75, 3752 (1995).
- Ferré (2002) J. Ferré, Spin Dynamics in confined Magnetic Structures I (Springer, Berlin, 2002), p. 127.
- Woodward et al. (2003) R. C. Woodward, A. M. Lance, R. Street, and R. L. Stamps, J. Appl. Phys. 93, 6567 (2003).
- Fitzsimmons et al. (2000) M. R. Fitzsimmons, P. Yashar, C. Leighton, I. K. Schuller, J. Noguès, C. F. Majkrzak, and J. A. Dura, Phys. Rev. Lett. 84, 3986 (2000).
- Nikitenko et al. (2000) V. I. Nikitenko, V. S. Gornakov, A. J. Shapiro, R. D. Shull, K. Liu, S. M. Zhou, and C. L. Chien, Phys. Rev. Lett. 84, 765 (2000).
- Kirilyuk et al. (2002) A. Kirilyuk, T. Rasing, H. Jaffrès, D. Lacour, and F. Nguyen Van Dau, J. Appl. Phys. 81, 7745 (2002).
- Radu et al. (2003) F. Radu, M. Etzkorn, R. Siebrecht, T. Schmitte, K. Westerholt, and H. Zabel, Phys. Rev. B 67, 134409 (2003).
- McCord et al. (2003) J. McCord, R. Schäfer, R. Mattheis, and K.-U. Barholz, J. Appl. Phys. 93, 5491 (2003).
- Blomqvist et al. (2005) P. Blomqvist, K. M. Krishnan, and H. Ohldag, Phys. Rev. Lett. 94, 107203 (2005).
- Gierlings et al. (2002) M. Gierlings, M. J. Prandolini, H. Fritzsche, M. Gruyters, and D. Riegel, Phys. Rev. B 65, 092407 (2002).
- Beckmann et al. (2003) B. Beckmann, U. Nowak, and K. D. Usadel, Phys. Rev. Lett. 91, 187201 (2003).
- Romanens et al. (2005) F. Romanens, S. Pizzini, J. Sort, F. Garcia, J. Camarero, F. Yokaichiya, Y. Pennec, J. Vogel, and B. Dieny, Eur. Phys. J. B 45, 185 (2005).
- Fatuzzo (1962) E. Fatuzzo, Phys. Rev. 127, 1999 (1962).
- Labrune et al. (1989) M. Labrune, S. Andrieu, F. Rio, and P. Bernstein, J. Magn. Magn. Mat. 80, 211 (1989).
- Hubert and Schäfer (1998) A. Hubert and R. Schäfer, Magnetic Domains : The Analysis of Magnetic Microstructures (Springer-Verlag, 1998).
- Néel (1949) L. Néel, Ann. Geophys. 5, 99 (1949).
- Wernsdorfer et al. (1997) W. Wernsdorfer, E. B. Orozco, K. Hasselbach, A. Benoit, B. Barbara, N. Demoncy, A. Loiseau, H. Pascard, and D. Mailly, Phys. Rev. Lett. 78, 1791 (1997).
- Lyberatos and Ferré (2000) A. Lyberatos and J. Ferré, J. Phys. D 33, 1060 (2000).
- Pommier et al. (1990) J. Pommier, P. Meyer, G. Pénissard, J. Ferré, P. Bruno, and D. Renard, Phys. Rev. Lett. 65, 2054 (1990).