Elongation/Compaction of Giant DNA Caused by Depletion Interaction with a Flexible Polymer
Abstract
Structural changes in giant DNA induced by the addition of the flexible polymer PEG were examined by the method of single-DNA observation. In dilute DNA conditions, individual DNA assumes a compact state via a discrete coil-globule transition, whereas in concentrated solution, DNA molecules exhibit an extended conformation via macroscopic phase segregation. The long-axis length of the stretched state in DNA is about times larger than that of the compact state. Phase segregation at high DNA concentrations occurs at lower PEG concentrations than the compaction at low DNA concentrations. These opposite changes in the conformation of DNA molecule are interpreted in terms of the free energy, including depletion interaction.
I Introduction
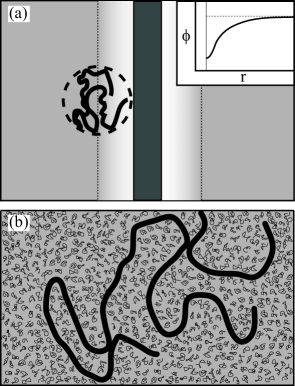
It is well known that semiflexible polymers tend to segregate in the presence of non-adsorbing flexible polymers, through so-called depletion interactionAsakura and F.Oosawa (1954); Asakura and Oosawa (1958); Joanny et al. (1979); Lubensky (1997); Tuinier et al. (2003); Netz and Andelman (2003). A schematic representation is shown in Fig.1. We consider a flexible polymer that is much smaller than the persistence lengthGrosberg and Khokhlov (1994) of the semiflexible polymer. In this case, the semiflexible polymer can be treated as a hard cylinder at the scale of the flexible polymer and the flexible polymer is depleted from the region of a semiflexible polymer chain( Fig.1(a)). This region is called the depletion layer. When the semiflexible polymer segments come close to each other, the total depletion layer decreases and the volume occupied by flexible polymers increases. The presence of the flexible polymer causes attractive force that arises from the entropy among the semiflexible polymer segments. The strength of this attractive force is identical regardless of intra-molecular or inter-molecular interaction , and only depends on the steric configuration of the interacting segments. ( Fig.1(b)).
It has been reported that the formation of a liquid crystalline phase from a concentrated solution of short DNA fragments can be induced by addition of the flexible polymer PEG, where DNA molecules are extended and aligned parallel, accompanied by macroscopic phase segregationJordan et al. (1971); Livolant and Leforestier (1996); Strey et al. (1997); Leonard et al. (2001); et al. (2002). In contrast to the extension effect by depletion, it is also known Lerman (1971); Laemnli (1978); Minagawa et al. (1994); Yoshikawa and Matsuzawa (1995) that a compact state of DNA is generated by the addition of PEG. Thus, previous reports have indicated opposite effects of a flexible polymer (either extension or compaction of DNA molecules), depending on the experimental conditions on the individual articles. The purpose of the present study was to obtain a comprehensive view of macroscopic phase segregation and the compaction of a semiflexible polymer by the addition of a flexible polymer.
II Experimental
Bacteriophage T4 DNA (166 kbp, contour length 57 m) was purchased from Nippon Gene (Tokyo, Japan). The fluorescent dye Quinolinium, 1,19-[1,3-propanediylbis [(dimethyliminio)- 3,1-propanediyl]] bis [4-[(3-methyl-2(3H)-benzoxazolylidene)- methyl]]-, tetraiodide (YOYO-1) was obtained from Molecular Probes (Eugene, Oregon). Polyethylene glycol (PEG) 6000 ( average molecular weight 8200) was obtained from Kishida Chemical Co., Ltd. (Osaka, Japan). Analytical-grade NaCl was obtained from Nacalai Tesque (Kyoto, Japan).
All procedures were performed at room temperature in Tris 100 mM EDTA 10 mM buffer(TE buffer pH 8.0). First, PEG and NaCl were dissolved in a microtube. The concentration of PEG was adjusted as desired. The final concentration of NaCl was 100 mM in all experiments. T4 DNA solution was mixed to give a final concentration of 20 (A) or 0.1 (B) in the microtube. Less than 1 % of T4 DNA in (A) was stained with YOYO-1. This partially stained solution was mixed with a solution free from dye or solutions that had already been equilibrated with dye. In contrast, the T4 DNA molecules in (B) were uniformly stained. The ratio between labeled DNA and fluorescent dye was [labeled DNA(bp)]/[YOYO-1]=5 in molar units. It has been confirmed that the contour length and persistence length remain essentially constant, i.e., the effect of dye staining is negligibleYoshinaga et al. (2001). The (A) samples were gently shaken and allowed to stand for a few hours. After this rest period, the samples were gently vortexed. The (B) samples were allowed to stand for 24 hours after mixing.
Fluorescent microscopic images of DNA and polarization microscopic images of the same regions were observed using a BX 60 (Olympus, Japan) fluorescence and polarization microscope with a color CCD camera (Watec, Japan). The fluorescence images of the DNA chain were observed using an Axiovert 200 fluorescence microscope (Carl Zeiss, Germany) with a high-resolution EBCCD camera (Hamamatsu, Japan).
III Results and Discussion
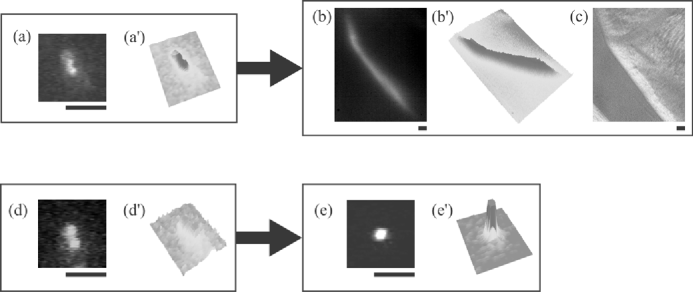
Figure 2 shows typical fluorescence images of individual DNA molecules. At a low PEG concentration, DNA molecules assume a random coil state regardless of the DNA concentration ( Fig.2(a), (d)). With an increase in the PEG concentration, DNA molecules at a high DNA concentration show an elongated conformation ( Fig.2(b)), accompanied by macroscopic phase segregation between PEG-rich and DNA-rich phases. The long-axis length of an elongated DNA chain approximately corresponds to its contour length; In Fig.2(b), the full length is about 50 . Figure 2(c) shows a polarization microscopy image of the same region as in Fig.2(b). The DNA molecule in (B) assumes a compact state through the coil-globule transition ( Fig.2 (e)). Note that the long axis of an elongated DNA chain is about times larger than that in the compact state.
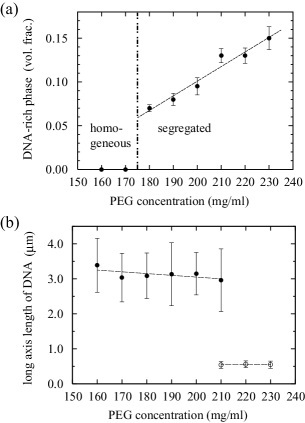
Figure 3 (a) shows the dependence of the volume fraction of DNA inside the generated DNA-rich phase on the PEG concentration. The lowest PEG concentration that induced phase segregation was 180 mg/ml( Fig.3(a)). The volume fraction of DNA inside the generated DNA-rich phase appears to increase with an increase in the PEG concentration. The line in Fig.3 (a) is fitted by the least-squares method with a PEG concentration within the range of 180 to 230 mg/ml and the gradient is ca. 0.002. can be calculated by considering that all of the DNA molecules are transferred to the DNA-rich phase.
Figure 3 (b) shows the distribution of the long-axis length of DNA molecules through the coil-globule transition versus the PEG concentration. Closed and open circles show the average long-axis length of DNA molecules in the coil and globule states, respectively. DNA molecules in both compact and coiled states were observed at a PEG concentration of around 210 mg/ml and the number of DNA molecules in the compact state was approximately twice that in the coil state.
Note that the critical PEG concentration for phase segregation was lower than that for the coil-globule transition. This result means that the elongated state of DNA molecules is more stable than the compact state if the DNA concentration is high enough.
Let us discuss both transitions in terms of free energy. The total free energy variance per DNA chain can be written as
| (1) |
where describes the gain in the decrease in the depletion layer for PEG per DNA chain. describes the elastic part of the free energy for a single DNA chain. For simplicity, the electrostatic and van der Waals interactions among DNA, PEG and ions are neglected in eq.(1). These miscellaneous effects are considered to be incorporated in the effective elastic energy.
can be written approximately asGrosberg and Khokhlov (1994); Vasilevskaya et al. (1995)
| (2) |
where T is temperature, k is the Boltzmann constant, is the variation in the depletion layer for PEG around a DNA molecule, is the elementary spacing in the Flory-Huggins model which was defined to be equal to the width of the DNA Kuhn segment, is the volume fraction of PEG, and is the average degree of polymerization of PEG molecules. In eq.(2), the translational entropy of water is neglected, since the effective volume occupied by water may not change greatly. We also treat as a constant through the transitions because is much smaller than the total volume of the system.
may be approximately given asAsakura and Oosawa (1958)
| (3) |
where L is the contour length of a DNA chain and is the radius of gyration of a PEG molecule. (: Flory exponent, : PEG monomer size). The first term on the right-hand side is the volume occupied by a DNA molecule after the transition. The second term represents the depletion layer for the center of mass of PEG around a DNA molecule before the transition. For analytical treatment, the depletion layer before the transition is represented as a step function, although the actual depletion layer will not be so simple because of the continuous PEG concentration profile.
Following Ref. Grosberg and Khokhlov (1994), the elastic free energy asymptotically reads
| (4) | |||||
where is the expansion factor of the DNA coil with respect to its ideal size, is the long-axis length of a DNA molecule, is the number of Kuhn segments and is the Kuhn length of a DNA chain.
In the case of compaction, can be written as which is a toroidal shape of compact DNAUbbink and Odjik (1996).
| (5) |
In the present paper, the constants are set as = 2 , =0.38 Marsh (2004), =0.6, =186, and =57 . From eq.(2), (4) and (5), , and are calculated as in Table 1. In the case of macroscopic phase segregation, was -1.2, the critical PEG concentration was 180 mg/ml () and the volume fraction was from our experiment. Therefore, was calculated to be about -900 kT. Since was about , is evaluated to be about +700 kT. In the coil-globule transition, it has been determined by measurement of the hydrodynamic radius Yoshikawa and Matsuzawa (1995) and a MD simulationNoguchi et al. (1996) that the compact state of a DNA molecule is completely packed. Thus, we consider to be a good approximation. Thus, is calculated as -3.6 and the critical PEG concentration is 210 mg/ml(). is estimated to be kT. Based on electron-microscopic observationLaemnli (1978), the long-axis length of toroidal DNA is roughly 70 . Consequently, and are deduced to be +2000 kT and +2300 kT, respectively. Despite this simple estimation, it becomes clear that the gain in free energy involving PEG and the loss involving the DNA conformation are on the same order in both transitions.
In summary, we studied both the segregation and compaction of giant DNA induced by depletion interaction. There is a marked difference in the critical concentrations of flexible polymer needed to cause these transitions and the essence of this difference can be interpreted in terms of the change in free energy with depletion interaction.
Acknowledgements.
This work was supported by a Grant-in-Aid for Scientific Research in Priority Areas “System Cell Engineering by Multi-scale Manipulation” (No. 17076007) from the Ministry of Education, Culture, Sports, Science and Technology of Japan.References
- Asakura and F.Oosawa (1954) S. Asakura and F.Oosawa, J. Chem. Phys. 33, 183 (1954).
- Asakura and Oosawa (1958) S. Asakura and F. Oosawa, J. Polym. Sci. 33, 183 (1958).
- Joanny et al. (1979) J. F. Joanny, L. Leibler, and P. G. D. Gennes, J. Polym. Sci. Polym. Phys. Ed. 17, 1073 (1979).
- Lubensky (1997) T. C. Lubensky, Solid State Communications 102, 187 (1997).
- Netz and Andelman (2003) R. R. Netz and D. Andelman, Phys. Rep. 380, 1 (2003).
- Tuinier et al. (2003) R. Tuinier, J. Rieger, and C. G. de Kruif, Advances in Colloid and Interface Science 103, 1 (2003).
- Grosberg and Khokhlov (1994) A. Y. Grosberg and A. R. Khokhlov, Statistical Physics of Macromolecules (AIP PRESS, 1994).
- Jordan et al. (1971) C. F. Jordan, L. S. Lerman, and J. Venable, Nature New Biology 236, 67 (1971).
- Livolant and Leforestier (1996) F. Livolant and A. Leforestier, Prog. Polym. Sci. 21, 1115 (1996).
- Strey et al. (1997) H. H. Strey, V. A. Parsegian, and R. Podgornik, Phys. Rev. Lett 78, 895 (1997).
- Leonard et al. (2001) M. Leonard, H. Hong, and H. H. S. N.Easwar, Polymer 42, 5823 (2001).
- et al. (2002) H. M. H. et al., Phys. Rev. Lett. 89, 018303 (2002).
- Lerman (1971) L. S. Lerman, Proc. Nat. Acad. Sci. USA 68, 1886 (1971).
- Laemnli (1978) U. K. Laemnli, Proc. Nat. Acad. Sci. USA 72, 4288 (1978).
- Minagawa et al. (1994) K. Minagawa, Y. Matsuzawa, K. Yoshikawa, A. R. Khokhlov, and M. Doi, Biopolymers 34, 555 (1994).
- Yoshikawa and Matsuzawa (1995) K. Yoshikawa and Y. Matsuzawa, Physica D 84, 220 (1995).
- Yoshinaga et al. (2001) N. Yoshinaga, T. Akitaya, and K. Yoshikawa, B.B.R.C. 286, 264 (2001).
- Vasilevskaya et al. (1995) V. V. Vasilevskaya, A. R. Kohokhlov, Y. Matsuzawa, and K. Yoshikawa, JCP 102, 6595 (1995).
- Ubbink and Odjik (1996) J. Ubbink and T. Odjik, Eruophys. Lett. 33, 353 (1996).
- Marsh (2004) D. Marsh, Biophysical Journal 86, 2630 (2004).
- Noguchi et al. (1996) H. Noguchi, S. Saito, S. Kidoaki, and K. Yoshikawa, Chem. Phys. Lett. 261, 527 (1996).
| 111volume change in the depletion layer for PEG around a DNA molecule. | 222volume fraction of PEG | 333free energy change owe to the depletion interaction per single DNA chain | 444long-axis length of DNA after the transition. | 555free energy change of elastic term single DNA chain, estimated from the volume change. | 666free energy change of elastic term by the consideration of toroidal compact state in DNA(Ref.Ubbink and Odjik (1996).) | |
| elongation | -1.2 | 0.14 | -900 | 5104 | +700 | - |
| compaction | -3.6 | 0.16 | -3000 | 70 Laemnli (1978) | +2000 | +2300 |
FIG. 1: Schematic representation on the mixed solution of semiflexible and flexible polymers. (a) Microscopic view on a flexible polymer chain around semiflexible polymer. Near the surface of the semiflexible polymer, the volume fraction of flexible polymer is lower than that in the bulk. Inset: Schematic density profile of the flexible polymer, where is the volume fraction of the flexible polymer and r is the distance from the surface of the semiflexible polymer. (b) Corse-grained view on the conformation of a semiflexible polymer in the solution of flexible polymer chains.
FIG.2: Conformational change of single DNA by the addition of PEG. All scale bars represent 3 . (a) Selectively stained DNA molecule with a coiled conformation in concentrated DNA solution (DNA 20 g/ml, PEG 170 mg/ml, NaCl 100 mM). (b) Selectively stained DNA molecule with a stretched conformation in a liquid crystalline phase, under the condition of phase segregation between a DNA-rich phase and a PEG-rich phase (DNA 20 g/ml, PEG 230 mg/ml, NaCl 100 mM). (c) Polarization microscopy image on the same region as in (b). (d) Coiled DNA molecule in dilute DNA solution (DNA 0.1 g/ml, PEG 170 mg/ml, NaCl 100 mM). (e) Compact DNA in dilute DNA solution (DNA 0.1 g/ml, PEG 230 mg/ml, NaCl 100 mM). (a’), (b’), (c’) and (d’) show fluorescence-intensity distributions for (a), (b), (c) and (d), respectively.
FIG.3: (a) Phase behavior of DNA-PEG solution represented as the volume fraction of the DNA-rich phase, the zero volume fraction corresponds to a homogeneous solution (T4 DNA 20 g/ml, NaCl 100 mM). Below of 170 mg/ml of PEG, the system exhibits homogeneous state. Above 180 mg/ml of PEG, a liquid crystalline DNA phase was induced accompanied by phase segregation. (b) Conformational change of single DNA. The dependence of the average long-axis length is shown together with the standard deviation (T4 DNA 0.1 g/ml, NaCl 100 mM). The coiled and compact states of DNA molecules coexisted at 210 mg/ml of PEG.