Nonexponential Relaxations in a Two-Dimensional Electron System in Silicon
Abstract
The relaxations of conductivity have been studied in a strongly disordered two-dimensional (2D) electron system in Si after excitation far from equilibrium by a rapid change of carrier density at low temperatures . The dramatic and precise dependence of the relaxations on and strongly suggests (a) the transition to a glassy phase as , and (b) the Coulomb interactions between 2D electrons play a dominant role in the observed out-of-equilibrium dynamics.
pacs:
78.55.Qr, 71.30.+h, 71.27.+a, 73.40.QvThe interplay of strong electronic correlations and disorder is believed to be responsible for a plethora of new phenomena occurring in many complex materials in the region of the metal-insulator transition (MIT) Mir . Even though glassy behavior of electrons is emerging as one of the key concepts, electron or Coulomb glasses egl in general remain largely unexplored. Slow, nonexponential relaxations characteristic of glassy dynamics have been observed in doped semiconductors ear , strongly disordered InOx films fil ; fil ; fil , and various granular metals fil , but the regime near the MIT has been even less studied. In many complex systems, the MIT is accompanied by changes in magnetic or structural symmetry, which complicates the situation even further. On the other hand, low-density two-dimensional (2D) electron and hole systems in semiconductor heterostructures, where the MIT has been a subject of great interest and debate 2DM , represent particularly appealing model systems for studying the effects of interactions and disorder in a controlled and systematic way.
Our recent resistance noise measurements on a 2D electron system (2DES) in Si SBP ; JJP ; JJP have shown signatures of glassy behavior at densities lower than some well-defined density , such that ( – the critical density for the MIT). In particular, by reducing , it was observed that the dynamics suddenly and dramatically slowed down at , and there was an abrupt change to a correlated statistics, consistent with the hierarchical picture of glassy dynamics. These features were shown to persist even when the 2DES is fully spin polarized JJP , indicating that the charge degrees of freedom are responsible for the anomalous noise behavior. Similar results were obtained in both highly disordered samples SBP and those with relatively low disorder JJP ; JJP , with in the latter case. In addition, for , the conductivity of the 2DES was found to depend on the cooling procedure SBP , another characteristic of glassy systems. We note that, even though is in the metallic regime (i. e. ), is so small that ( – Fermi wave vector, – mean free path) kfl , which violates the Mott limit for the metallic transport in 2D. Hence the noise studies SBP ; JJP ; JJP as well as this work probe the regime of strong disorder that encompasses both the insulating phase and the unconventional conducting regime where . Such “bad metals” include a variety of strongly correlated materials with unusual properties bad .
Here we report a systematic study of the relaxations (i.e. time dependence) of in the same highly disordered 2DES in Si after applying a large perturbation at different and . The perturbation consists of a large, rapid change of , controlled by the gate voltage . For , we find that, on short enough time scales, obeys a nonexponential, Ogielski form Ogi , found in some other systems Pap just above the glass transition. The associated relaxation time diverges as , while its density dependence provides strong evidence that the observed out-of-equilibrium behavior is dominated by the Coulomb interactions between 2D electrons. After a sufficiently long time , relaxes exponentially to its equilibrium value. The corresponding characteristic time as , suggesting that the glass transition temperature . The most peculiar feature of the relaxation is that the system equilibrates only after it first goes farther away from equilibrium.
Measurements were carried out on a 2DES in Si metal-oxide-semiconductor field-effect transistors (MOSFETs) with a large amount of disorder (the peak mobility 0.06 m2/Vs at 4.2 K with the applied back-gate bias of V). The sample dimensions (– length, – width) were m2 and m2. Both samples exhibited the same behavior and, in general, they were almost identical to the samples used previously in noise measurements SBP . The data obtained on a m2 sample are presented in detail below. For this sample, cmV; cm and cm, where was determined from noise and from measurements on both metallic and insulating sides (see Refs. SBP, ; JJP, ). The samples and the standard ac lock-in technique (typically 13 Hz) that was used to measure have been described in more detail elsewhere SBP .
The experiment consists of the following procedure. The sample is cooled from 10 K to the measurement temperature with an initial gate voltage . Then, at , the gate voltage is switched rapidly (within 1 s) to a final value , and measured. In general, the results did not depend on any of the following: initial temperature, as long as it was K; ; the cooling time, which was varied between 30 minutes and 10 hours; the time the sample was kept at 10 K (from 5 minutes to 8 hours); the time the sample spent at the measurement before was changed (from 5 minutes to 8 hours). Figure 1 shows a typical
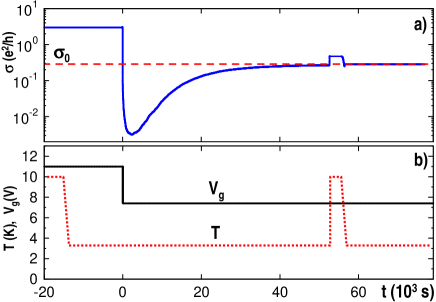
experimental run with exhibiting a rapid ( s) initial drop followed by a slower relaxation RC . After going through a minimum, increases and approaches a value . A subsequent warm-up to K and a cool down to the same measurement K, while keeping the gate voltage fixed at , shows that represents the equilibrium conductivity corresponding to the given and . It is interesting that, even though initially it drops to a value close to , first goes away from equilibrium before it starts approaching again.
At the end of the run, the sample is warmed up to 10 K, gate voltage changed back to the same , and the experiment is repeated at a different for the same . Figure 2
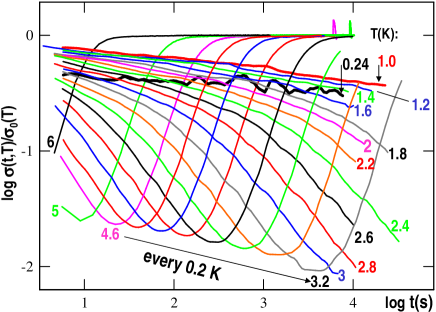
shows the relaxations of conductivity, , normalized to the corresponding for different . The minimum in shifts to longer times with decreasing until, at sufficiently low , it falls out of the time window of the measurements. The relaxations obviously become slower with decreasing but the shape of the relaxation curves remains similar, suggesting that they might be collapsed onto a single scaling function.
First we focus on times just before the minimum in . Figure 3(a) shows that the data can be described by a scaling form , such that () and , . We note that this stretched exponential dependence spans more than 4 orders of magnitude in , and 2 orders in . At shorter times, most easily observable at low within our experimental time window, the stretched exponential function crosses over to a slower, power-law dependence [Fig. 3(b)] log . In this regime, of course, it is also possible to collapse the data but, obviously, not in an unambiguous way. Both power-law and stretched exponential relaxations are considered to be typical signatures of glassy behavior, and reflect the existence of a broad distribution of relaxation times. In spin glasses, for example, the so-called Ogielski function Ogi , , describes the relaxations over a wide range of and above Pap . Our results [Figs. 3(a), (b)] suggest
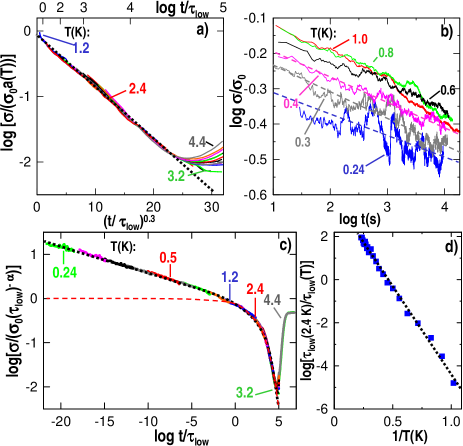
that the Ogielski function might be a good candidate to describe also our data over the entire and range. Indeed, Fig. 3(c) shows that all the data are consistent with the Ogielski relaxation over about 25 orders of magnitude in . Since it was impractical to perform measurements below 1 K long enough to obtain a substantial overlap between different curves, we limit our analysis of to the K range, where the data collapse well. Even within this relatively narrow range of , the scaling parameter varies over 7 orders of magnitude [Fig. 3(d)], and the Arrhenius function, ( s-1, K for V), provides an excellent fit to the data znu .
The experiment was repeated for different values of , allowing us to map out the density dependence of the exponents and , and of the parameter . The results were obtained either by fitting the data to the appropriate functional form at a fixed [as in Figs. 3(a) and (b)] or from the scaling of the different data and the fit to the Ogielski function [as in Fig. 3(c)]. Figure 4 shows that the two methods yield very similar
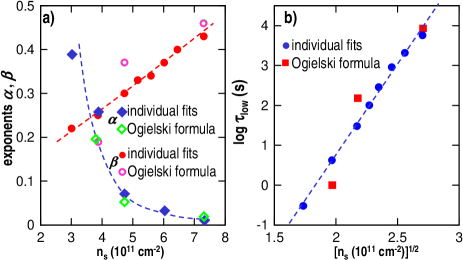
results. In particular, we find that decreases with , and vanishes at cm, i. e. exactly where the onset of glassy dynamics was found to take place from the noise measurements SBP . At the same time, the exponent grows with increasing , indicating that the relaxations become faster, as expected. For all in this range, with K independent of , but the prefactor has a very strong density dependence, [Fig. 4(b)]. Since the ratio of the Fermi energy to Coulomb energy in 2D systems 2DM ; EFc , our result strongly suggests that Coulomb interactions between 2D electrons play a dominant role in the observed slow dynamics. As is increased further, beyond , there are still some visible relaxations, albeit with an amplitude that is too small to make reliable fits. In fact, the amplitude of the relaxations decreases with , and vanishes when cm, where e, i. e. . Therefore, all the phenomena discussed in this paper take place in the regime of strong disorder. We recall that, in general, electron-electron interactions are enhanced in the presence of disorder ES ; LR .
Finally, at times above the minimum in (Fig. 2), relaxations at different approach the corresponding equilibrium values . Here all the data can be described by a scaling form [Fig. 5(a)], where
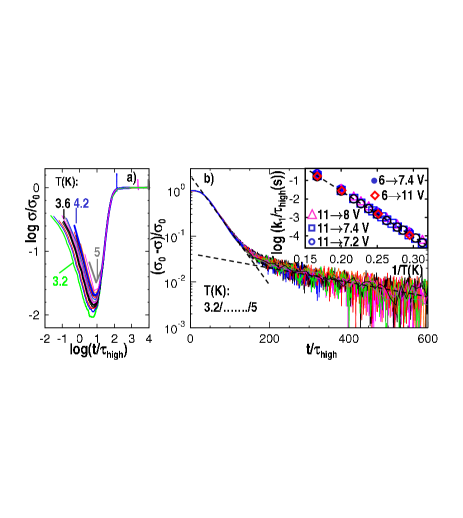
is a simple exponential function with the characteristic relaxation time . For some [see Fig. 5(b)], another slower, simple exponential process also seems to exist with the same -dependence of its characteristic relaxation time , but its presence does not seem to depend on in any systematic way. We find that, unlike , (and , if present) does not depend on in the regime studied. On the other hand, s with K independent of (Fig. 5(b) inset).
Several striking features of our data stand out.
(1) At long times, the relaxation is exponential with a characteristic time that diverges exponentially as . This means that, at any finite , the 2DES will reach equilibrium after a sufficiently long time . For example, s at K but, already at K, years, which exceeds the age of the Universe by several orders of magnitude. Therefore, even though, strictly speaking, the system appears to be glassy only at , at low enough the dynamics is glassy on all experimentally accessible time scales. It is interesting that the recent study of the 2D Coulomb glass model has also found Gre an exponential divergence of the equilibration time as , signaling a transition at .
(2) In the glassy regime, i. e. on short enough time scales , the relaxations are strongly nonexponential. They obey the Ogielski form with and , where , K. Since diverges as , the relaxations attain a pure power law form at . We note that the Ogielski form of the relaxation and the divergence of are consistent with the general scaling arguments sca near a continuous phase transition occurring at . Similar scaling is observed in spin glasses above Pap .
The very pronounced and precise dependence of on strongly suggests that Coulomb interactions between 2D electrons play a dominant role in the observed out-of-equilibrium dynamics. In InOx films, the most extensively studied example of an electron glass fil ; fil ; fil , the dependence of the relaxation time on the carrier density has been interpreted as evidence that the slow dynamics is due to electronic relaxation rather than glassiness of the extrinsic degrees of freedom fil .
(3) The 2DES equilibrates only after it first goes farther away from equilibrium. This overshooting of manifests itself as either a minimum [Fig. 1(a)] or a maximum in depending on the direction of change. For example, if , first increases, overshoots and reaches a maximum, and then decreases exponentially to . An analogous overshooting during relaxation is known to occur in orientational ove and spin glasses ove but has not been observed in InOx films fil . We note an important difference between our experiment and those on InOx films. In InOx, the change in the carrier density due to variations in is typically %, and the system remains deep in the insulating state. In our case, is changed up to a factor of 7, and the 2DES may go from the conducting to the insulating regime. Recent numerical work has shown ove that such a strong perturbation can lead to nontrivial dynamics and, in particular, to a “roundabout” relaxation, where system equilibrates only after it once goes farther away from equilibrium.
In summary, we have studied the relaxations of in a strongly disordered 2DES after excitation far from equilibrium by a rapid change of at low . The data strongly suggest (a) the transition to a glassy phase as , and (b) the Coulomb interactions between 2D electrons are primarily responsible for the observed out-of-equilibrium dynamics. Further work is needed to identify the microscopic details of the relaxation phenomena.
We are grateful to I. Raičević for technical assistance, and V. Dobrosavljević for useful discussions. This work was supported by NSF grant No. DMR-0403491, and NHMFL through NSF Cooperative Agreement No. DMR-0084173. D. P. would like to acknowledge the hospitality of the Aspen Center for Physics.
References
- (1) E. Miranda et al., Rep. Prog. Phys. 68, 1 (2005).
- (2) J. H. Davies et al., Phys. Rev. Lett. 49, 758 (1982); M. Grünewald et al., J. Phys. C 15, L1153 (1982); M. Pollak et al., Sol. Energy Mater. 8, 81 (1982); J. H. Davies et al., Phys. Rev. B 29, 4260 (1984); M. Pollak, Philos. Mag. B 50, 265 (1984).
- (3) D. Monroe et al., Phys. Rev. Lett. 59, 1148 (1987).
- (4) M. Ben-Chorin et al., Phys. Rev. B 44, R3420 (1991); M. Ben-Chorin et al., Phys. Rev. B 48, 15025 (1993); Z. Ovadyahu et al., Phys. Rev. Lett. 79, 459 (1997).
- (5) A. Vaknin et al., Phys. Rev. Lett. 81, 669 (1998).
- (6) A. Vaknin et al., Phys. Rev. Lett. 84, 3402 (2000); A. Vaknin et al., Phys. Rev. B 65, 134208 (2002); Z. Ovadyahu et al., Phys. Rev. B 68, 184204 (2003); V. Orlyanchik et al., Phys. Rev. Lett. 92, 066801 (2004).
- (7) G. Martinez-Arizala et al., Phys. Rev. Lett. 78, 1130 (1997); G. Martinez-Arizala et al., Phys. Rev. B 57, R670 (1998); E. Bielejec et al., Phys. Rev. Lett. 87, 256601 (2001); L. M. Hernandez et al., Phys. Rev. Lett. 91, 126801 (2003); T. Grenet, Eur. Phys. J. B 32, 275 (2003); M. Lee et al., cond-mat/0408495.
- (8) E. Abrahams, S. V. Kravchenko, and M. P. Sarachik, Rev. Mod. Phys. 73, 251 (2001); S. V. Kravchenko and M. P. Sarachik, Rep. Prog. Phys. 67, 1 (2004).
- (9) S. Bogdanovich and D. Popović, Phys. Rev. Lett. 88, 236401 (2002).
- (10) J. Jaroszyński et al., Phys. Rev. Lett. 89, 276401 (2002).
- (11) J. Jaroszyński et al., Phys. Rev. Lett. 92, 226403 (2004).
- (12) Drude ; is a valley degeneracy.
- (13) V. J. Emery et al., Phys. Rev. Lett. 74, 3253 (1995).
- (14) A. T. Ogielski, Phys. Rev. B 32, 7384 (1985).
- (15) C. Pappas et al., Phys. Rev. B 68, 054431 (2003).
- (16) The RC charging times of the device and the circuit are at most 10 ms.
- (17) While it is difficult to distinguish between a logarithm and a power-law for the case shown in Fig. 3(b), other data indicate that the power law provides a better fit.
- (18) If the values for K) that were obtained assuming the Ogielski form [Fig. 3(c)] are also included in the fit, then all the data are described well by s, where but there is a large uncertainty in the corresponding activation energy. Similar sub-Arrhenius -dependence of the relaxation time has been found in some theoretical models that display glassy dynamics sub , and also observed in some glassy thin films sub . We note that none of the main conclusions of our work depend on the exact value of the exponent .
- (19) M. P. Kennett et al., Phys. Rev. B 72, 024416 (2005).
- (20) E. Cecchetto et al., J. Phys.: Condens. Matter 17, 2825 (2005).
- (21) [K]cm in a Si MOSFET.
- (22) A. L. Efros and B. I. Shklovskii, J. Phys. C 8, L49 (1975).
- (23) P. A. Lee et al., Rev. Mod. Phys. 57, 287 (1985).
- (24) D. R. Grempel, Europhys. Lett. 66, 854 (2004).
- (25) P. C. Hohenberg et al., Rev. Mod. Phys. 49, 435 (1977).
- (26) F. Alberici-Kious et al., Phys. Rev. B 62, 14766 (2000).
- (27) M. Sasaki et al., Eur. Phys. J. B 29, 469 (2002).
- (28) H. Morita et al., Phys. Rev. Lett. 94, 087203 (2005).