Avalanche dynamics driven by adaptive rewirings in complex networks
Abstract
We introduce a toy model displaying the avalanche dynamics of failure in scale-free networks. In the model, the network growth is based on the Barabási and Albert model and each node is assigned a capacity or tolerance, which is constant irrespective of node index. The degree of each node increases over time. When the degree of a node exceeds its capacity, it fails and each link connected to it is is rewired to other unconnected nodes by following the preferential attachment rule. Such a rewiring edge may trigger another failure. This dynamic process can occur successively, and it exhibits a self-organized critical behavior in which the avalanche size distribution follows a power law. The associated exponent is . The entire system breaks down when any rewired edges cannot locate target nodes: the time at which this occurs is referred to as the breaking time. We obtain the breaking time as a function of the capacity. Moreover, using extreme value statistics, we determine the distribution function of the breaking time.
pacs:
89.70.+c, 89.75.-k, 05.10.-aComplex systems are composed of many constituents that interact with each other or adapt to external perturbations nature ; science . Recently, there have been increasing attempts to describe such systems in terms of networks review1 ; review2 ; review3 ; review4 , where nodes and links represent constituents and their interactions, respectively. Many complex networks in real systems follow a power-law in the degree distribution, where degree is the number of links connected to a given node ba . Such a network is called scale-free (SF) networks. SF networks are ubiquitous in real world, whose examples include the Internet and the world-wide web, the metabolic networks, the protein interaction networks, the co-authorship networks, etc.
It was studied that complex networks are robust against the random removal of nodes, however, they are vulnerable to the intentional removal of nodes with high degree attack . More severe damage can be caused by triggering a few nodes, but the failure propagates to other nodes in a cascading manner. Avalanche dynamics occurs frequently in complex networks due to the small-world feature of the system. The blackout of power-supply network in the United States in 1996 and 2003 is a typical example of such a cascading failure in complex networks blackout . Internet traffic is another example. In October 1986, during the first documented Internet congestion collapse, the speed of the connection between the Lawrence Berkeley Laboratory and the University of California at Berkeley, which are separated by only 200 meters, decreased by a factor of 100 berkeley . These are only a few instances; many others can be found in various systems such as cultural fad, earthquake, etc. Since the subject of avalanche dynamics in complex systems is interesting and intricate, it has been studied extensively aval1 ; aval2 ; aval3 ; aval4 ; aval5 ; aval6 .
Here we introduce a toy model exhibiting the avalanche dynamics in complex networks. In this model, when a node fails, the links connected to it are rewired to other nodes, thereby preserving the total number of links during the avalanche dynamics. Due to the dynamic rule, the overload imposed on a specific node is shared among the other nodes globally as in the case of global load sharing in a fiber bundle model.
Let us begin with the introduction of the model we consider here. The model is based on the Barabási and Albert (BA) model ba , in which at each time step, a new node is added and its links are connected to distinct existing nodes by following the so-called preferential attachment (PA) rule. The newly added node is connected to node whose degree is with a probability . In this case, the number of nodes at is taken as and they are fully connected to each other. Our model is modified from the BA model as follows: We assign a capacity or tolerance denoted by to each node . It is constant independent of the node index . The capacity represents the maximum number of connections that can be sustained by a node. As time goes on, the degree of each node increases. When the degree of a node exceeds its capacity , it is considered to be overloaded and is deleted from the system. Then all the links connected to the failed node are rewired to the other remaining nodes by applying the PA rule. By other remaining nodes, we mean the nodes in the system except the overloaded nodes. Multiple connections are not allowed. The rewiring process, shown in Fig. 1, may trigger the avalanche dynamics: when the degree of a node that receives a rewired link of an overloaded node exceeds , i.e. it becomes , it fails and its links must be rewired again. This process repeats until all the overloaded nodes are eliminated. Thus the degree of each node that remains after the completion of the avalanche process does not exceed the capacity . In the absence of a target node to which a rewiring link should be connected, the dynamics process is terminated and the entire system is considered to be collapsed, and the time at which occurs is referred to as the breaking time denoted by . It is noteworthy that the avalanche process does not spread locally from the triggering node, but it occurs across the entire system. Moreover the number of links is preserved during this process since the load of the failed node is distributed to other nodes globally. Otherwise, the system breaks down.


| 7 | 19 | 3 | 2.0 | 34000 | 3.2 |
| 8 | 26 | 5 | 2.8 | 1900 | 1.96 |
| 9 | 38 | 7 | 2.68 | 3074 | 1.920 |
| 10 | 56 | 12 | 2.68 | 3470 | 1.766 |
| 11 | 87 | 21 | 2.57 | 4679 | 1.668 |
| 12 | 147 | 38 | 3.41 | 1222 | 1.165 |
| 13 | 283 | 81 | 3.69 | 1106 | 0.998 |
| 14 | 703 | 229 | 4.05 | 829 | 0.803 |
| 15 | 3073 | 1188 | 4.755 | 512 | 0.576 |
| 16 | 93075 | 45649 | 6.412 | 302 | 0.334 |


Using the model, we perform numerical simulations for various values of . First we considered the breaking time as a function of the capacity . As shown in Fig. 2, we observe that that the mean breaking time averaged over different ensembles increases at a higher rate than the double exponential function. This result implies that a small increment in the capacity of each node significantly enhances the tolerance of the system. That is because the overload is shared globally. Since the breaking time increases very rapidly, it is difficult to perform numerical simulations for large values of .
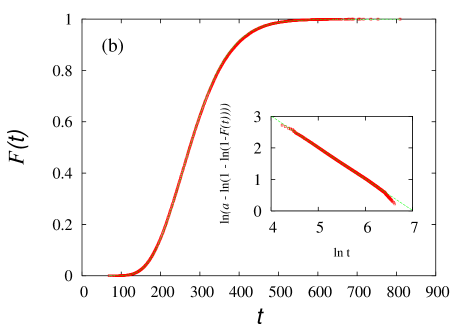
The breaking time fluctuates considerably in Fig.2, wherein the error bar increases with increasing . Explicit values are listed in Table 1. Thus, it would be meaningful to study the distribution of the breaking time since it is a relatively sensitive probe of the underlying breaking mechanism, which is often used as a tool for reliability analysis. It is conventional to consider the probability that a network fails at a time , or less. Then it is expressed as . In Fig.3(a), we plot this distribution numerically, and observe that it fits well to the double exponential form,
| (1) |
which is one of the known functions in extreme value statistics. The constants , and depend on . Their values are listed in Table I. The double-exponential functional form appears in mechanical failure problems in the ductile regime ductile . This functional form is different from the Weibull distribution that occurs in the brittle regime and fiber bundle model d-hkim
Next, we study the avalanche size distribution in which the avalanche size represents the number of nodes that fail successively. This distribution follows the power-law,
| (2) |
with the exponent (Fig. 4). The exponent value is close to that obtained from the fiber bundle model. We determine the mean avalanche size as a function of triggering time. As shown in Fig. 5, the mean avalanche size is independent of the triggering time except in the small regime.
The exponent of the avalanche size distribution of the toy model is close to the one obtained in the fiber bundle model in SF networks moreno2002 . In the original one-dimensional fiber-bundle model, an external force is evenly distributed to all the nodes in the network. For of node , a threshold value is assigned against failure. When the load is larger than the threshold, the node fails irreversibly and its load is equally distributed to its remaining nearest neighbors. This process continues until no failure occurs. Thereafter the process is repeated by applying a bigger force to the remaining nodes. The study of the fiber bundle model has been extended to the case of complex networks. When a critical force is applied, the avalanche size distribution follows a power law. Recently Kim et al. d-hkim investigated the fiber bundle problem by considering various complex networks such as the Erdős and Rényi random network er , the small-world network ws and the SF network. Their result indicates that the patterns of the avalanche dynamics occurring in such complex networks are almost the same due to the small-world property: The effect of the local load sharing rule is negligible in complex networks. Therefore the exponent of the avalanche size distribution reduces to the mean field value, i.e., .
As shown in Fig.5, the avalanche size is independent of time. This suggests ineffective correlation between the degrees and the entire system is considered to be homogeneous. Moreover, the avalanche dynamics proceeds globally by the rewiring dynamics. Thus, the exponent of the avalanche size distribution of the toy model reduces to the mean field value. Although the toy model has not been applied to real world systems, the dynamic rule of the rewiring edges in the model is rather unique; it may reflect the adaptive behavior of each individual (node) in the event of a failure. In such a case, the adaptive behavior does not relieve itself, rather it may lead to other successive failures. This phenomenon can often be observed in complex systems. For example, when a city encounters a shortage of electric power, the current power grid system is designed to compensate instantly by drawing power from neighboring cities. This may cause another blackout or a cascading blackout throughout the country. In order to prevent such avalanche dynamics induced by the adaptive activity, failure should be localized.
This work is supported by the KRF Grant MOEHRD (R14-2002-059-010000-0) funded by the Korean government.
References
- (1) K. Ziemelis and L. Allen, Nature (London) 410, 241 (2001) and following review articles on complex systems.
- (2) R. Gallagher and T. Appenzeller, Science 284, 87 (1999) and following review articles on complex systems.
- (3) R. Albert, A.-L. Barabási, Rev. Mod. Phys. 74, 47 (2002).
- (4) S. N. Dorogovtsev, J. F. F. Mendes, Evolution of Networks: From Biological Networks to the Internet and the WWW (Oxford University Press, Oxford, 2003).
- (5) M. E. J. Newman, SIAM Rev. 45, 167 (2003).
- (6) R. Pastor-Satorras, A. Vespignani, Evolution and Structure of the Internet: a Statistical Physics Approach (Cambridge University Press, Cambridge, 2004).
- (7) A.-L. Barabási and R. Albert, Science 286, 509 (1999).
- (8) R. Albert, H. Jeong, and A.-L. Barabási, Nature (London) 406, 378 (2000).
- (9) M.L. Sachtjen, B. A. Carrera, and V.E. Lynch, Phys. Rev. E 61, 4877 (2000).
- (10) V. Jacobson, Comput. Comm. Rev. 18, 314 (1988).
- (11) A.E. Motter and Y.-C. Lai, Phys. Rev. E 66, 065102(R)(2002).
- (12) L. Zhao, K. Park, and Y.-C. Lai, Phys. Rev. E 70, 035101(R) (2004).
- (13) E.J. Lee, K.-I. Goh, B. Kahng and D. Kim, Phys. Rev. E 71, 056108 (2005).
- (14) P. Crucitti, V. Latora, and M. Marchiori, Phys. Rev. E 69, 045104(R) (2004).
- (15) Y. Moreno, J. B. Gómez, and A. F. Pacheco, Europhys. Lett. 58, 630 (2002).
- (16) K.-I. Goh, D.-S. Lee, B. Kahng, and D. Kim, Phys. Rev. Lett. 91, 148701 (2003).
- (17) B. Kahng, G.G. Batrouni, S. Redner, L. de Arcangelis, and H.J. Herrmann, Phys. Rev. B 37, 7625 (1988).
- (18) D.-H Kim, B.J. Kim, and H. Jeong, Phys. Rev. Lett. 94, 025501 (2005).
- (19) Y. Moreno, J. B. Gómez, and A. F. Pacheco, Europhys. Lett. 58, 630 (2002).
- (20) P. Erdös and A. Rényi, Publ. Math. Inst. Hung. Acad. Sci. Ser. A 5, 17 (1960).
- (21) D.J. Watts and S.H. Strogatz, Nature 393,440 (1998).