Evidence of polariton induced transparency in a single organic quantum wire
Abstract
The resonant interaction between quasi-one dimensional excitons and photons is investigated. For a single isolated organic quantum wire, embedded in its single crystal monomer matrix, the strong exciton-photon coupling regime is reached. This is evidenced by the suppression of the resonant excitonic absorption arising when the system eigenstate is a polariton. These observations demonstrate that the resonant excitonic absorption in a semiconductor can be understood in terms of a balance between the exciton coherence time and the Rabi period between exciton-like and photon-like states of the polariton.
In the 50’s Hopfield showed that semiclassical theory is inappropriate to describe photon absorption by a semiconductor Hopfield . Indeed, an exciton has a defined wave-vector and is then only coupled to a single photon state, the one having the same momentum. The resulting system eigenstate during photoexcitation is a mixed exciton-photon state, a polariton, which does not lead to photon absorption if additional couplings are not taken into account Hopfield . On the other hand, an exciton in a quantum well or wire is coupled to a photon continuum in the emission process. Therefore, the emission probability follows the Fermi Golden rule (FGR), whereas this is not a priori so for the absorption. In fact, as recently shown Dubin-Combescot , two regimes can be reached by photoexcitation depending on the number of incident photons: a linear regime where photons are absorbed and a non linear one where absorption does not occur, the semiconductor becoming transparent. In the former, the exciton coherence time (generally governed by interaction with phonons) is much shorter than the exciton-photon interaction time Dubin-Combescot , and photons are continuously absorbed following the FGR. In the latter, the system eigenstate is a slightly damped polariton, the exciton-photon interaction time being comparable to, or shorter than, the exciton coherence time and absorption saturates. These considerations allow one to understand why under resonant excitation, Deveaud and co-workers have observed in a multiple quantum well Bragg structure a dramatic suppression of the excitonic absorption Deveaud , i.e., the so-called polariton induced transparency (PIT) regime Bosacchi .
In this letter, we report high spatial resolution spectroscopy (micro-photoluminescence, -PL) at low temperature on a single isolated polydiacetylene (PDA) macro-molecule, a poly-3BCMU red chain formule3B . The elementary optical excitation of this organic quantum wire being a quasi-1D Wannier exciton, poly-3BCMU red chains provide an excellent system to investigate the fundamental interaction between a quasi-1D Wannier exciton and a photon. This is evidenced by studying a single red chain emission as a function of excitation power in two situations: firstly, the excitons are created through pumping within a vibronic absorption line (non resonant excitation). Secondly, the excitons are directly created at the band edge (resonant excitation), near k=0, so they are resonantly coupled to pump photons. In the former case, neither the -PL spectrum nor the chain excitonic absorption are modified as excitation power increases. On the contrary, under resonant excitation, we observe a saturation of the chain excitonic absorption at high excitation power pstatsol . We show that the saturation threshold occurs at the same excitation power all along the chain spatial extension (up to 20 m) although the chain is only illuminated over 1 m. The observed saturation is interpreted in terms of a crossover between a regime where photons are absorbed according to the FGR and the one in which PIT takes place.
A poly-3BCMU quantum wire consists of a chain of Carbon atoms linked by alternating single, double, and triple bonds, and can be very diluted in its single crystal monomer matrix. These chains exist in two electronic structures so-called red and blue phases Lecuiller98 . The extremely regular confinement potential within the 3BCMU monomer crystal leads to an almost ideal chain spatial conformation, i.e., a perfect one dimensional semiconductor structure. The optical excitation of poly-3BCMU red chains is a highly bound (0.6 eV) exciton Horvath , which center of mass motion shows the characteristic pure 1D DOS energy singularity at the band edge Dubin2002 . The poly-3BCMU red chain absorption cross section can be estimated from absorption measurements of an ensemble of chains Lecuiller98 , and is of the order of 10-13 cm2 per repeat unit, that is several orders of magnitude larger than in other known organic or inorganic semiconductors. The -PL spectrum of an isolated red chain is composed by an intense zero phonon line, due to the direct recombination of the red exciton, and several much weaker vibronic replicas deriving from the radiative recombination of the exciton with coincident emission of a chain optical phonon having the appropriate momentum Lecuiller98 . The integrated intensity of any of these emissions reflects the number of photocreated excitons along the chain whatever their k state Dubin2002 , but only the most intense vibronic emission, the so-called D-line (since it corresponds to generation of one double-bound stretch chain optical phonon) is hereafter considered, all vibronic emissions behaving similarly.
Single chain non resonant excitation (NRE) is performed with the 501.7 nm line of an Ar+ laser. The excitation energy is then within the homogeneous width of the D-phonon assisted absorption line at low temperature Lecuiller98 . The zero-phonon and D-emission lines are recorded as a function of the excitation power. The resonant excitation (RE) of the excitonic transition is performed by exciting at the energy of the zero-phonon emission Lecuiller98 , and only the D-emission line can be recorded. The spatial profile of the emission of a single chain is also presented.

Figure 1 shows the zero-phonon emission line at 10 K as a function of the NRE power (PNRE). Between 3.2x10³ and 6x10⁵ W.cm-2 the emission line-shape remains lorentzian, centered at 2.2854 eV with a full width at half maximum (FWHM) of 540 eV. Then, between 6x10⁵ and 1.3x10⁶ W.cm-2, the zero-phonon line broadens and shifts continuously towards higher energies keeping a lorentzian line-shape. At 1.3x10⁶ W.cm-2 the emission is centered at 2.2855 eV and exhibits a FWHM of 630 eV. According to the temperature dependence of the -PL spectrum of a single red chain Dubin2002 , the shift and broadening of the zero-phonon emission with PNRE are shown to both derive from a two Kelvin heating of the chain. Indeed, for an excitation at 1.3x10⁶ W.cm-2, the independently measured sample overall temperature has reached 12 K. Moreover, the D-emission line-shape remains unchanged in the whole studied excitation power range (the spectra can be found in Dubin2002 ).
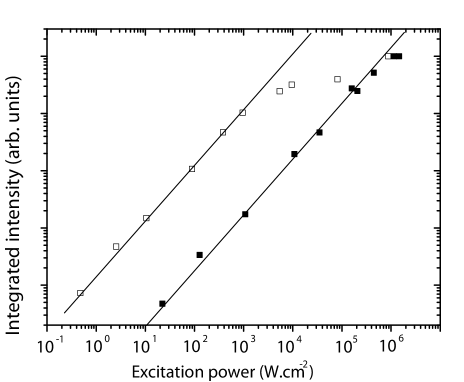
The variation of the D-emission integrated intensity at 10 K versus PNRE is shown on Figure 2 (filled square symbols). These data show that the number of photocreated excitons along the chain is proportional to the number of pump photons, and that exciton-exciton interaction processes are negligible in the whole studied excitation range. This observation is consistent with the fact that the excitonic absorption obeys the FGR. Figure 2 also presents the variation of the D-emission integrated intensity as a function of the RE pump power (PRE). It is proportional to PRE up to 4x10³ W.cm-2 and then saturates. Indeed, its value for an excitation at 9x10⁵ W.cm-2 is almost two orders of magnitude smaller than the one expected if the D-line integrated intensity remained proportional to PRE in the entire studied excitation range.
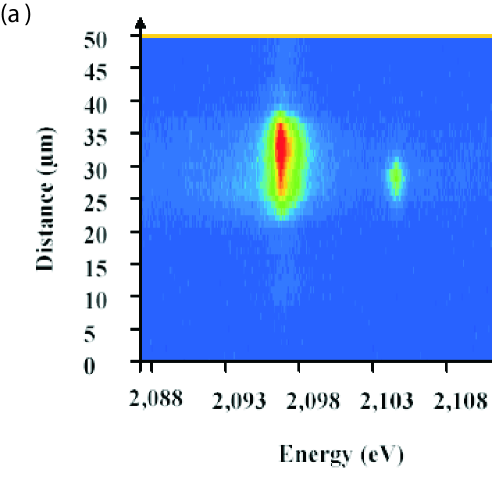

Our experimental setup also allows to perform imaging spectroscopy of a single chain Guillet2001 . When the red chain axis is aligned parallel to the spectrometer entrance slits, one obtains along this direction the spatial extension of the emission, and the -PL spectrum perpendicularly. On Figure 3.a such an image of a red chain excited resonantly at 8 K is presented. On this image the vertical axis z, graduated in m, is the direction parallel to the chain, the horizontal one is the emission energy in eV. In this measurement, the laser spot is centered at z=27 m. Therefore, a locally excited single red chain emits photons from a very extended region, 18 m long in the case of Figure 3.a. The physical origin of this observation will be addressed elsewhere. The power dependences under resonant excitation of the D-line emission coming from two separate regions of this chain, at =27 and =37 m respectively, are shown on Figure 3b. These variations are identical, showing saturation at the same threshold and the threshold occurs at the same PRE as on Figure 2, although different chains were studied on Figure 2 and 3 respectively. Indeed, all individual red chains show the same saturation behavior.
One possible origin for the observed saturation under RE is a large exciton population photocreated along the chain. To check this hypothesis we compare the exciton density created under RE and NRE. For that purpose the ratio () for a single chain must be estimated ( and are the chain absorption coefficients under NRE and RE respectively). At 13 K, absorption measurements on an ensemble of non interacting red chains have shown that ()1/10 Lecuiller98 . The zero-phonon line, corresponding to resonant absorption, has an inhomogeneously broadened FWHM 1.5-2 meV; the D absorption line has a FWHM 4-5 meV. This width, much larger than the former, is considered to be a homogeneous width corresponding to the lifetime of the vibronic state generated by absorption. So, a single isolated chain D-absorption line should have the same width. It is independent of temperature up to at least 30 K, the zero-phonon absorption line area being also independent of temperature, the ratio () for a single chain then reads
| (1) |
and being the homogeneous linewidths of the zero-phonon and D absorption line respectively. Around 10 K, =800 eV and =4 meV, the absorption coefficient under RE is then about 50 times larger than the one under NRE. From 10-13 cm2 we therefore deduce that for the highest excitation power the dimensionless exciton density parameter, n, n being the exciton density and the exciton Bohr radius deduced from its polarisability (=15 Moller ), is 6x10⁻² and 2x10⁻² under NRE and RE respectively note_nax . The exciton density photocreated under NRE being larger than under RE, the saturation of the chain excitonic absorption cannot be due to exciton-exciton interactions. Moreover, for such low n values, excitons can be considered as ideal bosons in the entire excitation range Combescot-Tanguy .
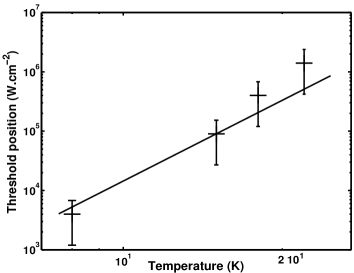
As mentioned before and precisely shown in Dubin-Combescot , the excitonic absorption only follows the FGR when the coherence time of the exciton state which is coupled to photons, , is short compared to the period of the Rabi oscillations, , N denoting the number of pump photons and g the exciton-photon coupling equal to the square root of the resonant absorption coefficient, . The integrated intensity of the resonant absorption line does not vary with temperature, the absorption coefficient therefore scales like (1/) note_abs and g like (1/). The Rabi period then varies with temperature like . Furthermore, for poly-3BCMU red chains, is governed by the interaction between the red exciton and the LA phonons of the monomer crystal surrounding the chain, such that Dubin2002 . Consequently, if the saturation of absorption corresponds to a transition from a regime in which absorption follows the Fermi golden rule to another regime where the photon number is large enough to enter a polariton dominant regime, at the threshold . The value of at threshold should therefore vary with temperature like . Indeed, as presented on Figure 4 the measured variation of the saturation threshold scales like up to at least 20 K note_error . This further supports our interpretation of the saturated excitonic absorption as an experimental evidence of a transition between a regime in which photon absorption obeys the FGR, to a regime in which PIT takes place.
In fact, when , an exciton initially photocreated at k=0 is scattered by LA phonons of the monomer crystal surrounding the chain to a k0 exciton state Dubin2002 , before another exciton is created at k=0. In this regime, very crudely, incident photons are absorbed one by one and the overall chain excitonic absorption follows the FGR Dubin-Combescot . This first regime corresponds to the linear variation of the D-emission integrated intensity with PRE. On the contrary, when , the exciton photocreated at k=0 is strongly coupled to pump photons such that the system eigenstate is a slightly damped polariton. This second regime of PIT corresponds to the saturation of the chain excitonic absorption that we have observed.
To summarize, we have presented the variation of the excitonic absorption of a single isolated polydiacetylene chain with excitation power. Under non resonant excitation, neither the single chain -PL spectrum, nor the chain absorption, are modified as excitation power increases. On the contrary, under resonant excitation the number of photocreated excitons along the chain varies proportionally with excitation power and then saturates. The saturation threshold is shown to be constant all along the chain spatial extension which is 20 times larger than the excited part of the chain and to be approximately proportional to the third power of temperature. The evaluation of the exciton densities photocreated under resonant and non resonant excitation shows that excitons behave as ideal bosons and that the saturated absorption is not due to a too large exciton population along the chain. The saturation threshold corresponds to a transition between a regime where photons are absorbed according to the Fermi Golden rule to the regime of polariton induced transparency. To conclude let us stress that the polariton induced transparency is reached thanks to the large absorption cross section of poly-3BCMU red chains. It requires a very high polariton Rabi frequency which is proportional to the product of the absorption coefficient and the number of pump photons. This latter can in our case be kept sufficiently small to have a low enough excitonic population in order to avoid effects related to exciton-exciton interactions which would destroy the bosonic character of excitons and therefore the polariton induced transparency regime.
∗: Corresponding author (present adress: Institut für Experimentalphysik, Universität Innsbruck, Technikerstrasse 25, A-6020 Innsbruck, Austria)
References
- (1) J. J. Hopfield, Phys. Rev. 112, 1555 (1958)
- (2) F. Dubin, M. Combescot, B. Roulet, cond-mat/0406554, to appear in Europhys. Lett.
- (3) G. R. Hayes, J. L. Staehli, U. Osterle, B. Deveaud, R. T. Phillips, C. Ciuti, Phys. Rev. Lett. 83, 2837 (1999)
- (4) M. P. Fontana Phys. Rev. Lett. 37, 789 (1976)
- (5) The general formula of PDA is . In 3BCMU, the side groups R and R′ are identical, with the following molecular formula: -
- (6) Preliminary results were presented at the 8th International Conference on Optics of Excitons in Confined Systems, Phys. Stat. Sol. (c) 1, 454 (2004)
- (7) R. Lécuiller, J. Berréhar, C. Lapersonne-Meyer, and M. Schott, Phys. Rev. Lett. 80, 4068 (1998)
- (8) G. Weiser, in ”Primary photoexcitations in conjugated polymers: Molecular excitons versus semiconductor band model” (World Scientific, Singapore, 1997), p318
- (9) F. Dubin, J. Berréhar, R. Grousson, T. Guillet, C. Lapersonne-Meyer, M. Schott and V. Voliotis, Phys. Rev. B. 66, 113202 (2002)
- (10) T. Guillet, J. Berréhar, R. Grousson, J. Kovensky, C. Lapersonne-Meyer, M. Schott and V. Voliotis, Phys. Rev. Lett. 87, 087401 (2001)
- (11) S. Möller, G. Weiser, R. Lécuiller and C. Lapersonne Synth. Metal 116, 153 (2001)
- (12) To evaluate the dimensionless exciton density parameter, n, the exciton effective lifetime is required (100 ps at low temperature, see: R. Lécuiller, J. Berréhar, J.-D. Ganière, C. Lapersonne-Meyer, P. Lavallard, and M. Schott, Phys. Rev. B. 66, 125205 (2002))
- (13) M. Combescot, C. Tanguy, Europhys. Lett. 55, 390 (2001)
- (14) The resonant absorption line is a lorentzian of width , its integral is therefore proportional to .
- (15) The error bars take into account the difficulties in comparing the laser intensity seen by the excited chain between each experimental conditions.