Intermittent dry granular flow in a vertical pipe
Abstract
The intermittent compact flow of glass beads in a vertical glass pipe of small diameter is studied experimentally by combining particle fraction, pressure, and air and grain flow rates measurements with a spatio-temporal analysis of the flow. At the onset of the flow, a decompaction front is observed to propagate from the bottom to the top of the tube at a velocity much larger than that of the grains. The blockage front also propagates upwards and at a still higher velocity. The decompaction induces a decreasing pressure wave strongly amplified as it propagates upwards towards the top of the tube. Pressure variations of 3000 Pa or more are detected in this region while particle fraction variations are of the order of 0.02. Grain velocities during the flow period also increase strongly at the top of the tube while the corresponding fraction of total time decreases. A 1D numerical model based on a simple relation between the effective acceleration of the grains and the particle fraction variations reproduces the amplification effect and provides predictions for its dependence on the permeability of the packing.
pacs:
45.70.-n, 81.05.RmI Introduction
Dry particle flows driven by gravity (as in emptying hoppers or silos) or by a gas current (in pneumatic transport Laouar98 ) are encountered in many industrial processes. Modeling such flows represents a challenging fundamental problem since they involve complex interactions of moving grains with the surrounding air, bounding walls and other grains. Various flow regimes may be observed in these systems according to the spatial distribution of the particle concentration and velocity field. Examples of such regimes include the free-fall of particles at high velocities and low particle fractions, slow compact flows with high particle fractions, and density waves in which compact and dilute zones alternate Raafat96 . These particle flows may be stationary (in this case, particles – or density waves – propagate at a constant mean velocity) or display oscillations, stick-slip motions, intermittency or blockage effects. Such non-stationarities have been reported in the simultaneous flow of air and grains in vertical pipes Leung78 ; Knowlton86 ; Aider99 ; Bertho02 and are encountered in a variety of settings. They represent a significant problem in many large-scale industrial facilities such as silos or pneumatic transport systems: intermittent flows may induce very large, potentially destructive, pressure variations.
Several approaches have been suggested to model theoretically granular flows in pipes, each of them being applicable to only a part of the flow regimes. Kinetic theories Savage79 ; Jenkins83 are best suited when the particle fraction is lower than 0.5 and collisional effects play an important part. In this regime, the time between two successive collisions is large compared to the duration of the collision. At higher particle fractions, grains are in contact with their neighbors a large fraction of the time and friction forces between particles and walls become significant. Although attempts have been made to adapt the kinetic theory to these frictional regimes Azanza99 , different approaches have often been used. In their study of compact moving bed flows, Chen et al. Chen84 use the classical Janssen theory Janssen95 ; Duran00b to estimate friction forces on the walls from the relation between the vertical component of the stress-tensor in the grain packing and the horizontal normal stress component on the walls.
The present work deals with intermittent compact flows of grains in a vertical tube of small diameter. In this case, the particle fraction is very close to that of a static random packing of particles, and the solid friction between particles and walls is always important. The objective of this study is to analyze the spatio-temporal characteristics of the onset and blockage of such intermittent flows. Of special interest is the relation between air pressure, particle fraction and grain velocities and the manner in which variations of these quantities are amplified as they propagate along the flow tube.
A similar flow regime is encountered in the “ticking hourglass” experiment Wu93 ; Maloy94 ; LePennec95 ; LePennec96 ; Veje01 corresponding to a periodic intermittent granular flow between two closed glass containers connected by a short vertical constriction. In this case, intermittency is believed to be largely due to the build-up of a pressure difference induced by the grain flow between the two containers (both because air is dragged downwards and because the empty volume available for air increases with time in the upper container and decreases in the lower one). Once the back pressure is sufficiently large to halt flow, it decays due to air flow through the grain packing in the constriction until it is low enough to permit flow. In this experiment, the key phenomena are localized in a small volume close to the constriction; in particular, static arches of particles are believed to build up right above it, where transient fractures of the packing are also observed.
In the intermittent compact flow down a long vertical tube considered in the present study, the flow intermittency phenomenon is distributed over most of the height of the tube. This allows one to perform simultaneously a large variety of measurements (local pressures and particle fractions, air and grain flow rates, …) at several locations, and so characterized the variations of the flow with height. High resolution spatio-temporal diagrams of particle motions along the tube are also obtained and allow for the characterization of propagation of the onset and blockage of the grain flow along the tube length.
In section II, we describe the experimental set-up and procedure. Then, in section III, the qualitative characteristics of the compact intermittent flows are described, and quantitative data and estimates of air pressure, particle fraction and flow rate variations are presented. In section IV, we discuss appropriate volume and mass conservation equations and their bearing on the experimental results. The various forces acting on the grains and the manner in which they may induce intermittency are discussed in section V. The equations of motion are then written and solved numerically in order to model the spatial variations of pressure, particle fraction and grain velocities.
II Experimental set-up and procedure
The granular flow takes place in a vertical glass tube of radius = (1.5 0.025) mm and length = 1.25 m (Fig. 1).
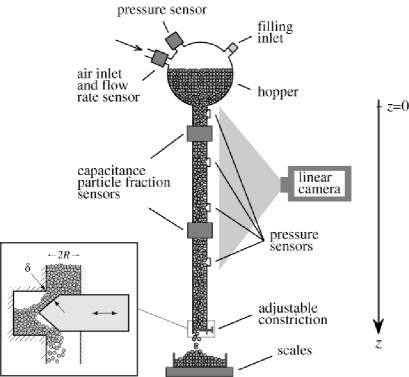
Grains flow from a spherical hopper welded to the top of the pipe. The bottom end is fitted with a variable constriction allowing one to adjust the outflow: this constriction is realized by a cylinder with a conical tip which can be precisely moved across the pipe (see insert of Fig. 1). The grains are spherical glass beads of diameter 2 = (175 25) m and density = (2.50 0.02) 103 kg m-3. Electronic scales are placed below the tube and their output is transmitted to a computer at the rate of one sample per second. The mass flow rate of the grains is then determined from the time variation of the measured mass. The grain flow rate will be characterized by the mean superficial velocity representing the volume flow rate of grains per unit area with:
| (1) |
The hopper is connected to the tube but otherwise closed except for an air inlet. The volume flow rate of air into the hopper is measured by an on-line sensor (the precision is 1% at the largest flow rates). An additional transducer measures the air pressure inside the hopper. Continuity requires that the inflow of air compensates for the volume of both air and grains leaving through the vertical tube. Therefore if remains constant with time, is the sum of the volume flow rates of air and of the grains in the experimental tube. The superficial velocity of air in the tube (volume flow rate per unit area) thus satisfies:
| (2) |
Four pressure sensors are placed along the tube at vertical distances 200, 450, 700 and 950 mm below the outlet of the hopper. They are connected to the inside of the tube through 0.5 mm diameter holes in the tube wall. A fine-meshed grid is stretched across the holes on the external wall to prevent grains from entering the sensors. An independent experiment has been realized to estimate the pressure drop across the grid and the portholes during typical pressure transients encountered in the intermittent flows. Due to the low dead volume of the transducer (23 l), the corresponding error on the pressure measurement is less than 10 Pa for the fastest transients: this will be seen below to be much smaller than the pressure to be measured.
Local mean particle fraction variations in tube sections are measured by an electrical capacitance sensor using two shielded 3 mm diameter cylindrical electrodes pressed against the outside tube walls and facing each other. The sensor is connected to a capacitance bridge (10 kHz measurement frequency) and a lock-in detector with a 680 s time constant. The noise level is of order pF, which corresponds to particle fraction variations of order 10-3.
In order to test the device, an air-grain interface was moved through the sensor and the output was recorded as a function of the location of the interface. This allowed one to determine that the measurement is averaged over a slice of the sample of typical thickness 2 mm parallel to the tube axis. The variation of the DC output with the particle fraction is assumed to be linear and the probes are calibrated by comparing readings obtained with an empty tube and with the same tube filled with a static bead packing. This assumption of a linear variation is frequently used in the literature: in the present case, it is particularly justified by the small particle fraction variations during the experiment and by the random, approximately isotropic structure of the packing. The particle fraction of the static bead packing obtained after filling the tube is assumed to be equal to 0.63: this value corresponds to a Random Close Packing of spheres and is frequently obtained experimentally in similar systems. A direct measurement of has been realized but its precision is limited by the small amount of beads in the tube. A slightly lower value = 0.61 0.02 was obtained (this difference may be due to the small diameter of the tube increasing the influence of wall effects reducing locally the particle fraction). In view of the large uncertainty on this measurement, the value 0.63 is retained in the following.
The capacitance measurements can be performed at chosen heights by moving the sensors along the tube. The instantaneous outputs of four pressure and capacitance sensors are digitized simultaneously at a sampling frequency of up to 1 kHz by a Spectral Dynamics signal analyzer. Time-averaged values of all pressure, capacitance and flow rates sensors are also recorded but at 1 s intervals.
The dynamical properties of the flow are studied from spatio-temporal diagrams constructed from appropriately assembling the output of a digital linear CCD camera. Light intensity variations along a vertical line precisely aligned with the tube are recorded at sampling rates of 500 lines per second with a resolution of up to 2048 pixels (the equivalent pixel size on the tube ranges from 10 m to 500 m depending on the magnification). One thus obtains images in which the -axis represents time while the -axis corresponds to distance along the tube.
III Experimental results on the intermittent compact flow
The flow regimes are controlled by adjusting the constriction at the bottom of the experimental tube. The compact flow regime is observed for narrow constrictions, at typical superficial velocities between 0.01 m s-1 and 0.08 m s-1. Narrowing further the bottom constriction leads to a blockage of the flow while density waves appear at higher flow rates. The typical aperture of the constriction (see Fig. 1 insert) in the compact regime ranges from 1 to 2 mm (or approximately from 6 to 12 bead diameters). In all cases, the particle fraction in the compact regime does not differ by more than 0.02 from the particle fraction in a static packing.
Decreasing the relative humidity of the air down to 40% or using “clean beads” with a smooth surface, changes significantly the behavior of the grain flow: in this case, a continuous flow of grains is observed (its velocity is roughly constant with time and of the order of a few centimeters per second). In return, for “rougher beads” or relative humidity 50%, the flow is intermittent and may remain blocked for a large fraction of the time, particularly near the hopper (observations using a SEM microscope display particles with a size of up to several micrometers at the surface of the “rough beads” with spacings increasing with the size from a few m up to a few 10 m). Experiments reported here have been performed at a relative humidity = (55 5)% for which the grain flow is intermittent. At the outlet of the constriction, flow is modulated but does not stop completely. The modulation may be periodic, particularly at large flow rates. In the remainder of the paper, we shall focus on this latter intermittent compact flow regime.
III.1 Spatio-temporal characteristics of the intermittent flow
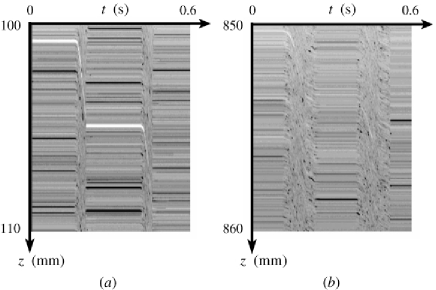
Figure 2 displays two spatio-temporal diagrams of the grain flow over two 10 mm high segments located in the top and bottom parts of the tube. Time corresponds to the horizontal scale. The two diagrams were obtained at slightly different times during a same experiment: due to the excellent periodicity of the flow, they are however comparable. Time intervals during which grains are at rest in the tube are marked by horizontal line segments with constant grey levels; those during which grains are moving down are marked by inclined striations: the slope of which indicates the grain velocity. Starting from rest, the grains first accelerate and reach a constant velocity before finally stopping abruptly. Figures 2() and () show that the fraction of the total time during which grains are flowing is much larger at the bottom of the tube than at the top.
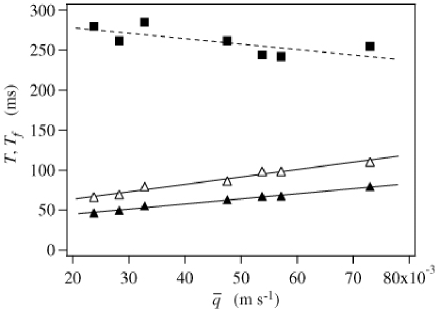
A quantitative comparison is made in Fig. 3 in which the duration of the flow phase at two different distances from the hopper and the period of the process are displayed as a function of the time average of the superficial velocity ( is the sum of the durations of the flow () and static phases). The time lapse is 40% lower in the upper section than in the lower one; it increases linearly with in both cases, while, on the contrary the period decreases with .
Spatio-temporal diagrams also allow one to estimate qualitatively the velocity of the grains in the flow phase from the slope of the striations. Figures 2() and () show that the grain speed is much higher at the top of the tube than at the bottom as required by mass conservation. The particle fraction varies little along the tube and the global displacement of the particles during one period of the flow must be the same at all heights. The mean value of this velocity during the flow phase can be estimated quantitatively from the relation:
| (3) |
The variation of with in both sections of interest is displayed in Fig. 4:
in both cases, increases roughly linearly with . The displacement of the grains during one flow period is equal to and is also plotted on Fig. 4. For large mean flow rates, the instantaneous grain flow rate in the tube exceeds the maximum flow rate from the hopper. A low particle fraction bubble thus builds up at the top of the tube: it appears as a light zone in the spatio-temporal diagram of Fig. 5 (the local particle fraction in this bubble may be lower than 0.2).
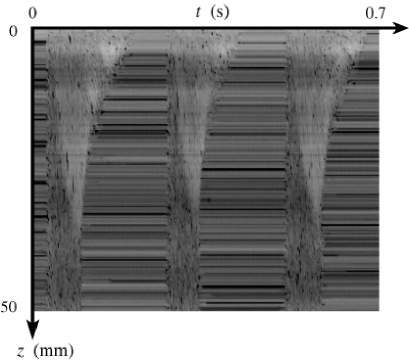
The abrupt initial downwards slope of the contour of the light zone reflects the fast downwards motion of the upper boundary of the compact packing below the bubble. As soon as the motion of the packing stops, the bubble gets filled up from the hopper, although at a lower velocity that decreases with time (this may be due to the build up of an adverse pressure gradient between the bubble and the hopper).
III.2 Spatial variations of the intermittency effect
Information obtained from the spatio-temporal diagrams are complemented by measurements of the local pressure variations.
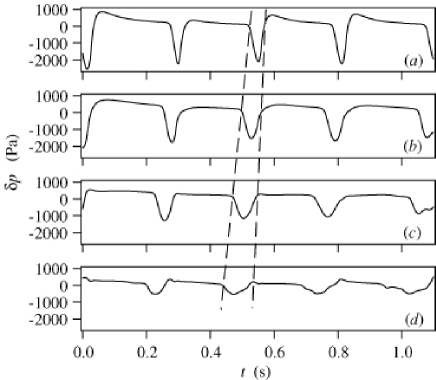
Figure 6 displays time recordings of the pressure variations measured on four sensors at different heights from the top ( is the atmospheric pressure). These curves are nearly periodic; the pressure drops sharply while grains are flowing (by up to 3000 Pa near the top of the tube). Then the pressure increases back above and decays slowly (or remains constant) while the grains are at rest. The time average of the pressure is close to zero (at most 25 Pa) for all four transducers used for the measurements.
The flow has been filmed in the intermittent regime using a 1000 frames per second high speed camera equipped with analog input channels connected to the pressure transducers. The onset of the flow at a given height is observed to coincide exactly with the beginning of the pressure drop; the transition is less sharp for the blockage since pressure diffusion is still significant even after the grain flow has stopped. The region between the two dashed lines in Fig. 6 corresponds to the flow phase (the lines are drawn, within experimental error, between points corresponding to times at which the flow is observed to start or stop). Comparing the widths of this region in the different curves confirms that the fraction of time corresponding to the flow phase increases with . On the contrary, the amplitude of the pressure drop decreases with .
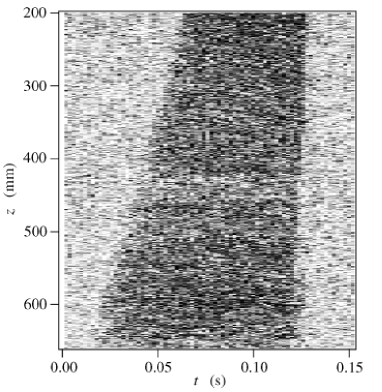
The propagation of the onset and blockage of the flow were studied more precisely on spatio-temporal diagrams of a 500 mm high region of the tube (Fig. 7). The diagram has been processed by subtracting each linear image from the next one to detect more precisely the onset and blockage of the flow. Domains corresponding to the static phase have a light shade (the difference is not zero because of the noise of the camera and the fluctuations of the illumination). The domain associated with the flow phase is globally darker (the fluctuations of the grey levels are large because one subtracts specular reflections of light on the beads varying very much during the motion). The velocity for the onset of the flow corresponds to the slope of the left boundary in Fig. 7: it was roughly constant in that experiment but decreases slightly with distance in others. The velocity for the blockage is given by the slope of the right boundary (averaged along the tube) and is lower than . Both the onset and the blockage propagate upwards. The variations of and with are plotted in Fig. 8.
The velocity for the blockage increases linearly with and ranges between 20 and 60 m s-1. This variation will be discussed in section IV.1. On the contrary, the velocity of the location of the onset of the grain flow (decompaction front) is independent of the mean superficial velocity and is of the order of 11 m s-1. This implies that the decompaction process is independent of the downwards structure of the flow and of the width of the constriction.
This velocity value may be related to the velocity of sound in two-phase systems with a large density and compressibility contrast between the two phases (water-air bubbles for instance). In this case, by assuming an isentropic expansion of the gas, one may compute the velocity of sound via Wallis69 :
| (4) |
in which and are the volume fraction and the density of the dense phase, is the atmospheric pressure and for air which is considered as having negligible density. This amounts to considering the air-grain system as a homogeneous mixture of both high compressibility and density resulting in a low sound velocity. Taking to be equal to the density of the grains and to the mean particle fraction 0.615 leads to 15 m s-1 which is indeed of the order of the value 11 m s-1 deduced experimentally ( represents a typical value of the average particle fraction as estimated from the measurements displayed in Fig. 10 assuming as above that = 0.63).
Data points from the four curves in Fig. 6 together with the boundary conditions at both ends of the tube provide the overall shape of the pressure profile along the tube. The spatial variation of at several different times during one same period of variation of the flow within the periodic sequence of Fig. 6 is displayed in Fig. 9.
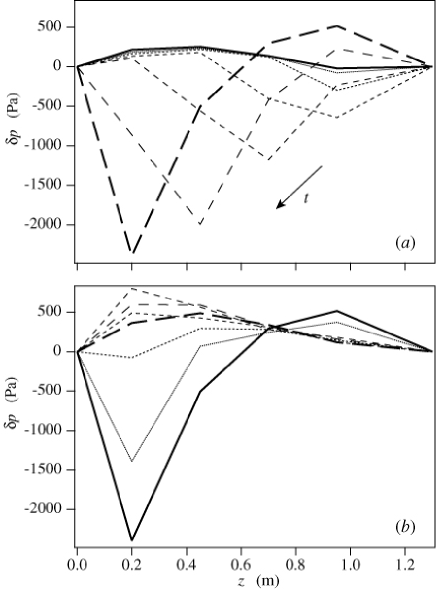
The thick solid line in Fig. 9() corresponds to the static phase. A pressure maximum subsists in the central part of the tube from the previous flow cycle and the associated pressure gradients drive air towards both ends of the tube through the motionless packing. When flow is initiated, a low pressure zone appears at the bottom of the tube where grains are moving, and propagates upwards. The amplitude of the pressure minimum increases strongly during this propagation. This amplification effect is discussed below in section V. After the pressure minimum has reached the top of the tube, pressure starts to increase again [Fig. 9()]. At first, the local particle fraction reaches a minimum and the expansion of the gas stops. Then, when the granular flow stops in the tube (first at the bottom), the particle fraction reverts back to its static value. Thus, air gets compressed above the atmospheric pressure since some additional air has leaked between the grains during the flow period (see for instance the curve corresponding to = 172 ms in Fig. 9()). Finally, the pressure profile along the static packing relaxes back to its initial distribution at the beginning of the flow phase and a new flow cycle may start again.
Note that when the intermittent flow regime does not appear spontaneously, it can also be triggered externally by periodic injections and suctions of air close to the constriction at a frequency comparable to that of the natural oscillations. The other characteristics of the flow such as the amplification of pressure and particle fraction variations as they propagate upwards are the same as in the spontaneous intermittent flow regime.
III.3 Particle fraction and flow rate variations
Spatio-temporal diagrams have allowed us to identify granular motions in the various phases of the intermittency process; their relation with the spatial distribution of the pressure has also been analyzed. We proceed by discussing flow rate and particle fraction measurements which provide additional information on the flow structure.
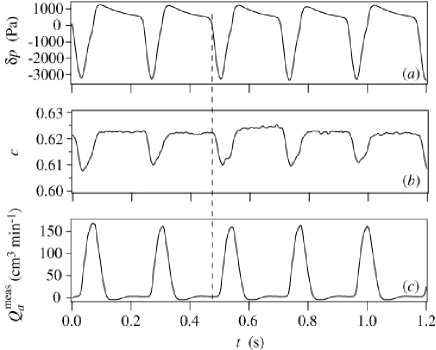
The variations of the particle fraction and pressure at a fixed height, and of the flux of air into the hopper are displayed in Fig. 10. Variations of the local particle fraction associated with the onset and blockage of the flow are only of the order of 0.015 in the present example and were never higher than 0.02. Moreover, these variations are evidently synchronous with those of the local pressure in the flowing phase. Note the slow pressure decay when the grains are at rest. The amplitudes of the variations of and decrease, while their duration increases with distance from the hopper. In addition to demonstrate this close correlation between the variations of and , our study indicates an increase of the amplitude of the variations with the instantaneous grain velocities.
The time recording of indicates a strong increase of the downwards air flow rate during the flow phase. This increase reflects the entrainment of air by the granular flow and the compensation of the volume of grains leaving the hopper by the inflow of air. The variation of is slightly delayed relative to those of and since a time is required for the grain flow to propagate to the top of the tube and into the hopper. A transient upward gas flow ( 0) is observed after grains stop moving in the upper part of the tube, corresponding to air being expelled through the grain packing.
IV Quantitative analysis of the intermittent flow components
IV.1 Conservation equations for air and grains
In the following, = 0 corresponds to the top of the tube and the coordinate increases downwards. Downflow is defined as being positive. and are, respectively, the grain and air velocities (averaged over the flow section) in the laboratory frame at a time and a distance from the hopper. They are related to the superficial velocities and and to the local particle fraction (also averaged over a flow section) by the relations:
| (5) |
| (6) |
The superficial velocity of the grains is related to the variation of with time by the volume conservation equation:
| (7) |
A similar relation can be written for the mass flux of air ( being its density):
| (8) |
Assume that the variations of the gas pressure are isentropic so that:
| (9) |
( is the atmospheric pressure, the air density at and =1.4). Then Eq. (8) becomes:
| (10) |
A first prediction provided by mass conservation conditions is the velocity at which the blockage front moves up the tube. We define to be the particle fraction in the static column and and the particle fraction and grain velocity right above the front. is obtained by expressing the conservation of mass of the grains in a slice of thickness while the front moves from the bottom to the top of the slice:
| (11) |
Since increases linearly with the superficial velocity , equation (11) implies therefore that should also increase linearly with . This agrees with the trend displayed in Fig. 8. Using the experimental values of , and provides an order of magnitude of ( 20 m s-1) which is in a good agreement with that obtained in Fig. 8.
IV.2 Relative magnitude of air flow components
Another issue regarding the flow of air through the system is the relative importance of the passive drag of air by the moving grains and of the permeation of air through the grain packing. The first flow component is equal to and the second is assumed to be related to the pressure gradient by Darcy’s equation:
| (12) |
where is the viscosity of air and the permeability of the grain packing. The superficial velocity of air is then given by:
| (13) |
Equations (7), (10) and (13) can be combined to yield:
| (14) |
in which the coefficient satisfies:
| (15) |
(the second order term has been neglected in Eq. (14)). Considering locally the system as a packing of spherical beads of diameter , the permeability of the grains can be estimated from the Carman–Kozeny relation:
| (16) |
In the following, we assume that to leading order, and , so that and are constants.
The average of over a flow period is determined by plotting the time averaged value of as a function of the ratio in Fig. 11 (this amounts to assuming that the mean grain velocity is equal to which is approximately verified due to the small relative variations of in these experiments).
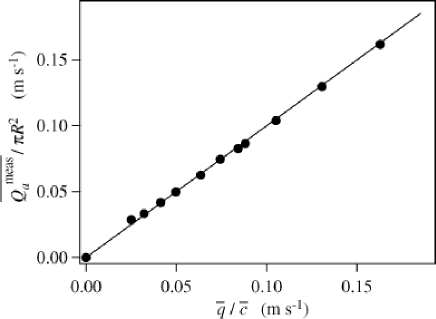
Volume conservation implies that and the sum of the volume flow rates of air and grains are equal [see Eq. (2)]. Using Eq. (13), this leads to:
| (17) |
Experimentally, the variation of with is linear with a slope equal to 1 0.02 in Fig. 11. These results indicate that the time average of is negligible within experimental error although its instantaneous value is non zero. The relative motion of air and of the grains is therefore significant only during transient flow.
IV.3 Pressure variation mechanisms
The dynamical properties of the system are largely determined by spatial and temporal variations of the air pressure. We first assume that variations of density are only due to those of the local particle fraction . This amounts to neglecting the permeation of air relative to the grains. Then, and are equal to zero in which case Eq. (10) becomes:
| (18) |
( and are replaced by and within a first order approximation). This relation is tested in Fig. 12 by plotting pressure variations as a function of particle fraction variations: for variations small compared to the mean value, data points should be located on the dashed line of slope shown on Fig. 12.
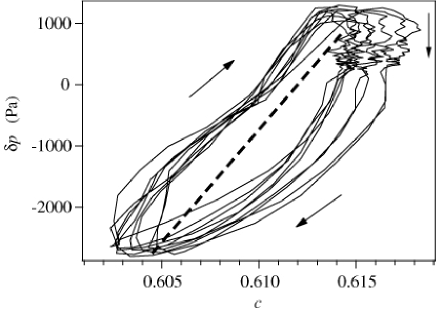
The two parameters are clearly strongly correlated and the slope of the curves has the right order of magnitude in the initial and final phases of the variation. However, pressure is higher in the blockage phase than during the development of the flow, indicating that cannot be neglected in Eq. (10) (the last term is of lower order and should remain negligible). Some air gets sucked into the lower pressure regions when grains flow; this leads to an overpressure when flow stops and the particle fraction increases.
This overpressure decays slowly during the remainder of the static phase (short vertical part of the curve at top right) due to the finite permeability of the packing. In this static phase of the flow sequence, . The two first terms on the right hand side of Eq. (14) are equal to zero leading to the diffusion equation:
| (19) |
Experimentally, the particle fraction varies from 0.605 to 0.625; the permeability computed from Eq. (16) ranges therefore from 23 10-12 to 29 10-12 m-2. Taking = 1.85 10-5 m2 s-1, = 105 Pa and a mean value of ( = 26 10-12 m-2), one obtains 0.5 m2 s-1. The characteristic diffusion distance during the period 0.25 s of the intermittent flow is 0.35 m which is comparable to the length over which pressure fluctuations diffuse. During the onset of the flow which takes place over a shorter time (a few hundredths of a second) the diffusion of the pressure variations is sufficiently small for Eq. (18) to be approximately valid. One thus concludes that the permeability of the grain packing is high enough to allow for relative motions between air and the grains during the flow phase; but too low to allow for a global mean flow of air through the packing. In the previous computation, the initial particle fraction of the static packing is taken equal to = 0.63. Assume that wall effects reduce this value to 0.61 as discussed in section II so that the particle fraction varies from 0.585 to 0.605 during a flow cycle. The mean corresponding value of is 32 10-12 m-2 so that would increase to 0.6 m2 s-1 and remain of the same order of magnitude as for = 0.63.
Our experiments suggest that the intermittent flows result from the amplification of pressure and velocity fluctuations appearing spontaneously or induced in the constriction at the bottom of the tube. One expects the period of the intermittency to be determined by the characteristics of the flow over the full length of the tube and not just at the constriction. The period of the flow is of the order of the characteristic diffusion time of air over a distance of half of the tube length. This diffusion time represents the order of magnitude of the time necessary for pressure perturbations induced during the flow period to relax before flow is reinitiated. It may thus be closely related to the duration of the static phase of the periodic flow.
V Modeling of the intermittent flow
In this section, the amplification of the decompaction wave as it propagates towards the top of the flow tube is modeled numerically. This approach yields insight into the dependence of the amplification on the permeability of the grain packing.
V.1 Equations of motion and force distributions
The equations of motion and force distribution in the granular packing will first be written. They will then be solved numerically together with the conservation equations for air and grains. For simplicity, one models the case of a lower particle fraction zone propagating upwards in a vertical channel.
The equation of motion reflecting momentum conservation for both air and grains contained in a vertical slice with tube radius can be written as:
| (20) |
(the equation has been divided by the section ). Acceleration terms for air have been neglected due to the large density difference between the air and grains. The friction forces on the air applied at the walls are similarly negligible due to their low area compared to that of the grains.
Note that when Eq. (20) (excluding the gravity, , and terms) is combined with Eq. (14) (neglecting the second order and diffusion terms), one obtains a sound wave propagation equation with a velocity given by Eq. (4).
The left side of Eq. (20) corresponds to the acceleration term and the first term on the right to the weight of the grains. and represent, respectively, friction forces on the grains at the lateral walls and vertical stress forces between grains in the tube section; they are assumed to be constant around the perimeter of the tube and in each section. is then estimated by applying Janssen’s model Janssen95 ; Gennes99 ; Duran00b assuming first that following Coulomb’s relation. is taken to be , where the coefficient depends on the structure of the packing and of the surface properties of the grains. Equation (20) then becomes:
| (21) |
in which the characteristic length is given by:
| (22) |
In a static packing, all terms involving the grain velocity vanish: the weight of the grains is balanced by the pressure gradient and the stress forces at the walls and in the tube section. When flow starts, the local particle fraction decreases [Fig. 10()] which, in turn, reduces friction forces at the walls, resulting in an acceleration of the flow. No exact relation is available on the variations of the stress forces. It will be assumed in the following that the resultant of the weight of the grains, the pressure gradient and the friction forces increases linearly with the deviation of the particle fraction from its static value . Equation (21) then becomes:
| (23) |
where is the parameter characterizing the magnitude of the variation. This assumption represents a first order approximation: it will be valid in the initial phase of the development of the perturbation as long as the derivative of the resultant force with respect to the particle fraction is non zero for . Other types of functions may be envisioned to replace : many will also reproduce an amplification phenomenon provided they predict a resultant force in the right direction with a monotonous dependence on () and if (as will be seen below) the prefactor equivalent to is large enough.
V.2 Numerical procedure
Numerical simulations are realized on a simplified 1D model in which a region of reduced particle fraction (called bubble) moves upwards inside a vertical tube filled with an otherwise grain packing. The bubble length is much smaller than that of the tube and it is assumed to be far enough from either of the ends that boundary conditions do not influence the motion. As suggested by the experimental observations, the particle fraction and the velocity are discontinuous at the bottom end of the bubble (the blockage front), while they vary continuously at the top (the decompaction region). Air pressure is continuous in both cases but the pressure gradient is discontinuous at the lower front.
In order to solve the problem numerically, one uses the conservation equations for grains (7) and air (10) established in section IV and the equation of motion (23) of the grains. For the sake of practicality, Eq. (14), in which Darcy’s law is used to determine , replaces Eq. (10). In the static regions of the packing, all terms in Eqs. (7) and (23) are equal to zero. Equation (14) reduces then to the diffusion equation (19) for air with a coefficient given by Eq. (15).
At large distances below and above the bubble, the air pressure is equal to the atmospheric pressure ; and are respectively equal to and zero both far above the bubble and everywhere below the blockage front. Additional boundary conditions corresponding to the mass conservation for air and for the grains must also be verified at the lower front (in addition to pressure continuity). In the reference frame moving with the front at , grain mass conservation is expressed by Eq. (11) which can be rewritten as:
| (24) |
In the same way, the mass conservation of air implies:
| (25) |
The indexes + and - correspond to values close to the blockage front respectively inside the bubble and in the static zone. Combining Eqs. (24) and (25) leads to:
| (26) |
The initial particle fraction, velocity and pressure profiles are assumed to follow a variation with a cutoff at the lower front () for and . Pressure is continuous at with a faster decrease below. The corresponding profiles are displayed in Figs. 13(–) (rightmost solid curves). The initial particle fraction and pressure variations are related by Eq. (9) above the front (this amounts to assuming that the bubble has been created through a local decompaction of the grains inducing an isentropic adiabatic expansion of the air). The amplitudes of these initial variations are respectively = 0.001, = 600 Pa and = 3 10-3 m s-1.
Pressure, particle fraction and grain velocity profiles at subsequent time steps are then computed by solving numerically Eqs. (7), (14) and (23) in the reference frame of the front using a finite difference Euler explicit scheme. For the resolution of Eq. (23), an upwind scheme was required to avoid numerical instabilities due to the advection term . The global length of the simulation domain is 1.4 m and the mesh size 2 mm. The origin of distances is taken at the initial location of the front (the vertical dashed line on Figs. 13(–)). Simulations correspond to a time lapse of 27 ms during which the bubble propagates over a distance of 0.4 m. At each step of the simulation, the pressure, the particle fraction and the velocity are determined at all distances from the front and the front velocity is also obtained. This allows one in particular to determine the new location of the front after each time step and to translate distances from the front into distances in fixed coordinates which will be used in subsequent plots.
V.3 Numerical results
V.3.1 Qualitative observations
Particle fraction, velocity and pressure profiles at different times obtained for a typical set of values of , and are displayed in Fig. 13. The other parameters of the simulation are given by the experimental values listed above or computed from and .
A clear amplification effect is observed for all three parameters. The velocity reaches its maximum value faster than both the particle fraction and the pressure (typically after 0.3 m versus 0.5 m). The ratio of the maximum and initial amplitudes is also higher (20 for versus 2 and 1.6 for and ). A small localized overpressure appears in the static region close to the initial location of the bubble: it is due to air advected by the grains into this region at short times [from Eq. (26)]. At later times, the pressure gradient close to the front increases so that the diffusion of air back into the bubble balances the advection term. The increase of the amplitude of the variations of and is consistent with the decrease of the width of these curves: the total area under these curves must remain constant as required by mass conservation of air and grains. The velocity of the lower front is also roughly constant with a value 12.5 m s-1 of the same order of magnitude as that observed in our experiments.
While the computed amplitude of the pressure variations is of comparable magnitude to the experimental ones, particle fraction and velocity variations are smaller. This is likely a result of the difference between the model case of a localized bubble and the actual intermittent flow which sometimes extends over the entire length of the tube.
V.3.2 Quantitative dependence on the modelization parameters
The key adjustable parameter in the model is the coefficient in Eq. (23) (that characterizes the effective acceleration of the grains when the particle fraction decreases below ). Figure 14 displays the dependance on of the front velocity and of the parameter characterizing the amplification. is determined by plotting the minimum value of the pressure variation curves [as shown in Fig. 13()] as a function of the coordinate of the front for each curve. After a short transient, increases quickly with and the variation levels off thereafter. The amplification parameter is taken equal to the maximum absolute value of the slope of this curve. The permeability of the grain packing has been taken equal to the value = 20 10-12 m2). Using the values of () deduced from the simulations, the maximum value = 500 in Fig. 14 corresponds in Eq. (23) to an effective acceleration of the grains of the order of or lower.
For = 0, is negative and initial variations of and damp out as the bubbles propagate upwards. becomes equal to 0 for = 40 and increases steadily at higher values. The front velocity also increases with in the amplification domain but never becomes zero. Its value is of the same order of magnitude as the experimental front velocities, particularly when is large. We note that in the case of a bubble of slowly varying length, and are nearly equal while they differ in the experiments so that more detailed quantitative comparisons would be irrelevant.
These results indicate that the simple model discussed above allows us to reproduce the amplification effect observed experimentally. In the following, it is applied to study the influence of the permeability of the grain packing on the amplification process.
The permeability influences the dynamics of the system through the diffusion coefficient which is proportional to and appears in Eq. (14). The dependance of and the amplification parameter on are displayed in Fig. 15. The range of permeabilities investigated is between 0.5 and 4 times the value = 20 10-12 m2 assumed in Fig. 14.
The front velocity is first almost independent of while sharply decreases with and vanishes for 80 10-12 m2. Note that reducing from 0.63 to 0.61 assuming the influence of wall effects increases the permeability from 22 to 27 10-12 m2 and only reduces the amplification parameter by roughly 15%.
The above results demonstrate that the diffusion term proportional to (and therefore to ) in Eq. (14) is purely dissipative and acts only to enhance the attenuation of the decompaction wave. This results from the fact that, in high permeability packing, pressure variations induced by the decompaction quickly diffuse away from the front. On the contrary, in low permeability systems, these pressure variations remain localized: their gradients accelerate nearby grains and so sustain and amplify the motion. Intermittency effects can therefore be expected to be stronger for flowing grains of smaller diameter.
VI Conclusion
An experimental study has allowed us to analyze the dynamical properties of periodic intermittent vertical compact flows in a tube. Our experiments involved simultaneous measurements of local pressure and particle fraction fields, combined with spatio-temporal diagrams.
A key observation is the amplification of the particle fraction and pressure variations as the decompaction front marking the onset of the flow propagates upwards. This propagation takes place at a much higher velocity ( 10 m s-1) than that of the grains (a few 10-1 m s-1). The velocity of the blockage front is still faster than : it increases with the flow rate and ranges between 20 and 50 m s-1.
The characteristic grain velocity during the flow phase increases with height above the outlet: this variation is associated with a decrease with height of the duration of the flow phase as required by the mass conservation of the grains. Close to the top of the flow tube, represents only 10% of the total flow period . The grain velocities and amplitude of the pressure fluctuations are sufficiently high in this zone that flow from the feeding hopper gets blocked and a transient low particle fraction region appears briefly at the top of the tube.
A characteristic feature of these flows is the small amplitude of the particle fraction variations (0.02–0.03 at most); this is much smaller than variations observed in the decompaction of a granular column with an open bottom end or a flow in the density wave regime. It is noteworthy that these small particle fraction variations nevertheless induce large pressure drops (up to 3000 Pa at the top of the tube). The decompaction process is indeed fast enough for air to undergo an isentropic expansion: pressure variations closely mirror the variations of the local particle fraction. Diffusion of air through the grain packing is too slow to influence strongly that phase; however, it plays an important role in the longer static phase by allowing the decay of the pressure towards equilibrium before flow is reinitiated. The characteristic time for air diffusion through the packing is of the order of the total period of the intermittent flow and may be a key factor determining its value.
The amplification effect can be reproduced by a 1D model assuming an effective driving force on the grains that increases with the deviation of the particle fraction from the static value. This numerical model also indicates that the permeability of the packing is a very important factor. The amplification effect (and perhaps also the intermittent flows) should be observable only if is sufficiently low that pressure perturbations do not diffuse away too quickly.
Another important parameter is the relative humidity of the surrounding air which influence strongly the interaction forces both between the grains and between the grains and the tube walls. Preliminary results indicate that the intermittent flow regime is rarely observed at relative humidities of the order of 40% or below, at least with the beads used in the present study. Systematic studies in a broad range of relative humidities should greatly help understand better the interaction forces which determine the characteristics of these intermittent flows.
ACKNOWLEDGEMENTS
We wish to thank B. Perrin and E. J. Hinch for helpful suggestions and discussions during this work. We thank D. Gobin and Ch. Ruyer-Quil for their help for the numerical simulations and G. Chauvin, Ch. Saurine and R. Pidoux for the realization of the experimental setup. We are grateful to J. W. M. Bush and Ph. Gondret for a thoughtful reading of the manuscript. We finally wish to thank T. Raafat and V. Terminassian for their participation to early experiments.
References
- (1) S. Laouar and Y. Molodtsof, Experimental characterization of the pressure drop in dense phase pneumatic transport at very low velocity, Powder Technol. 95, 165 (1998).
- (2) T. Raafat, J. -P. Hulin and H. J. Herrmann, Density waves in dry granular media falling through a vertical pipe, Phys. Rev. E 53, 4345 (1996).
- (3) L. S. Leung and P. J. Jones, Flow of gas-solid mixtures in standpipes. A review, Powder Technol. 20, 145 (1978).
- (4) T. M. Knowlton, T. J. Mountziaris and R. Jackson, The effect of pipe length on the gravity flow of granular materials in vertical standpipes, Powder Technol. 47, 115 (1986).
- (5) J. -L. Aider, N. Sommier, T. Raafat and J. -P. Hulin, Experimental study of a granular flow in vertical pipe: a spatio-temporal analysis, Phys. Rev. E 59, 778 (1999).
- (6) Y. Bertho, F. Giorgiutti-Dauphiné, T. Raafat, E. J. Hinch, H. J. Herrmann, and J. -P. Hulin, Powder flow down a vertical pipe: the effect of air flow, J. Fluid Mech. 459, 317 (2002).
- (7) S. B. Savage, Gravity flow of cohesionless granular materials in chutes and channels, J. Fluid Mech. 92, 53 (1979).
- (8) J. T. Jenkins and S. B. Savage, A theory for the rapid flow of identical, smooth, nearly elastic, spherical particles, J. Fluid Mech. 187, 53 (1983).
- (9) E. Azanza, F. Chevoir and P. Moucheront, Experimental study of collisional granular flows down an inclined plane, J. Fluid Mech. 400, 199 (1999).
- (10) Y. M. Chen, S. Rangachari and R. Jackson, Theoretical and experimental investigation of fluid and particle flow in a vertical standpipe, Ind. Eng. Chem. Fundam. 23, 354 (1984).
- (11) H. A. Janssen, Versuche über getreidedruck in silozellen, Z. Ver. Dtsch. Ing. 39, 1045 (1895).
- (12) J. Duran, Sands, Powders and Grains. An introduction to the Physics of Granular Materials (Springer-Verlag, Berlin, 2000).
- (13) X. -l. Wu, K. J. Måløy, A. Hansen, M. Ammi and D. Bideau, Why hour glasses tick, Phys. Rev. Lett. 71, 1363 (1993).
- (14) K. J. Måløy, M. Ammi, D. Bideau, A. Hansen and X. -l. Wu, Quelques expériences sur le sablier intermittent, C.R. Acad. Sci. Paris 319, 1463 (1994).
- (15) T. Le Pennec, M. Ammi, J. C. Messager, B. Truffin, D. Bideau and J. Garnier, Effect of gravity on mass flow rate in an hour glass, Powder Technol. 85, 279 (1995).
- (16) T. Le Pennec, K. J. Måløy, A. Hansen, M. Ammi, D. Bideau and X. -l. Wu, Ticking hour glasses: experimental analysis of intermittent flow, Phys. Rev. E 53, 2257 (1996).
- (17) C. T. Veje and P. Dimon, The dynamics of granular flow in an hourglass, Granular matter 3 (Springer-Verlag, Berlin, 2001), pp.151-164.
- (18) G. B. Wallis, One-dimensional two-phase flow (McGraw-Hill, New-York, 1969).
- (19) P. G. de Gennes, Granular matter: a tentative view, Rev. Mod. Phys. 71, S374 (1999).