Effect of the s,p-d exchange interaction on the excitons in (Zn,Co)O epilayers
Abstract
We present a spectroscopic study of Zn1-xCoxO layers grown by molecular beam epitaxy on sapphire substrates. Zn1-xCoxO is commonly considered as a promising candidate for being a Diluted Magnetic Semiconductor ferromagnetic at room temperature. We performed magneto-optical spectroscopy in the Faraday configuration, by applying a magnetic field up to 11 T, at temperatures down to 1.5 K. For very dilute samples (), the giant Zeeman splitting of the and excitons is observed at low temperature. It is proportional to the magnetization of isolated Co ions, as calculated using the anisotropy and g-factor deduced from the spectroscopy of the transitions. This demonstrates the existence of spin-carrier coupling. Electron-hole exchange within the exciton has a strong effect on the giant Zeeman splitting observed on the excitons. From the effective spin-exciton coupling, eV, we estimate the difference of the exchange integrals for free carriers, eV. The magnetic circular dichroism observed near the energy gap was found to be proportional to the paramagnetic magnetization of anisotropic Co ions even for higher Co contents.
pacs:
75.50.Pp, 75.30.Hx, 78.20.Ls, 71.35.JiI Introduction
Theoretical predictions,Sato00 ; Diet01 ; Blin02 ; Spal04 and first reports of room temperature ferromagnetism in Zn1-xCoxO,Ueda01 ; Lim03 ; Rode03 ; Rama04 ; Tuan04 ; Kitt05a ; Venk04 have strongly stimulated researches on this wide bandgap Diluted Magnetic Semiconductor (DMS). However, the origin of the observed ferromagnetic behavior remains controversial, and the existence of a coupling between the magnetic and electronic properties has still to be demonstrated, and its magnitude evaluated.Venk04
Most of reported studies rely on magnetometry. Direct magnetization measurements on thin DMS layers are particularly difficult, because the magnetic signal from the thin layer is usually small compared to the diamagnetic contribution from the much thicker substrate. Magneto-optical spectroscopy on the excitonic transition and Magnetic Circular Dichroism (MCD) in the vicinity of the bandgap can be used very efficiently to measure the temperature and magnetic field dependence of the magnetization, using the giant Zeeman effect of substitutional magnetic ions coupled to the band electrons, and to discriminate the contribution from magnetic ions incorporated in spurious phases. In addition, the observation of the intra-ionic transitions gives us an information on the electronic structure of the incorporated magnetic impurity, and allows us to measure accurately the parameters describing its ground level and governing the magnetization of the isolated impurities. Finally, combining the two sets of data, on can deduce the magnitude of the exchange interactions between localized spins and free carriers.
This paper describes the results of such a study conducted on a set of Zn1-xCoxO layers with various Co concentrations, including very dilute samples which feature well resolved excitonic lines, so that we can measure the exchange Zeeman splitting. It fills the gap existing between recent magneto-optical studies of Zn1-xCoxO layers with a high Co content, where large linewidths prevent any direct observation of the exchange Zeeman splitting,Ando01 ; Ando01b ; Ando02 ; Ando04 ; Schw03 ; Kitt05b ; Tuan04 and early studies of very dilute Zn1-xCoxO bulk samples without applied field.Koid77 ; Papp61 ; Anderson67 ; Shul87
II Samples and experiment
About 1m-thick layers were grown on sapphire substrates by plasma-assisted molecular beam epitaxy. Two dimensional growth was achieved for a growth temperature of 560∘C (i.e., 50∘C higher than the optimal growth temperature used for ZnO), resulting in streaky RHEED patterns. The Co content of several layers was measured by energy dispersive x-ray analysis (EDX). For low Co contents (), the full widths at half maximum of the x-ray rocking curves are in the range of along (002), (), and (105). The low, identical values of measured both for () and (105), indicate a large column diameter, close to 1m (up to ). While the column diameters remain large, values are found to increase slightly and gradually with the Co concentration. For , measured values are , , and along (002), (), and (101) respectively. For all compositions, the c-axis of the wurtzite structure is perpendicular to the film plane. No other orientation or column rotation were detected. The conductivity of the films is n-type, with residual carrier concentrations cm-3, below the Mott transition. The thickness of the layer was checked on the electron microscope image of a cleavage plane.
Reflectivity, transmission and photoluminescence (PL) measurements were performed in the Faraday configuration, with the optical axis and a magnetic field (up to 11 T) both parallel to the c-axis, at temperatures down to 1.5 K. A high-pressure Xe lamp was used for transmission and reflectivity; PL was excited with a He-Cd laser.
III Spectroscopy of cobalt ions
We measured the characteristic absorption lines and bands in every studied Zn1-xCoxO sample from the most diluted one () up to the most concentrated one (). Examples are given in Fig. 1(a) for the spectral range of interest in the following. These lines and bands have been already identified as intra-ionic transitions of cobalt in bulk samples by P. Koidl.Koid77 For substitutional Co ions, the different eigenstates associated to the 3d7 configuration are labeled using the notation of Mcfarlane.Macf70
We will particularly study the transitions between the ground state and the excited state arising from the cubic part of the crystal field. Both quadruplets are further split into two components (two Kramers doublets), and , by the spin-orbit coupling and the trigonal component of the crystal field. For the ground states, we label the two spin sublevels of and the two spin sublevels of . The splitting of the ground states is to small to be resolved in the spectra of Fig. 1(a), while that of the excited state is clearly visible.
Other lines which can be seen at higher energy in Fig. 1(a) have been attributed by Koidl Koid77 to transitions to other excited levels. They are broader, and hence more difficult to study quantitatively in thin layers since transmission spectra are plagued by interferences between the surface of the layer and the interface with the substrate.
In this section we use the transition to (A) estimate the Co content in samples which have not been characterized by EDX (particularly at low Co content), (B) confirm the parameters describing the ground state and the excited state (anisotropy and g-factors), and the oscillator strengths of transitions and (C) from a complete description of the intensities of the absorption lines, confirm the population distribution in the ground level and deduce the magnetization of the system of localized spins.
III.1 Calibration of Co concentration
In a set of samples, where the cobalt concentration was determined by EDX, the absorption coefficient of the line [at 1880meV, Fig. 1(a)] increases linearly with the Co concentration up to 6%. [full circles in Fig. 1(b)]. The calibration curve obtained with these samples was used to determine the cobalt concentration in other samples [open squares in Fig. 1(b)].
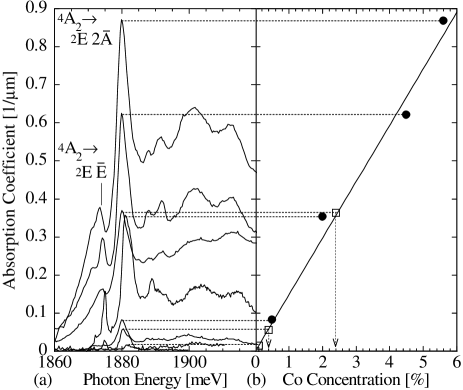

The linear behavior observed up to a Co concentration of about 6% indicates that the absorption coefficient is sensitive to the total concentration of Co2+ ions substituting Zn in the wurtzite lattice. In particular, it does not discriminate the different nearest neighbor configurations: isolated ions, antiferromagnetic or ferromagnetic cobalt pairs, triplets, or other complexes. In the cation sublattice of the wurtzite structure, every cation has 12 nearest neighbors: 6 neighbors in the same layer, and 3 neighbors in the next layer on each side, at almost the same distance. These 12 neighbors are usually considered as equivalent (see, e.g., the study of Zn1-xMnxOchik05 ). Assuming a random distribution of Co ions, the probability to find an isolated cobalt ion (without any cobalt ion in a nearest neighbor position) is given by . For a total concentration , half of the Co ions have at least one Co ion as a nearest neighbor. That means that the concentration of isolated Co ions, , significantly deviates from the straight line drawn in Fig. 1(b)].
The magnetic properties of a set of isolated Co ions and of nearest neighbors complexes are expected to be very different at low temperature. Antiferromagnetic nearest-neighbor pairs are blocked antiparallel; in many DMSs, this gives rise to a series of steps and plateaux in the high field part of the magnetization cycles. At smaller fields, the magnetization is well described if one replaces the total number of spins, , by an effective number of spins, . The value of has been determined in a large number of DMSs with the zinc-blende structure. It does not depend on the chemical nature of the DMS, which suggests that it corresponds to a statistical distribution in an ensemble of randomly occupied sites. For small values of , the above value of coincides with the experimental valueGaj94 of in Cd1-xMnxTe. We shall use this approximation in the following.
III.2 Magnetospectroscopy
We combine PL and absorption data involving the intra-ionic transitions in order to check the parameters governing the evolution under magnetic field of the ground state. Fig. 2(a) shows the spectra around the zero phonon PL lines near 1875 meV. Two PL lines with equal intensities are observed in zero magnetic field. They have been identifiedKoid77 as transitions from the excited state to the two components of the ground state ( and ). In the presence of a magnetic field parallel to the c-axis, we observe six PL lines [see Fig. 2(a)], which were identified as transitions between the different spin sublevels of the ground and excited states split by the Zeeman effect. In agreement with the selection rules for dipolar transitions (see Table 1),Macf70 for light propagating along the c-axis, two transitions are forbidden, three lines are observed in polarization and three in polarization.
The transitions observed in PL are also visible in absorption [Fig. 2(b)]. Fig. 2(c) shows the position of the PL and absorption lines as a function of the intensity of the magnetic field up to 11T. The solid lines are calculated using 4 fitting parameters: values of the Landé factors for the ground state and for the excited state, a zero-field splitting of the ground state meV, and an energy of the zero field transition between and equal to 1875 meV. These parameters, obtained for a (strained) layer with 2% Co, are in good agreement with the values obtained theoretically or from other experimental techniques (see Table 2). The corresponding energy diagram and the scheme of transitions are shown in Fig. 2(d).
| Parameter | This work | References | |
|---|---|---|---|
| -3.52 | -3.358111Theory, calculated by R. M. MacfarlaneMacf70 | ||
| 2.28 | 2.238422footnotemark: 2 | ||
| 0.69 meV | 0.68 meV222EPR experiment done by N. Jedrecy et al.Jedr04 , diluted sample | ||
| energy | 1875 meV | 1877 meV333Optical absorption measured by P. KoidlKoid77 , diluted sample |
Since we shall be interested in the magnetic properties of the Co system, it is important to note that in zero magnetic field, the states are at lower energy than the states. This ordering induces a spin anisotropy with an easy axis perpendicular to the c-axis. Due to the three times larger Zeeman splittingMacf70 of the states, if the field is along the c-axis, we observe a crossing of with at 5.2 T [See Fig. 2(d)].

III.3 Populations of the spin sublevels and magnetization
The magnetization of the Co system is determined by the population of the different spin sublevels of the ground state. We now check these populations from the absorption intensities and calculate the expected magnetization.
For a better accuracy, we used magneto-absorption spectra from a sample with a higher Co content, 4.5% [Fig. 3(a)]. As each absorption intensity is proportional to the population of the initial state, we observe only four transitions, which are labeled as in Fig. 2.
Using the parameters determined from the previous PL and absorption data (Table 2), and assuming gaussian line shapes with a linewidth equal to 1.44 meV, we were able to fit the whole set of spectra with the intensity of each line as adjustable parameters. The resulting intensities are shown by symbols in Fig. 3(b). At low temperature ( K), two transitions (L2 and L3) keep zero intensity for every magnetic field.
The integrated intensity of each absorption line is proportional to the occupancy of the initial state and to the oscillator strength of the transition. Relative oscillator strengths are easily determined from extreme cases where one level is populated. At K and T only transitions L2 and L3 are visible [Fig. 3 (a) and (b)] because only the state is occupied. Similarly, in zero magnetic field only the and states are occupied so that only L1 and L1 are observed. Measuring the relative intensities in zero magnetic field and with T leads to the conclusion that the relative oscillator strengths of L1, L2, L3 are 1 : 0.7 : 0.35 [see Fig. 3(b)]. We expect that the pairs of lines (L1 and L1), (L2 and L2), and (L3 and L3), have equal oscillator strengths because of time reversal symmetry in zero field. Independently, the relative oscillator strength of L1, L2 and L3 can be estimated from the intensity of PL lines in T, when only the lower component () of excited state is occupied during the lifetime [Fig. 2(a)]. The oscillator strengths are summarized in Table 3.
| Transition | L | L | L2 | L2 | L3 | L3 |
|---|---|---|---|---|---|---|
| Excited state | ||||||
| Ground state | ||||||
| Relative OS (from abs.) | 1 | 1 | 0.7111 from time reversal symmetry | 0.7 | 0.35222not very accurate, see Fig. 3(b) | |
| Relative OS (from PL) | 1 | 0.8 | 0.1522footnotemark: 2 |
The occupancy of the different spin sublevels can be calculated using the parameters of Table 2 and assuming a Maxwell-Boltzmann distribution. The solid lines in Fig. 3(b) show the corresponding intensity calculated for each line using the relative oscillator strengths of Table 3. Experimental data for L1, L1, and L2 are in good agreement with the calculation. A significant discrepancy appears for L3. For this line, the determination of the integrated intensity is made difficult by the overlap with L1. Moreover a magnetic field dependence of the oscillator strength cannot be ruled out experimentally.
The experimental absorption intensities divided by the relative oscillator strengths give us a direct information about the expected cobalt mean spin, which can be calculated using
| (1) |
where denotes the experimental intensity of absorption line LN, and denotes the oscillator strength ratio of lines L2 and L1 (it is equal to 0.7, see Table 3). We do not use L3 since its experimental intensity is doubtful. The expected value is shown by symbols in Fig. 3(c), as a function of the magnetic field along the c-axis, for two temperatures: 1.7 K and 6 K. It clearly deviates from an isotropic Brillouin function.
Here again, assuming a Maxwell-Boltzmann distribution and using the parameters of Table 2, we can calculate the mean spin of an isolated cobalt, as a function of temperature and magnetic field along the c-axis,
| (2a) | |||
| (2b) |
where denotes the Boltzmann constant and the Bohr magneton. Parameters and 2 are given in Table 2. The result is shown as solid lines in Fig. 3(c).
Particularly for very low temperatures, the field dependence of the magnetic moment deviates from the Brillouin function B3/2 characteristic for an isotropic spin. A step is visible at 5 T, as an effect of the crossing between and [Fig. 2(d)]. Also, if we plot the inverse of the low-field susceptibility as a function of temperature, we observe a clear deviation from a Curie law.Ferr05 These two effects mimic the magnetization steps and Curie-Weiss law observed to be due to spin-spin interactions in the case of DMSs containing the isotropic Mn spin; here they are simply due to the single-ion anisotropy of the Co spin.
The magnetization of the cobalt system is directly related to the previous mean spin value [Eqs. (1) or (2)]:
| (3) |
In section IV we describe results of magnetooptical measurements performed at photon energies close to the energy gap of Zn1-xCoxO. In section V, we compare them with the magnetization above.
IV Excitonic SPECTROSCOPY
In this section, we first recall the main characteristics of the spectroscopy of ZnO, a wide gap semiconductor with the wurtzite structure and a small spin-orbit coupling. Then we describe the giant Zeeman effect observed on sharp excitonic transitions in very dilute Zn1-xCoxO layers. Finally we turn to our observations of near-gap magnetic circular dichroism in layers with a larger cobalt content.

IV.1 Zero field results
ZnO and Zn1-xCoxO naturally crystallize in the wurtzite structure. In this structure, the trigonal component of the crystal field and the spin-orbit coupling split the valence band in the center of Brillouin zone into three valence band edges. These splittings are small and, in epitaxial layers, they depend on the residual strain. Actually, the position and the symmetry of the valence edges are still a mater of controversy even in bulk ZnO.
Three excitons can be detected in ZnO. They are labeled , in the order of their position in the spectra, independently of their symmetry. Exciton , which appears at the lowest energy, is associated to the valence band edge at the highest energy, and to the edge at the lowest energy.Langer70 ; Reynolds99 ; Gil01a ; Gil01b ; Lamb02 Both the and excitons are observed by reflectivity at normal incidence (), hence in polarization (electric field of the light perpendicular to the c-axis of the crystal, ), while exciton can be observed only in polarization ().
These three valence band edges result from the combined effect of the trigonal crystal field (described by a parameter noted ) and the anisotropic spin-orbit coupling (two parameters, , ). In ZnO, the spin-orbit coupling is much smaller than the trigonal crystal field (more precisely, is much smaller than ). Hence the trigonal field splits the p-like states which form the top of the valence band into a doublet (, in-plane p-states) and a singlet (, out-of-plane p-states). As a result of the spin-orbit coupling, the orbital doublet is split into two (orbit+spin) doublets (, ), and the orbital singlet forms a doublet with a very small admixture of the states.
Exciton , which is active in polarization, is unambiguously ascribed to the doublet. The attribution of excitons and is not straightforward. The splitting energies are given by:Lamb02
| (4) |
| (5) |
Lambrecht and co-workersLamb02 have obtained the following parameters for pure ZnO: meV, meV and meV. We cite only the absolute value of , because we do not want to suggest any particular energy order for the valence states: a positive sign of implies that the valence state has the symmetry,Langer70 ; Reynolds99 ; Gil01a ; Gil01b a negative sign that is .Lamb02 ; Grub04 ; Thom60 Actually, taking into account that the spin-orbit parameter is much smaller than , we obtain the approximate splitting energies: , , and .
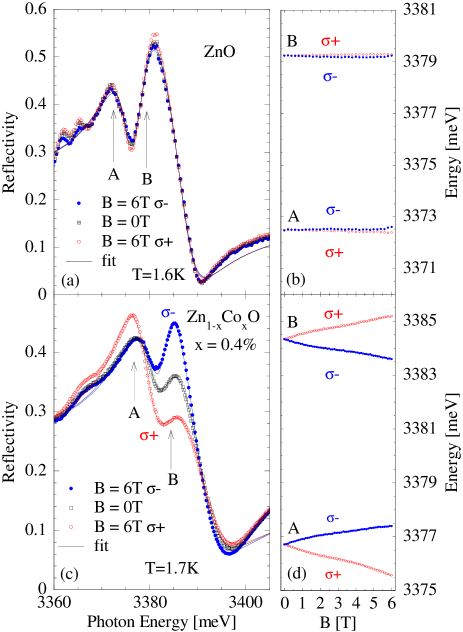
In thin epilayers with the c-axis perpendicular to the plane, reflectivity measurements in polarization (, ) are particularly difficult. In order to observe exciton we performed reflectivity measurements with the sample tilted by an angle of 45 degrees with respect to the optical axis. Then the selection rule is relaxed, and we can observe all three excitons [Fig. 4(a)]. Spectra are analyzed using the polariton formalism described in the Appendix.
We observe a systematic increase of the excitonic transition energies with the Co concentration in all studied samples [Fig. 4(b)]. This indicates an increase of the energy gap of Zn1-xCoxO with . The energy of exciton is meV meV. The energy differences between the excitonic lines in zero field are meV and meV, whatever the Co content.
Using the approximate splitting energies above, we obtain meV and meV. The difference in between the present layers and values previously reported for bulk samplesLamb02 may be due epitaxial strain, but also for a good part to the fact that polaritons were not taken into account.
Finally, as we observe excitons, we should take into account the electron-hole exchange, which is by no way negligible in ZnO. As the value of the parameters describing the excitons in ZnO is still a matter of debate, we keep for a while this simple description, and we will come back to this important point in section V.B.
IV.2 Zeeman effect
We performed magneto-optical spectroscopy in the Faraday configuration, by applying a magnetic field up to 6 T parallel to both the c-axis and light propagation. In this configuration, excitons and are observed in both and circular polarizations. The reflectivity spectra in each circular polarization were analyzed by taking into account the formation of excitonic polaritons. Polaritons are particulary important in the case of ZnO because of the strong coupling between excitons and photons. The dielectric function and the reflectivity spectra near excitonic resonances have been described in detail by Hopfield and ThomasHopf63 and by Lagois.Lago77 ; Lago81 The application of this theory to our case is described in Appendix.
The transition energies of both and and the corresponding values of the Zeeman splitting [Fig. 5] where obtained in a two-step procedure. First, the whole set of parameters (polarizability , position , width , the dead layer thickness , and the non resonant absorption contribution ) were determined by fitting the zero field spectra. Then, the spectra under magnetic field were fitted by adjusting only five parameters: , , and the relative polarizability of excitons and (keeping constant the sum ).
We did not observe any excitonic diamagnetic shift, as expected due to the small excitonic Bohr radius () in ZnOBlat82 (the diamagnetic shift is smaller than 0.1 meV at T, so it is smaller than 0.003 meV).
For ZnO, the Zeeman splitting of excitons and at 6T remains very small (about 0.1 meV). Such a value corresponds to an effective excitonic Landé factor less than 0.3. Such a small value of the Landé factors for the allowed excitonic transitions in ZnO has been already reported in the Voigt configuration by Blattner et al.,Blat82 and more recently by Reynolds et al. Reynolds99 In this work, the experiments are performed in the Faraday configuration and they confirm unambiguously the previous observations.
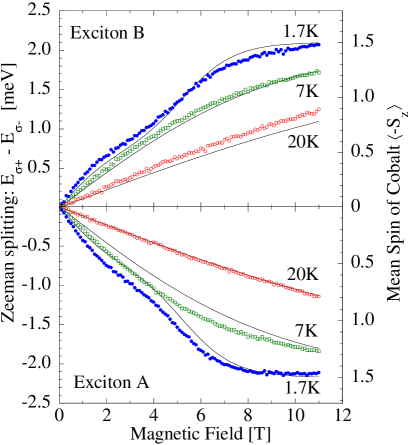
In samples doped with cobalt ions, we observe an enhancement of the excitonic Zeeman splitting. The Zeeman splitting of excitons and is almost opposite. It increases with the Co concentration [Fig. 6], and decreases with temperature. Fig. 7 shows the Zeeman splitting of excitons and as a function of the magnetic field up to 11 T, at three temperatures: 1.7 K, 7 K and 20 K. A saturation appears at the lowest temperature and the highest magnetic field. The Zeeman splitting is proportional to the mean spin projection calculated for isolated Co in section III [Eqs. (1) and (2)].
This enhancement of the Zeeman splitting which increases with the cobalt content, and its proportionality to the Co magnetization, are essential for this study. They are analyzed in section V as a consequence of interactions.


IV.3 Magnetic Circular Dichroism
In samples with Co concentration above , the broadening of the excitonic lines prevents a direct observation of the Zeeman splitting of excitons and . In such a case, we measured the degree of circular polarization of the transmitted light, . For the sake of comparison with published data,Ando01 ; Ando01b ; Ando02 ; Ando04 ; Tuan04 ; Schw03 ; Kitt05b we plot the MCD defined as:
| (6) |
where and are the optical absorption coefficients in and polarizations. Assuming a weak absorption and neglecting multiple reflections, the MCD can be expressed as
| (7) |
where is the thickness of the sample, and and the intensities of transmitted light in and polarizations. The MCD depends on the photon energy and it is usually very strong near a resonant line or band split by Zeeman effect. In simple cases, the Zeeman splitting can be estimated Ando01 from the expression MCD , where is the derivative of the absorption coefficient in zero field. However, to use properly this equation, the line shape should remain constant: this is not the case in Zn1-xCoxO, where the line shape changes significantly, and where the and excitonic transitions are close together. Additionally, they split in opposite directions, as clearly observed on the reflectivity spectra of Fig. 5. These changes of the lineshape are the reason, why we did not attempt to determine the absolute value of the Zeeman splitting from these MCD measurements. In each sample, we only analyzed the temperature, spectral and magnetic field dependence of the MCD signal.
We observe three main MCD features over a large spectral range, from 1.7 eV to 4 eV (Fig. 8).
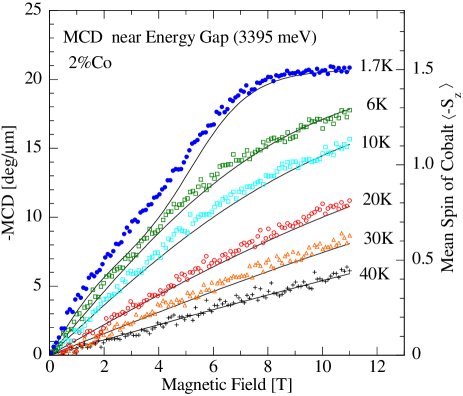
The first one is related to the energy gap (3.4 eV). In samples up to a Co content of 11%, it is seen as a sharp negative component, which broadens as the Co content increases. It is accompanied by a broader positive component from 2.9 to 3.2 meV, which was attributedTuan04 ; Kitt05b ; Schw03 to a charge transfer transition, or level to band transition. It is this peak which was used to study the onset of ferromagnetism upon annealing.Kitt05b ; Schw03
The third one corresponds to the internal transitions of cobalt, and it is observed between 1.8 eV and 2.3 eV in samples with a Co concentration over 0.4%. Its intensity systematically increases with the Co concentration. This MCD signal is quite complex and mainly results from the different intra-ionic absorption lines analyzed in section III.
The temperature and magnetic field dependence of the MCD signal near the energy gap was found to be proportional to that of the magnetic moment of isolated Co ions [Eq. (2)], even in a sample with a cobalt content of 4.5% [Fig. 9]. For higher concentrations, the resonant signal becomes too weak to be detected with reasonable accuracy by our experimental setup.
V Analysis
The magneto-optical effects observed near the energy gap and described in sections IV.B and IV.C are now interpreted as a consequence of the interaction between Co ions and band carriers. We first quantify the ion-exciton coupling (subsection A); then (subsection B) we discuss the effect of the electron-hole exchange in the exciton; finally (subsection C), we discuss briefly the magnetic properties of the present Zn1-xCoxO layers, as they appear from magneto-optical spectroscopy.
V.1 Excitonic Giant Zeeman splitting
without electron-hole exchange
In II-VI DMSs, the presence of the exchange interactions leads to large magneto-optical effects (giant Zeeman splitting and giant Faraday rotation). These effects have been studied in detail in several wurtzite II-VI DMSs like Cd1-xMnxSe,Agga83 ; Arci86 Cd1-xCoxSe,Nawr91 ; Hamd92 Cd1-xFexSe,Twar90 Zn1-xMnxSe,Yu95 and Cd1-xCrxS.Herb98
The effective Hamiltonian describing the giant Zeeman effect is
| (8) |
for the conduction band, and
| (9) |
for the valence band. In these expressions, is the number of cations per unit volume, the free magnetic ion content, the exchange constant for the conduction band, the exchange constant for the valence band, the mean spin of the free magnetic ions, in our case Co ions, and is the spin of the carrier. The mean value of the isolated Co spin has been already obtained as a function of temperature in section III [Eqs. (1), (2)], for a magnetic field applied parallel to the c-axis.
In order to calculate the effect of these effective Hamiltonians, we must take into account the structure of the valence band. We note and . Neglecting the contribution of the weak Zeeman effect of the host semiconductor, the energies of the different excitonic transitions under magnetic field are given by:Agga83 ; Arci86 ; Nawr91 ; Hamd92 ; Twar90 ; Yu95 ; Herb98
| (10) |
| (11a) | |||
| (11b) |
where is the zero field energy of the excitonic transition. We do not observe any feature related to the C exciton () in the configuration , as a consequence of the small spin-orbit coupling in ZnO [, see section IV.A]. Hence we can simplify Eq. (11) to . Such a simplification leads to opposite Zeeman splittings for the two optically active excitons : . This is what we observe experimentally. One consequence however is that the and exchange integrals cannot be determined from the experiment: only their difference can be obtained. Another consequence is that the contributions of the two active excitons to the MCD tend to cancel each other in samples where the linewidth is not small with respect to the splitting.
There is also a direct relationship between the sign of the giant Zeeman effect and the valence band ordering. From the sign of the giant Zeeman splitting we observe on and , a conventional valence band order (, , ) implies a positive sign of (as usually observed in II-VI DMSs). This ambiguity would disappear in more concentrated samples, where the excitonic Zeeman splitting will become comparable to the difference , if the lines remained sharp enough.
In our diluted samples , the magnitude of the exchange integral difference determined on the optically active excitons, , is about 0.4 eV [Fig. 6].
In samples where the two excitons are not resolved (such as in our samples with a few % Co), one can attempt to analyze the MCD phenomenologically, by deducing a Zeeman splitting from a comparison between the MCD spectra and the derivative of the zero-field absorption spectrum.Ando01 We obtain this way (not shown) a value of the coupling which is of similar magnitude, or slightly smaller. As noticed above, using the MCD from samples where the two active excitons are not properly resolved certainly leads to an underestimation of the coupling, since their contributions tend to cancel each other. In addition, we will see now that strong effects are expected from electron-hole exchange within the exciton, when the giant Zeeman splitting is of the same order as the splitting.
V.2 interaction in ZnO based DMS
with electron-hole exchange
We now include the effect of the electron-hole exchange. We will see that the effective exchange integrals difference , seen by the excitons can be much smaller than the difference of the exchange integrals valid for free carriers, . We follow the description given by B. Gil et al. when analyzing the effect of the biaxial stress in epitaxial layers,Gil01a ; Gil01b and we add the giant Zeeman effect and . The position of the three excitons , which can be optically active from symmetry considerations, is obtained by diagonalizing a matrix. This matrix mixes the two excitons active in polarization (one formed from the electron-hole states , which gives rise to exciton if , and ), and the exciton state . It reads (apart from an overall shift):Gil01a
| (12) |
where is a trigonal crystal field taking into account the effect of the trigonal strain,Gil01a is the electron-hole exchange energy. The giant Zeeman effect adds to that
| (13) |
The same matrix, with opposite giant Zeeman terms, applies in polarization.
The most important effect of the electron-hole exchange within the exciton, for the present study, is that it mixes the and states active in a given circular polarization.
If spin-orbit coupling () dominates over exchange (), then one observes the and excitons formed on one of the electron-hole states, , and (respectively for and if ). These are eigenstates of the c-axis spin projection operator, so that they are fully affected by the giant Zeeman effect : In that case, one would measure directly the spin-carrier coupling on the plot of Fig. 6. In the opposite case, the two exciton states are formed on the symmetric and antisymmetric combinations of the previous states, resulting in a spin triplet (dark exciton) and a spin singlet (bright exciton), respectively. Both have vanishing spin components along the c-axis, so to the first order they do not exhibit the giant Zeeman effect in the Faraday configuration. As visible in Fig. 6, this is not the case, but any intermediate configuration is possible.
Fig. 10(a) displays the position of the and excitons, from Fig. 5(b), as a function of the splitting of exciton . It is clear that we observe an anticrossing between the two excitons. It is reasonable to ascribe this anticrossing the the electron-hole interaction, and from the minimum distance, the value of is a few meV. However, the two excitons do not show the same curvature, which suggests that we cannot restrict ourself to the interaction between and only.
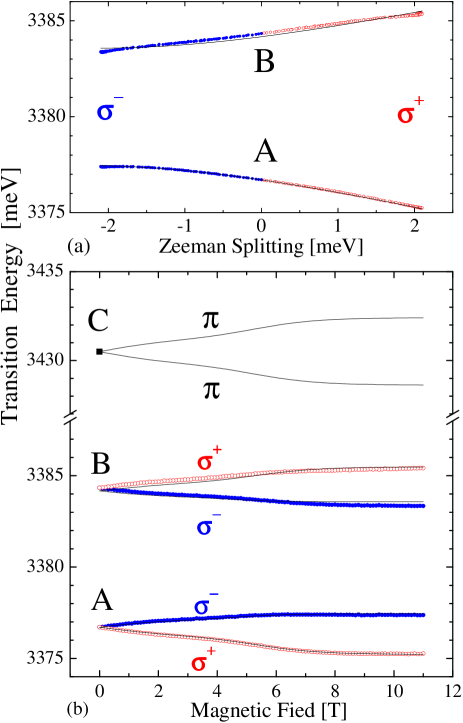
Fig. 10(b) compares the experimental position
(symbols) of excitons and , as a function of the applied
field, and of exciton , at zero field, to the calculated
eigenvalues of the Hamiltonian [Eqs (12) and
(13), solid lines]. The average spin projection of Co ions
is calculated using Eq (2). A good fit is obtained for
two sets of values of the parameters (which cannot be
distinguished at the scale of the figure):
Set 1: ,
, ,
, ,
or
Set 2: ,
, ,
,
.
The value of corresponds to a trigonal stress of
13 kbar, according to Ref. Gil01a, .
In both cases, we obtain a very good fit of the lowest exciton, and the fit for the second optically active exciton is reasonable, although not as good. The splittings of both excitons are almost opposite, as experimentally observed (note that if we take the parameters from Ref. Gil01b, , the splitting calculated for almost vanishes). We obtain no information about the valence band ordering (a similar conclusion was claimed by Lambrecht et al.Lamb02 in their analysis of the effect of strain). This is due to the fact that we mainly observe an anticrossing between the two excitons and , which is a symmetrical process. Hence, our fit is mainly sensitive to the relative value of and . We may simply notice that the hypothesis leads us to a much more isotropic spin-orbit coupling.
The value obtained for the spin-carrier coupling, 0.8 eV, has to be considered as a first estimate. A larger value of the electron-hole exchange reduces the sensitivity of the exciton to the spin splitting, implying a larger spin-carrier coupling. It should be particularly interesting to measure the excitonic splitting on samples with a higher Co content.
This value is smaller than in many other DMSs. For example, in Cd1-xCoxSe, another wurtzite Co-based DMS, the exchange integral difference is 2.1 eV.Nawr91 ; Hamd92 However, comparable or even smaller values of have been also reported in wurtzite DMSs, for example -0.26 eV in Cd1-xCrxS.Herb98 It is also in significant disagreement with theoretical predictions. Blinowski and co-workersBlin02 have calculated eV in the case of Zn1-xMnxO. They have also pointed out that the absolute value of is expected to be larger for Co than for Mn ions. Since is usually about eV and does not depend strongly on the host material,Liu61 one could expect eV in the case of Zn1-xCoxO. A large exchange integral, eV, has been proposed for Zn1-xCoxO nanocristallites,Schw03 but the details of the spectra supporting this conclusion were not given. If we assume a positive sign of (which is not the usual case but is not excluded by theory, e.g., in Cd1-xCrxS),Herb98 and eV, then we obtain about 1 eV. Such a small value puts severe restrictions to the possible influence of carriers on ferromagnetism, at least through Zener-like mechanisms.
V.3 Magnetism of Zn1-xCoxO
A measure of the excitonic Zeeman splitting and of the MCD signal near the energy gap is known to represent an efficient method to study the magnetic properties of DMSs. The dependence on the magnetization results from interactions, which are strong with substitutional magnetic ions. These magneto-optical properties are less affected by the presence of secondary phases or inclusions, which fully contribute to the magnetization as measured by SQUID. Hence the observation of a clear effect of the magnetization on the excitonic or band-to-band magneto-optical properties of the semiconductor is a good hint, that the observed magnetization is due to the DMS.
In the whole set of studied samples, both the Zeeman splitting and the near-bangap MCD signal agree with the idea of a paramagnetic system of isolated Co impurities (Maxwell-Boltzmann occupancy of the and spin states of Co2+ [see Eq. (2)].
This model is based on the observation of characteristic d-d transitions of the electronic configuration of Co, which confirms the values of the parameters describing the anisotropy and Zeeman effect in the ground state. The intensity of these lines increases linearly with the Co content, which suggests that all Co ions are incorporated in substitution of Zn. A Maxwell-Boltzmann distribution over the spin components in the ground state well accounts for the intensity of the transitions, and for the giant Zeeman effect of the optically active excitons. This demonstrates that Zn1-xCoxO is a DMS with a coupling between the bands of the semiconductor and the localized spins.
It also stresses some differences with respect to the most usual case of Mn-based II-VI DMSs. The magnetization of the single Co ion is not described by the isotropic Brillouin function used for cubic II-VI DMS such as Cd1-xMnxTe. The anisotropy causes a step in the field dependence of the magnetization at low temperature, and a deviation from the Curie law in the thermal dependence of the low-field susceptibility. On samples with a few % Co, we did not need to introduce an effective temperature in order to describe the influence of spin-spin interactions between neighboring spins (at least, beyond the nearest-neighbor spins). Any such phenomenological Curie-Weiss temperature has to be smaller than 0.5 K for concentration up to 5%.
On the other hand, the model assumes isolated Co ions, so that the eventual magnetic moments associated with Co pairs and complexes are significantly smaller than the moment associated with isolated Co ions. The negligible contribution of anti-ferromagnetically coupled nearest neighbor pairs at low temperature can be explained by short range superexchange interaction integrals higher than a few tens of Kelvin.
Contrary to the resonant peak close to the energy gap, the MCD signal related to internal Co transitions is not necessarily proportional to the Co magnetization. This signal is governed by the occupancy of the cobalt spin sublevels, and the Zeeman shifts and selection rules of the multiline absorption structure. Experimentally, its temperature dependence is also much weaker than the corresponding one for the energy gap resonant MCD peak.
In any case, we have not found any evidence of a ferromagnetic behavior. Upon increasing the Co content, the excitonic Zeeman splitting or the MCD continue to follow the paramagnetic behavior expected for isolated Co impurities - with perhaps the exception of a small additional contribution below 5 T at our lowest temperature, which tends to increase with the Co content (compare Figs. 7 and 9). No hysteretic behavior was detected. This contrasts with other observations on samples which have been grown by a different method, which exhibit ferromagnetic magnetization with an easy axis along the c-axis (an anisotropy which is opposite to the one we see for isolated, substitutional, cobalt),Rode03 or with samples which have been annealed.Schw03 However, it fully agrees with a study of the present (or similar) samples by magnetometry and electronic paramagnetic resonance.Pasc04
VI Conclusions
We observe absorption bands and lines due to Co2+ intra-ionic transitions. The intensity of is proportional to the total Co concentration. We observe reflectivity structures related to , and excitons. Their energies increase with Co concentration. We measured the exchange Zeeman splittings of and excitons, which increase with Co concentration and decrease with temperature. These exchange Zeeman splittings and the intensity of energy gap resonant MCD signal are described by using a model based on thermal occupation of and spin levels of purely paramagnetic Co2+ ions. A first estimation of spin-exciton exchange integrals was deduced, which results in a higher value of the spin-carrier integrals, of the order of 0.8 eV, when electron-hole exchange interaction is taken into account.
Acknowledgements.
We wish to acknowledge helpful discussions with A. Golnik, P. Sati, and A. Stepanov. We would like to thank also M. Laügt, J.-M. Chauveau and P. Vennégues for the structural characterization of the samples (x-ray and Transmission Electron Microscopy). This work was partially supported by Polish Committee for Scientific Research (grants 2P03B 002 25 and PBZ-KBN-044/P03/2001), program Polonium, Center of Excellence CEMOS (G5MA-CT-2002-04062) and Thematic Network SOXESS (G5RT-CT-2002-05075). *Appendix A Reflectivity due to excitonic polaritons
We present here the details of the polariton model used to fit reflectivity spectra. The model takes into account the strong coupling between excitons and photons in ZnO (the longitudinal transverse splitting, of several meV, is of the order of the excitonic linewidth). The dielectric function and reflectivity spectra near excitonic resonances are described in detail by Hopfield and ThomasHopf63 and by Lagois.Lago77 ; Lago81 Only and excitons were taken into account. The dispersion of the polariton branches associated with a propagation of the light parallel to the c-axis was calculated numerically by solving of the following equations (14) and (15):
| (14) |
| (15) |
where is the background dielectric constant of ZnO,Sega67 is the polarizability, are dumping parameters, are the energies of excitonic transitions, and is the effective mass of excitons.Humm73
We note , , the three solutions of (14) and (15). For each solution, we can determine the associated refractive index , the wave vector and the polarization of and excitons:
| (16) |
The reflection coefficient was derived from surface boundary conditions for electric field (17), magnetic field (18) and the total polarization of (19) and (20) excitons:
| (17) |
| (18) |
| (19) |
| (20) |
is the electric field amplitude of incoming light, is the corresponding one for reflected light, , and are the electric field amplitudes of the three polaritons propagating inside the sample. From (19) and (20), we get:
| (21) |
and
| (22) |
Next, we obtain an effective refractive index
| (23) |
With the derived expression for , we can calculate the reflection coefficient of the layer , which takes into account the presence of the polariton branches. However, it is commonly assumed that the formation of excitons is not possible within a few nanometers close to the surface. A dead (exciton-free) layer with a thickness (about two times the excitonic Bohr radius), and a background refractive index are usually added to the model. The reflectivity of the bilayer structure leads to an effective refractive index given by :
| (24) |
Finally, the reflectivity spectra are given by :
| (25) |
In our samples, the reflectivity spectra are slightly modified by additional non-resonant absorption. We obtained a better fit of the experimental spectra by adding an imaginary part to the background dielectric constant in Eq (14). Examples of the fits of the reflectivity spectra of ZnO and Zn1-xCoxO epilayers are shown in Fig. 5.
References
- (1) K. Sato and H. Katayama-Yoshida, Jpn. J. Appl. Phys., Part 2, 39, L555 (2000); Physica E 10, 251 (2001); Phys. Status Solidi B 229, 673 (2002).
- (2) T. Dietl, H. Ohno, and F. Matsukura, Phys. Rev. B 63, 195205 (2001).
- (3) J. Blinowski, P. Kacman, and T. Dietl, Mat. Res. Soc. Symp. Proc. Vol. 690; cond-mat/0201012 (2002).
- (4) N. A. Spaldin, Phys. Rev. B 69, 125201 (2004).
- (5) K. Ueda, H. Tabata, and T. Kawai, Appl. Phys. Lett. 79, 988 (2001).
- (6) S.-W. Lim, D.-K. Hwang, and J.-M. Myoung, Solid State Commun. 125, 231 (2003).
- (7) K. Rode et al., J. Appl. Phys. 93, 7676 (2003).
- (8) S. Ramachandran, A. Tiwari, and J. Narayan, Appl. Phys. Lett. 84, 5255 (2004).
- (9) M. Venkatesan et al., Phys. Rev. Lett. 93, 177206 (2004).
- (10) K. R. Kittilstved, N. S. Norberg, and D. R. Gamelin, Phys. Rev. Lett. 94, 147209 (2005).
- (11) A. C. Tuan et al., Phys. Rev. B 70, 054424 (2004).
- (12) K. Ando, J. Appl. Phys. 89, 7284 (2001).
- (13) K. Ando et al., Appl. Phys. Lett. 78, 2700 (2001).
- (14) K. Ando, 7th Symposium PASPS 2001; cond-mat/0208010 (2002).
- (15) K. Ando et al., J. Phys. Cond. Matter. 16, S5541 (2004).
- (16) D. A. Shwartz et al., J. Am. Chem. Soc. 125, 13205 (2003).
- (17) K. R. Kittilstved et al., cond-mat/0507121 (2005).
- (18) P. Koidl, Phys. Rev. B 15, 2493 (1977).
- (19) R. Pappalardo, D. L. Wood, and R. C. Linares, Jr, J. Chem. Phys. 35, 2041 (1961).
- (20) R. S. Anderson, Phys. Rev. 164, 398 (1967).
- (21) H.-J. Schulz and M. Thiede, Phys. Rev. B, 35, 18 (1987).
- (22) R. M. Macfarlane, Phys. Rev. B 1, 989 (1970).
- (23) E. Chikoidze et al., J. Appl. Phys. 97, 10D316 (2005).
- (24) J. A. Gaj et al., Phys. Rev. B 50, 5512 (1994).
- (25) N. Jedrecy et al., Phys. Rev. B 69, 041308 (2004).
- (26) D. Ferrand et al., J. Superconductivity, 18, 15 (2005).
- (27) D. W. Langer et al., Phys. Rev. B 2, 4005 (1970).
- (28) D. C. Reynolds et al., Phys. Rev. B 60, 2340 (1999).
- (29) B. Gil et al., Jpn. J. Appl. Phys. 40, L 1089 (2001).
- (30) B. Gil, Phys. Rev. B 64, 201310 (2001).
- (31) W. R. L. Lambrecht et al., Phys. Rev. B 65, 075207 (2002).
- (32) D. G. Thomas, J. Phys. Chem., 15, 86 (1960).
- (33) Th. Gruber et al., J. Appl. Phys. 96, 289 (2004).
- (34) J. J. Hopfield and D. G. Thomas, Phys. Rev. 132, 563 (1963).
- (35) J. Lagois, Phys. Rev. B 16, 1699 (1977).
- (36) J. Lagois, Phys. Rev. B 23, 5511 (1981).
- (37) G. Blattner et al., Phys. Rev. B 25, 7413 (1982).
- (38) R. L. Aggarwal et al., Phys. Rev. B 28, 6907 (1983).
- (39) M. Arciszewska and M. Nawrocki, J. Phys. Chem. Solids 47, 309 (1986).
- (40) M. Nawrocki et al., Solid State Commun. 77, 111 (1991).
- (41) F. Hamdani et al., Phys. Rev. B 45, 13298 (1992).
- (42) A. Twardowski et al., Phys. Rev. B 42, 7567 (1990).
- (43) W. Y. Yu et al., Phys. Rev. B 51, 9722 (1995).
- (44) M. Herbich et al., Phys. Rev. B 58, 1912 (1998).
- (45) S. H. Liu, Phys. Rev. 121, 451 (1961).
- (46) P. Sati et al., 12th International Conference on II-VI Compounds, Warsaw 2005.
- (47) B. Segall, Phys. Rev. 163, 769 (1967).
- (48) K. Hümmer, Phys. Status Solidi 56, 249 (1973).