Coupling symmetry of quantum dot states
Abstract
With non-invasive methods, we investigate ground and excited states of a lateral quantum dot. Charge detection via a quantum point contact is used to map the dot dynamics in a regime where the current through the dot is too low for transport measurements. In this way we investigate and compare the tunneling rates from the dot to source and drain. We find a symmetry line on which the tunneling rates to both leads are equal. In this situation ground states as well as excited states influence the mean charge of the dot. A detailed study in this regime reveals that the coupling symmetry depends on the number of states contributing to transport and on the spatial distribution of individual states.
pacs:
73.63.Kv, 73.23.Hk, 73.21.LaTransport measurements on 2D, 1D and 0D Kouwenhoven et al. (1997) systems have provided important insights into semiconductor-based nanophysics during past decades. In recent years non-invasive probing methods have complemented the researchers’ utilities. These methods are based on charge detection via capacitive coupling between adjacent nanostructures. A reliable way to probe quantum dots (QDs) is to use 1D quantum point contacts (QPCs) as charge detectors. This was successfully demonstrated on lateral single and double dots fabricated using electron beam lithography Field et al. (1993); Elzerman et al. (2003) or local anodic oxidation with atomic force microscopes Nemutudi et al. (2004); Schleser et al. (2004); Fricke et al. (2004). In pulsed measurements QPCs can also be used for spin readout Elzerman et al. (2004) or to probe excited dot states Elzerman et al. (2004); Johnson et al. (2005).
In this Letter we demonstrate that one can probe excited dot states in dc measurements. We study the tunneling rates and for electrons traversing the dot via source and drain leads. Indeed, these rates can be measured individually when only one barrier is used while the other one is kept far open without a QD. But these results cannot be transferred one-to-one to a regime with a QD as the wavefunction overlap is changed when defining the dot. Thus this method gives only a rough estimate. Instead we use the QPC to investigate the rates in a very sensitive way keeping the dot in the Coulomb blockade regime. Configurations can be detected where both rates are equal. The positions of these configurations in the parameter space roughly follow a line. Detailed analysis reveals that the coupling symmetry depends on individual QD states and on the number of channels used for transport. With these insights, asymmetry can be introduced systematically, which is useful for the investigation of effects that arise from the interplay of dot and leads (e.g., Kondo effect, Fano effect, spin blocking mechanisms or conductances of ground and excited states). Asymmetric barriers can, for example, lead to negative differential conductance Cavaliere et al. (2004).
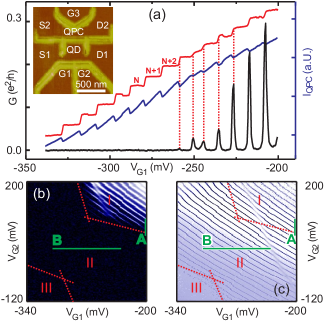
Our QD device is based on a GaAs/AlGaAs heterostructure with a two-dimensional electron system (2DES) 34 nm below the surface. The sheet density is m-2, the mobility is mVs. We use an atomic force microscope (AFM) to write oxide lines on the sample surface by local anodic oxidation (LAO) Keyser et al. (2000). These oxide lines deplete the 2DES below and thus create an electronic potential in the plane of the 2DES forming the coupled QD/QPC system Fricke et al. (2004). They are visible as bright lines in the AFM image of our device [inset of Fig. 1(a)]. QD and QPC are coupled individually to source and drain leads ( and for the QD, and for the QPC). Two side gates and control the tunneling rates of the dot, a third gate controls the transparency of the QPC.
Our device is characterized in a 3He/4He dilution refrigerator at a base temperature of 40 mK. We measure the differential conductance through the QD and additionally the dc current through the QPC. Due to its close vicinity to the QD, the QPC is capacitively coupled to the charge on the dot. Thus it is extremely sensitive to changes of the dot charge. In Fig. 1(a) and are plotted as a function of the voltage applied to gate . shows Coulomb peaks typical for single quantum dots in an opaque regime. Each peak corresponds to a charging event of the dot. Thus two adjacent minima reflect a charge difference of one electron. Correlated with , the QPC current shows a sawtooth-like behavior. Each electron entering the dot changes the potential of the QPC, thus reducing the current. The charge on the dot is extracted by measuring the difference in gate voltage between the measured QPC current and the smooth curve of an ideal QPC which is influenced only by the gate voltages but not by charging events on the dot. The charge reveals a steplike behavior [see upper curve in Fig. 1(a)] charge-profile (12).
With decreasing gate voltage, the Coulomb peaks vanish due to reduced tunneling rates. But still the dot is able to adjust its charge and the QPC measurement shows the typical steps. The accessible parameter space is extended. This is also visible in the charge diagram in Figs. 1(b) and (c). Figure 1(b) shows as a function of gate voltages and . Figure 1(c) shows the derivative of the corresponding QPC current. The measurement can be divided into three regions depending on the transparency of the dot barriers. Region I corresponds to the configuration where both barriers are sufficiently permeable for transport measurements. This transport region is bounded to the left and to the bottom marked with two dotted lines. Here the barriers lose their ability to give a measurable differential conductance (currents pA). But still they allow for charging events visible in the QPC measurement in region II. This charging region is again bounded towards lower voltages marked by two lines parallel to those lines limiting region I. These new lines correspond to the configuration, where the barriers decouple the dot from the leads so that charging becomes impossible. Thus in region III no signal is observed, neither in QD nor in QPC transport.
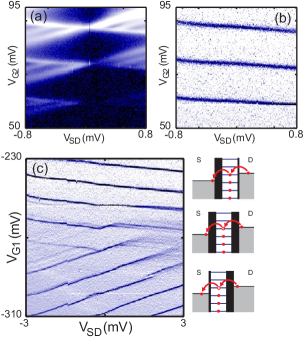
In addition to the extension of the parameter space, we will show that the QPC can also be used to investigate the symmetry of the tunneling rates and . For this purpose we performed nonlinear measurements. Figures 2(a) and (b) show a measurement along line A in Figs. 1(b) and (c). and the derivative of are plotted as a function of and [Figs. 2(a) and 2(b), respectively]. The differential conductance shows the typical Coulomb diamonds including excited dot states. Lines with positive slope correspond to dot transitions due to resonances of QD states with source (with chemical potential ) while lines with negative slope correspond to resonances with drain (). Although shows full diamonds, the QPC measurement reveals only the lines with negative slope. The lines with positive slope as well as lines corresponding to transitions involving excited states are not visible. Thus the charge on the dot is not altered by these transitions. Only when a ground state (with a chemical potential ) comes in resonance with drain () a charging event is detected.
We find the same configuration in the upper part of Fig. 2(c) which is taken along line B in Figs. 1(b) and (c). Again, only lines with negative slopes are visible. But in contrast to Fig. 2(b) the configuration changes in the lower part of Fig. 2(c). Here only lines with positive slopes are visible. Thus here resonances of ground states with source are detected (). Only in the middle of the figure both slopes are detected. Ground state transitions are visible as well as transitions with excited states.
This is explained taking into account the ratio of the barriers’ tunneling rates. Two basic asymmetric configurations can be distinguished [see sketches in Fig. 2(c)]. Either the barrier on the source side is more opaque () or the one on the drain side (). If the dot charge is governed by the drain’s chemical potential . On average an -electron ground state with is empty even when the chemical potential of the source enables electrons to tunnel on this state. The electrons leave the dot through the drain much faster than new electrons enter the dot from the source. On the other hand, if the state is filled on average even if the source potential enables electrons to leave the dot through the source. Those electrons are immediately replaced with new electrons injected from the drain. Thus the dot charge is altered only when which gives a line with negative slope in the QPC measurement. Excited states do not affect the dot’s charge. Either they are empty because their chemical potentials are above or their occupation does not change the total charge because the dot was already filled with electrons due to the occupied -electron ground state. If the drain is more opaque () the situation is the opposite. Now only lines with a positive slope are visible.
While Fig. 2(b) shows only the configuration with , the transition between both configurations is visible in Fig. 2(c). In the upper part of the figure, the lines with a negative slope reflect the configuration . The lower part features . In between, we find the transition where lines for both slopes appear. In this configuration the tunneling rates of both barriers are equal (). Transitions are detected for ground states as well as excited states at resonance with source and with drain.
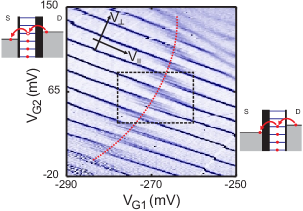
These measurements demonstrate that one can find symmetric configurations by sweeping . This is still possible when a perpendicular magnetic field is applied. A charge diagram similar to Fig. 1 (c) for T is shown in Fig. 3. The QPC current is recorded as a function of and . The detection of symmetric configurations is now realized with set to 1 mV. When , resonances with source appear at higher gate voltages than with and resonances with drain at lower voltages. This is visible in Fig. 3. The lines on the left appear at higher voltages (higher , see Fig. 3) than those on the right. In the middle, both lines are visible with additional lines in between. These additional lines correspond to excited states revealing a symmetric configuration while the lines on the left and right are those for ground state transitions due to resonance with source or drain. Overall this measurement reveals a complete line of symmetric barriers (marked as dotted line) that connects region I with region III introduced in the context of Fig. 1. On the left we have and on the right .
Now we will investigate the symmetric configuration in more detail. For this purpose we take a closer look at the region marked with a dashed rectangle in Fig. 3. The charge of the dot for this region is shown in a 3D plot in Fig. 4(a). A few large steps that are equal in height are clearly visible. They correspond to the addition of electrons to the dot leading to electron numbers , , and so on. Furthermore, each step features several smaller steps that continuously lead from a smaller electron number to a larger one. Three of them at the transition to are marked with white lines. These features correspond to the occupation of ground and excited states visible due to the transition .
The charge along the marked lines and along the features at the next large step is plotted in Fig. 4(b) as a function of which is the voltage parallel to the Coulomb blockade peaks in a rotated coordinate system (see Fig. 3). The exact position of symmetric coupling () is given for half-integer electron numbers at the intersections with the dashed lines in Fig. 4 (b). From additional nonlinear measurements we know that all features between constant electron numbers appear due to resonances with drain. Therefore the lowest lines [squares] corresponding to the occupation of a ground state reflect the coupling characteristics of only this state, because no other state is used as a transport channel. Thus the configuration of equal tunneling rates is identical with the ground state placed symmetrically between both leads. The other lines [circles and triangles] reflect resonances of excited states which contribute to the transport only together with the ground state. Thus only the coupling characteristics of the total system can be detected, but not the symmetry of each individual state. This is confirmed by the observation that the symmetric configuration shifts to lower voltages with the inclusion of excited states as transport channels. If more than one channel is in the transport window electrons have several ways to enter the dot but still only one way to exit. Thus the mean occupation increases even if the barriers remain unchanged. Consequently, the symmetric configuration shifts to lower voltages. This effect is visible at all large steps.
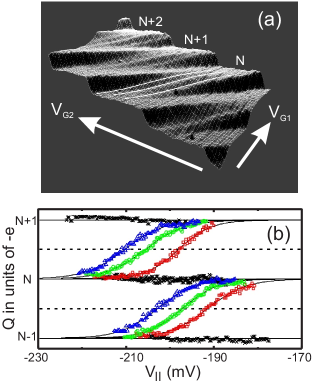
However there are differences between the transitions and . The positions of the lines for excited states are not exactly the same. The line for the first excited state at appears closer to the line for the corresponding ground state than at . This is not due to a larger energy difference between ground and excited state. The difference in which corresponds to the energy difference is even bigger for (as can be seen in Fig. 3). The difference in is rather influenced by the spatial distribution of ground and excited states. Thus for the excited state seems to be shifted to the source lead compared to . Thus the coupling symmetry is influenced not only by the barriers which are controlled by the gate voltages. It is also affected by the number of states contributing to transport and their spacial distribution.
In summary, we performed transport measurements on a coupled
system containing a QD and a QPC. We used the QPC to detect
charging events on the dot. In this way the accessible parameter
space was extended. We used the charge detection to investigate
the ratio of the tunneling rates to source and drain leads of the
dot in dc measurements. We found a line of symmetry where both
tunneling rates are equal. Along this line ground as well as
excited states were detected. Their behavior concerning symmetric
tunneling rates was studied in detail. The influence of the
spatial distribution of ground and excited dot states was
investigated and a dependence on the number of transport channels
was found.
This work has been supported by BMBF. We thank R. Winkler for
critically reading the manuscript.
References
- Kouwenhoven et al. (1997) L. P. Kouwenhoven, C. M. Marcus, P. L. McEuen, S. Tarucha, R. M. Westerveld, and N. S. Wingreen, in Mesoscopic Electron Transport, edited by L. L. Sohn, L. P. Kouwenhoven, and G. Schön (Kluwer, Dordrecht, 1997), vol. 345 of Series E, pp. 105–214.
- Field et al. (1993) M. Field, C. G. Smith, M. Pepper, D. A. Ritchie, J. E. F. Frost, G. A. C. Jones, and D. G. Hasko, Phys. Rev. Lett. 70, 1311 (1993).
- Elzerman et al. (2003) J. M. Elzerman, R. Hanson, J. S. Greidenus, L. H. Willems van Beveren, S. De Franceschi, L. M. K. Vandersypen, S. Tarucha, and L. P. Kouwenhoven, Phys. Rev. B 67, 161308(R) (2003).
- Nemutudi et al. (2004) R. Nemutudi, M. Kataoka, C. J. B. Ford, N. J. Appleyard, M. Pepper, D. A. Ritchie, and G. A. C. Jones, J. Appl. Phys. 95, 2557 (2004).
- Schleser et al. (2004) R. Schleser, E. Ruh, T. Ihn, K. Ensslin, D. C. Driscoll, and A. C. Gossard, Appl. Phys. Lett. 85, 2005 (2004).
- Fricke et al. (2004) C. Fricke, M. C. Rogge, B. Harke, M. Reinwald, W. Wegscheider, F. Hohls, and R. J. Haug, cond-mat/0504777 (2005).
- Elzerman et al. (2004) J. M. Elzerman, R. Hanson, L. H. Willems van Beveren, B. Witkamp, L. M. K. Vandersypen, and L. P. Kouwenhoven, Nature 430, 431 (2004).
- Elzerman et al. (2004) J. M. Elzerman, R. Hanson, L. H. Willems van Beveren, L. M. K. Vandersypen, and L. P. Kouwenhoven, Appl. Phys. Lett. 84, 4617 (2004).
- Johnson et al. (2005) A. C. Johnson, C. M. Marcus, M. P. Hanson, and A. C. Gossard, Phys. Rev. B 71, 115333 (2005).
- Cavaliere et al. (2004) F. Cavaliere, A. Braggio, J. T. Stockburger, M. Sassetti, and B. Kramer, Phys. Rev. Lett. 93, 036803 (2004).
- Keyser et al. (2000) U. F. Keyser, H. W. Schumacher, U. Zeitler, R. J. Haug, and K. Eberl, Appl. Phys. Lett. 76, 457 (2000).
- (12) With increasing differential conductance the QPC signal gets smoother. In addition, we observe a broadening and overlapping of two Coulomb peaks at mV leading to a smooth charging profile. This is ascribed to a local impurity in one barrier developing a single molecule-like state also visible in Figs. 1(b) and (c).