Time scale for the onset of Fickian diffusion in supercooled liquids
Abstract
We propose a quantitative measure of a time scale on which Fickian diffusion sets in for supercooled liquids and use Brownian Dynamics computer simulations to determine the temperature dependence of this onset time in a Lennard-Jones binary mixture. The time for the onset of Fickian diffusion ranges between 6.5 and 31 times the relaxation time (the relaxation time is the characteristic relaxation time of the incoherent intermediate scattering function). The onset time increases faster with decreasing temperature than the relaxation time. Mean squared displacement at the onset time increases with decreasing temperature.
pacs:
64.70.Pf, 61.20.Lc, 61.43.FsUnderstanding the origin of the extreme slowing down of liquids’ dynamics upon approaching the glass transition and the nature of the transition itself has been of great interest for several decades. A lot of recent activity has been stimulated by the recognition that close to the transition the liquids’ dynamics become not only very sluggish but also increasingly heterogeneous reviews . While the presence of dynamic heterogeneities is commonly accepted, the details of their spatial and temporal structure have been only partially established. In particular, the question of the lifetime of dynamic heterogeneities is quite controversial: whereas two separate experiments Ediger12 ; vandenBout found that near the glass transition the lifetime is significantly longer than the relaxation time, other experimental studies NMR ; solvation ; diel found the lifetime to be comparable to the relaxation time. In principle, the controversy can be resolved by postulating that the temperature dependence of the lifetime is stronger than that of the relaxation time EdigerAR . However, the physical interpretation of the new time scale remains unclear. On the computational side, there have been a few attempts to estimate the lifetime of dynamic heterogeneities. Most of them Perera ; DoliwaJNCS ; FS ; YGC found the lifetime to be comparable to the relaxation time. To the best of our knowledge, the only exception is a recent preprint Berthierlife in which it is shown that, in a kinetically constrained spin model resembling a fragile glass former, the lifetime is a few times longer than the relaxation time. More importantly, Ref. Berthierlife found that the lifetime increases with decreasing temperature somewhat faster than the relaxation time. It should be noted that one earlier study YO also found that at a low temperature the lifetime of dynamic heterogeneities is a few times longer than the relaxation time. However, a careful study of the temperature dependence of these two times have not been performed. Thus, the question of the existence of a time scale longer and increasing faster than the relaxation time remains unresolved.
The goal of our study is to investigate the temperature dependence of a different characteristic time that is related to the lifetime of dynamic heterogeneities: the time for the onset of Fickian diffusion.
In order to define the onset time we use, as an indicator of Fickian diffusion, the probability distribution of the logarithm of single-particle displacement, , during time , Puertas ; Reichman ; Cates ; FS2 . This distribution is defined in such a way that the integral is the fraction of particles whose value of is between and . The probability distribution can be obtained from the self part of the van Hove correlation function HansenMcDonald , . The probability distribution is a convenient indicator of Fickian diffusion because if particles move via Fickian diffusion then the self part of the van Hove function is Gaussian and the shape of the probability distribution is independent of time. In particular, the height of the peak of this distribution is equal to and deviations from this value indicate non-Fickian particle motion. We define the time for the onset of Fickian diffusion, , as the time at which the peak of is equal to 90% of its value for a Gaussian distribution of displacements, . We will discuss the threshold value of together with a different indicator of Fickian diffusion at the end of this Letter.
It should be noted that a deviation of the probability distribution from its universal shape expected for Fickian diffusion indicates dynamic heterogeneity. However, in principle, the inverse is not necessarily true. Thus, the time for the onset of Fickian diffusion is probably only a lower bound for the lifetime of dynamic heterogeneities.
To investigate the onset time we use the trajectories generated by an extensive Brownian Dynamics simulation study of a 80:20 Lennard-Jones binary mixture introduced by Kob and Andersen KobAndersen . Briefly, the potential is given by , where , and , , , , , and (all the results are presented in reduced units where and are the units of length and energy, respectively). A total of particles were simulated with a fixed cubic box length of 9.4. The details of this study have been presented elsewhere SzamelFlenner ; FS2 . In the present investigation we use only some of the temperatures simulated before: , 0.9, 0.8, 0.6, 0.55, 0.5, 0.47, and 0.45. The previous runs at the temperature have been extended by 60%; the A particles’ mean squared displacement at the end of the extended runs is about 16. We present the results for the A particles only. The results for the B particles are qualitatively the same, although the statistics is worse due to the smaller number of B particles. The temperature dependence is presented by plotting various quantities vs. where is the crossover temperature KobAndersen ; FS2 . This is a convenient way to expand the temperature scale and it should not imply an endorsement of any particular theoretical approach.
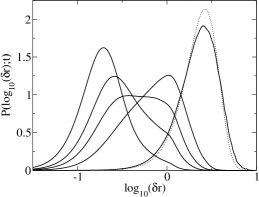
We start by showing in Fig. 1 the probability distributions at for the A particles at several times characteristic for the relaxation of the system. The first one is the time at which the non-Gaussian parameter reaches the maximum value, . The second one is the relaxation time, , which is defined in the usual way: is the time at which the incoherent intermediate scattering function for a wave vector near the peak of the static structure factor is equal to of its initial time value, . The third time is the time at which a new non-Gaussian parameter FS2 reaches the maximum value, . We argued in Ref. FS2 that deviations of from its Fickian shape are most evident for times comparable to . The fourth time is the time at which the incoherent intermediate scattering function for a wave vector near the peak of the static structure factor is equal to 10% of its initial time value, . The final time is the onset time, , i.e. the time at which the peak of is equal to the 90% of its value for a Gaussian distribution of displacements. For a comparison we also show a resulting from a Gaussian distribution of displacements. It is clear from Fig. 1 that at shorter times, i.e. at , , and the probability distributions deviate strongly from the shape resulting from a Gaussian distribution of displacements. While there are still noticeable differences even at , we believe that these are small enough to consider the onset time for Fickian diffusion.
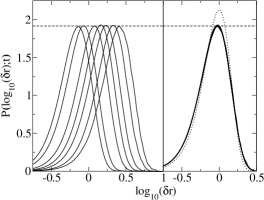
In Fig. 2 we show for the A particles for , 0.8, 0.6, 0.55, 0.50, 0.47, and 0.45. It should be noted that with decreasing temperature the probability distributions at shift toward larger displacements. In other words, mean squared displacement at the onset of Fickian diffusion increases with decreasing temperature. The right panel indicates that the shape of is temperature-independent and, therefore, the late-time liquids’ dynamics are, up to rescaling of the time and distance scales, similar.
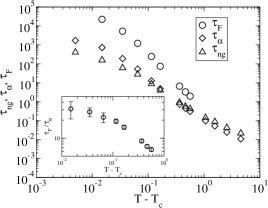
Fig. 3 presents our main result: comparison of the temperature dependence of of the onset time for Fickian diffusion, , with that of other characteristic times. We find that, in the temperature range considered in this Letter, the onset time is between 6.5 and 31 . More importantly, the ratio of the onset time and the relaxation time grows with decreasing temperature. Interestingly, the temperature dependence of this ratio becomes somewhat weaker with decreasing temperature: it appears stronger in the range than in the lower temperature range .
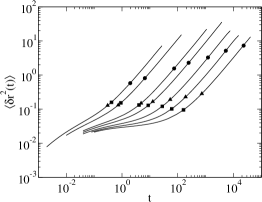
In Fig. 4 we place the results shown in Figs. 2 and 3 in the context of the time dependence of the mean squared displacement. On the time scale of the mean squared displacement has not yet reached the linear dependence on time and thus the diffusion is obviously non-Fickian. Moreover, on the time scale of the mean squared displacement is, at most, at the borderline of the linear time dependence. On the other hand, the onset time, , occurs well within the regime of apparent linear time dependence of the mean squared displacement. Note that there is an important practical message from Fig. 4: if one monitors only the time-dependent mean square displacement, one can significantly underestimate the length of the run necessary to achieve Fickian diffusion.
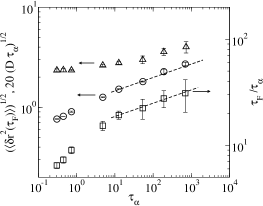
Having identified the Fickian crossover time, , we can define a characteristic length scale, the root mean squared displacement at the onset time, . It follows from Figs. 2 and 4 that this length increases with decreasing temperature. Our characteristic length should be related to the so-called Fickian crossover length introduced by Berthier et al. BCG The latter length was defined through the wavevector dependence of the relaxation time of a supercooled liquid. Roughly speaking, is the length scale on which diffusion is Fickian on all time scales. The prediction of Ref. BCG was that this length scale changes with temperature as the square root of the product of the self-diffusion coefficient and the relaxation time, KSKumar . In Fig. 5 we compare temperature dependence of to that of of (note that we plot these length scales vs. the relaxation time; this is in the spirit of Refs. BCG ; otherC in which it is argued that the glass transition is a manifestation of a zero-temperature critical point). The root mean squared displacement at the onset time grows with increasing and at the lowest temperatures there is an apparent scaling relationship, . In contrast, is initially temperature-independent. This is due to the fact that the Stokes-Einstein relation is violated only for (i.e. for ) FS3 . However, at longer relaxation times (i.e. at lower temperatures) has a temperature dependence similar to that of . Finally, we show in Fig. 5 that at longer relaxation times (i.e. at lower temperatures) the ratio appears to grow with increasing relaxation time as . It is not clear whether the scaling relations indicated in Fig. 5 have any deeper significance. It could be even argued that if they continue for another 7 or 8 orders of magnitude of (i.e. up to comparable to that at the laboratory glass transition temperature), the resulting would be greater than the longest experimentally observed heterogeneity lifetime.
To summarize, we proposed a quantitative definition of the onset time for Fickian diffusion and investigated its temperature dependence in a Lennard-Jones binary mixture. We found that the onset time is considerably longer than the relaxation time and, more importantly, it increases faster with decreasing temperature than the relaxation time. Our definition of the onset time relies upon one particular indicator of Fickian diffusion, the probability distribution of the logarithm of single-particle displacement, , and upon adopting a particular numerical criterion for the onset of Fickian diffusion, peak height equal to the 90% of its Fickian value. This procedure seems reasonable in that it results in non-Fickian motion being present only at temperatures at and below . This temperature has been identified before as so-called onset temperature for slow dynamics onset . To test the robustness of our main result we also tried using a different indicator of Fickian diffusion: the new non-Gaussian parameter that we introduced recently FS2 . In this approach we defined the onset time for Fickian diffusion to be the time at which the new non-Gaussian parameter is equal to . This particular numerical value results in non-Fickian motion being present only at temperatures at and below commentSE . The resulting onset times are somewhat shorter than the ones presented in this Letter. However, the temperature dependence of the onset time defined using the new non-Gaussian parameter is similar to that of the onset time defined using . More interestingly, we found that the shapes of at the onset times defined using the new non-Gaussian parameter are very similar and, in particular, the height of the peak is approximately temperature independent and equal to 85% of its value for Fickian diffusion.
Finally, we would like to point out that the results presented here violate the time-temperature superposition principle: in order to superimpose the probability distributions shown in the left panel of Fig. 2 we have to shift by . The more usual shift procedure, agreeing with the time-temperature superposition, would involve the relaxation time rather than the onset time which has temperature dependence different from .
G.S. thanks Mark Ediger for many discussions on dynamic heterogeneity experiments that stimulated this work. We gratefully acknowledge the support of NSF Grant No. CHE 0111152.
References
- (1) Experimental studies of dynamic heterogeneities have been reviewed in Refs. EdigerAR ; RichertJPCM . For a very recent review of simulational investigations see Ref. AndersenPNAS .
- (2) M.D. Ediger, Annu. Rev. Phys. Chem. 51, 99 (2000).
- (3) R. Richert, J. Phys. Condens. Matter 14, R703 (2002).
- (4) H.C. Andersen, PNAS 102, 6686 (2005).
- (5) M.T. Cicerone and M.D. Ediger, J. Chem. Phys. 103, 5684 (1995); C.-Y. Wang and M.D. Ediger, J. Phys. Chem. B 103 4177 (1999).
- (6) L.A. Deschenes and D.A. Vanden Bout, Science 292, 255 (2001).
- (7) R. Böhmer et al., Europhys. Lett. 36, 55 (1996); R. Böhmer, G. Diezemann, G. Hinze, and H. Sillescu, J. Chem. Phys. 108, 890 (1998).
- (8) M. Yang and R. Richert, J. Chem. Phys. 115, 2676 (2001).
- (9) B. Schiener, R. Böhmer, A. Loidl, and R.V. Chamberlin, Science 274, 752 (1996).
- (10) D.N. Perera, P. Harrowell, J. Chem. Phys. 111, 5441 (1999).
- (11) B. Doliwa, A. Heuer, J. Non-Cryst. Solids 307-310, 32 (2002)
- (12) E. Flenner and G. Szamel, Phys. Rev. E 70, 052501 (2004).
- (13) Y. Jung, J.P. Garrahan, and D. Chandler, cond-mat/0504535.
- (14) S. Léonard and L. Berthier, cond-mat/0506629.
- (15) R. Yamamoto and A. Onuki, Phys. Rev. Lett. 81, 4915 (1998).
- (16) A.M. Puertas, M. Fuchs and M.E. Cates, J. Chem. Phys. 121 (6), 2813 (2004).
- (17) M.E. Cates et al., J. Phys. Condens. Matter 16, S4861 (2004).
- (18) D.R. Reichman, E. Rabani and P.L. Geissler, J. Phys. Chem. B 109, 14654 (2005).
- (19) E. Flenner and G. Szamel, Phys. Rev. E 72, 011205 (2005).
- (20) J.P. Hansen and J.R. McDonald, Theory of Simple Liquids, 2nd ed. (Academic, London, 1986).
- (21) W. Kob and H.C. Andersen, Phys. Rev. Lett. 73, 1376 (1994); Phys. Rev. E 51, 4626 (1995); Phys. Rev. E 52, 4134 (1995).
- (22) G. Szamel and E. Flenner, Europhys. Lett. 67, 779 (2004).
- (23) L. Berthier, D. Chandler, and J.P. Garrahan, Europhys. Lett. 69, 320 (2005).
- (24) A similar result for a “diffusive dynamic correlation length” was obtained by K.S. Schweizer and E.J. Saltzman, J. Phys. Chem. B 108, 19729 (2004). Also, B.M. Erwin, R.H. Colby, S.Y. Kamath, and S.K. Kumar (cond-mat/0409778), on the basis of dimensional analysis, proposed the same formula for a different length scale, so-called cooperative length scale.
- (25) J.P. Garrahan and D. Chandler, Phys. Rev. Lett. 89, 035704 (2002); S. Whitelam, L. Berthier, and J.P. Garrahan, Phys. Rev. Lett. 92, 185705 (2004).
- (26) E. Flenner and G. Szamel, cond-mat/0508102.
- (27) Y. Brumer and D.R. Reichman, Phys. Rev. E 69, 041202 (2004).
- (28) Note that according to both definitions the appearance of the non-Fickian motion correlates with violation of the Stokes-Einstein relation.