Resonant tunneling through a C60 molecular junction in liquid environment
Abstract
We present electronic transport measurements through thiolated C60 molecules in liquid environment. The molecules were placed within a mechanically controllable break junction using a single anchoring group per molecule. When varying the electrode separation of the C60-modified junctions, we observed a peak in the conductance traces. The shape of the curves is strongly influenced by the environment of the junction as shown by measurements in two distinct solvents. In the framework of a simple resonant tunneling model, we can extract the electronic tunneling rates governing the transport properties of the junctions.
1 Introduction
How can we experimentally determine the relevant energy levels and the tunneling rates involved in electronic transport through single molecule devices? Such questions are of fundamental interest for the development of molecular electronics. The conductance of single molecules has been investigated in several experiments where phenomena such as Coulomb blockade and Kondo effect [3, 4], negative differential resistance [5] and logic gates [6] were pointed out. Different techniques were used to address single or a few molecules. Fixed contact arrangements such as nanopore systems [7] and nanogaps fabricated by shadow evaporation or electromigration [8] have been realized. Alternatively, scanning tunneling microscope (STM) [9, 10] and break junction techniques [7, 11, 12] offer tunable contacts to characterize molecules. Break junctions offer an additional stability when compared to the STM, but the implementation of a third electrode remains delicate although recent work shows it can be done [13]. Adding a chemically controllable environment in break junctions experiments would provide an additional control of the anchoring of the molecule to the metallic constriction and allow in situ electrochemistry experiments. The excellent efficiency of a liquid gate bas been demonstrated previously on carbon nanotube field-effect transistors [14], and recently this effect has been studied for organic molecules using a STM [15, 16].
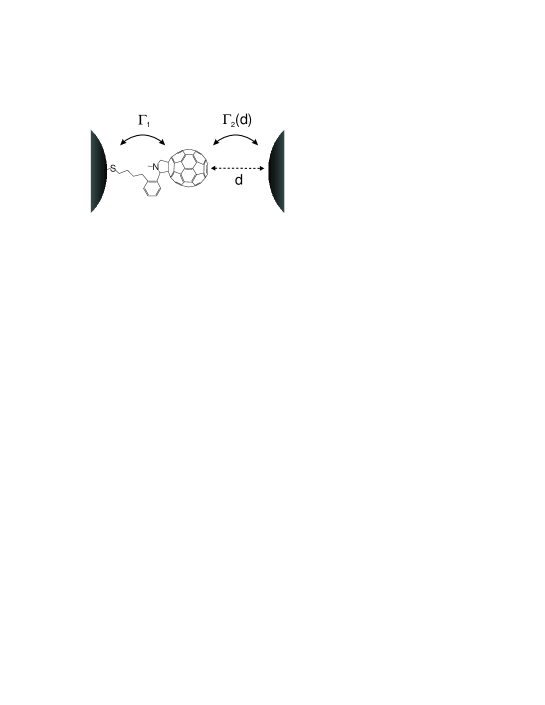
Buckminsterfullerenes and in particular C60 and its derivatives have attracted much attention [17] and, due to their particular electronic properties, represent ideal model systems for molecular electronics [18, 19, 20]. In this Letter, we present electronic transport measurements through thiolated C60 derivatives in a two probe configuration provided by the tips of a break junction (Fig. 1). The single functional group serves as an anchor and, in the case where a single molecule junction is realized, permits to control the coupling of the C60 to a Au electrode by mechanically adjusting the inter-electrode spacing . By performing the transport measurements in two distinct solvents, dimethyl sulfoxide (DMSO) and toluene, we could observe the strong influence of the environment on the molecular junctions.
2 Experimental section
The synthesis of the fullerene derivative was carried out following well-established protocols [21]. A thiolated C4 linker ensured that the C60 molecule would bind to the gold electrodes. To contact the molecules and perform transport measurements, we used a mechanically controllable break junction setup [22]. A gold nanobridge was lithographically patterned on a phosphor bronze substrate. By bending the substrate via a vertically moving rod, the gold bridge is elongated and finally breaks. The two resulting ends serve as electrodes for contacting the molecules. The setup includes a cell that allows working in different liquid environments and has been described previously [23].
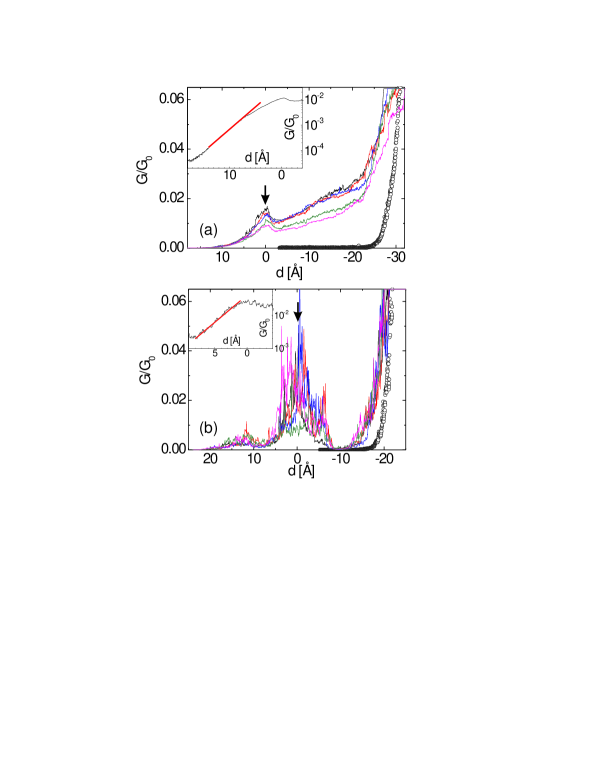
We first characterized the gold junctions via measurements of the conductance versus distance in air and in the solvents used subsequently for the C60 molecules, toluene and dimethyl sulfoxide (DMSO). Several sets of consecutive open-close cycles were recorded, with ranging typically between and a few , where is the conductance quantum. To investigate the transport through C60 molecules, a mM C60 solution was added to the liquid cell while the junction was kept close. The junction was then opened widely ( nm) to favor the self-assembly of the molecules. We also added molecules while keeping the junction open but no significant differences in the transport measurements were observed. Sets of curves were recorded at time intervals of min. During these cycles, the junction was never fully closed, keeping its conductance below in order to limit mechanical rearrangements of the Au tips. -values obtained while closing the junction are shown in Fig. 2 for DMSO (a) and toluene (b) at a bias voltage of V.
The open symbol curves show measurements in the pure solvent. The solid curves are five successive raw measurements performed after adding the C60 solution to the junction. We also attempted to measure current-voltage () characteristics. However, these curves were not reproducible, displaying rather large uncontrolled hysteresis, which we assign to the dynamics of the liquid environment and the relatively weak tethering of the C60 with one single linker group only.
While the measurements of in the pure solvents show a clean exponential behavior [23], the curves for the C60 modified junctions exhibit a more complex structure. In previous break-junction work with molecules, the occurrence of a plateau in has been taken as the signature for the ‘locking-in’ of a molecule [12]. We observe a plateau in about of the measured closing cycles. In addition to this observation, a pronounced peak can appear (arrows in Fig. 2). Though, the peak appears less frequently in different samples, reproducible measurements (visible in each closing curve within a cycle of curves at least) could be acquired for both C60 in DMSO and toluene. In DMSO, the peak corresponds to a conductance maximum of and is followed by a plateau-like feature. When further closing the junction the conductance rises more rapidly, although less sharply than in the pure solvent. The shape of the conductance curves in toluene (Fig. 2b) is very different, showing more noise and a fully developed peak. After a small pre-peak (not present in all curves), the conductance rises to a maximum value of at the peak and decays again to a very low conductance. While further closing the junction the conductance increases sharply, with a slope similar to that of the conductance in the pure solvent. The environment in which the junction is studied plays clearly an important role here. We note in particular that DMSO is a rather poor solvent for neutral fullerenes whereas toluene is a good one (see e.g. [24]).
To calibrate each junction, we measured the tunneling conductance between the two Au electrodes in the pure solvent. Let us denote the gap distance between the two Au electrodes by . It can be expressed as , where denotes the vertical displacement of the pushing rod and the reduction factor which depends on the geometry of the junction [22]. It is the reduction factor which needs to be calibrated for each junction. The tunneling conductance measured in a pure solvent was fitted according to the expression with , where (and ) represents the height of a square tunneling barrier of width and is the electron mass. The fits were adjusted by tuning in order to obtain values for in agreement with our previous work [23] in which the apparent workfunctions in different solvents were calibrated with respect to measurements in vacuum. The reference inverse decay lengths , valid for the pure solvents, are Å-1 and Å-1. This procedure provides the reduction factor for each junction measured. [25].
3 Discussion
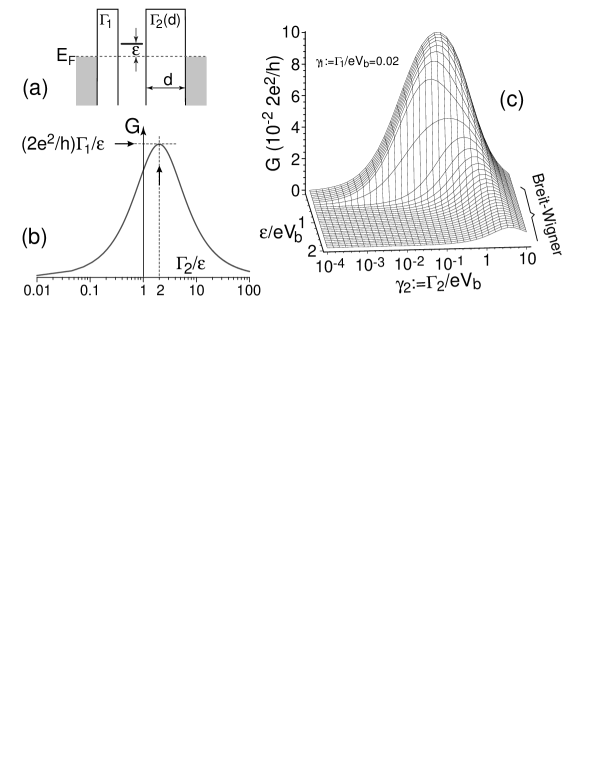
The particularity of our system lies in the single anchor group used to tether the molecule within the break junction. This configuration makes it possible to tune the coupling of the molecule to the electrode: while one tunneling rate () is fixed, the second () varies exponentially with the gap between the electrode (electrode to the right in Fig. 1) and the C60 molecule. The metal–molecule–metal junction forms a double-barrier junction. In this picture, the observed conductance peaks can be explained within a coherent resonant tunneling model, provided that one of the energy levels of the molecule lies not too far away from the Fermi level of the electrodes (Fig. 3a).
Resonant tunneling through a single level results in a peak in the linear conductance when the level aligns with the Fermi level of the leads, i.e. at . The occurrence of a peak in is a well known fact [26]. However, a peak can also arise in , even if . Resonant tunneling is described by the Breit-Wigner equation:
| (1) |
In our geometry, is fixed and defined by the molecular tether holding the molecule to the left electrode (Fig. 1). depends exponentially on the distance between the C60 molecule and the right electrode with being the inverse decay length, i.e. . in Eq. (1) as a function of has a maximum at . For we would have and consequently a peak conductance of . In the experiment, the peak conductance is however much smaller than , so that . It follows then that and . A respective plot in this limit () is shown in Fig. 3b. Note, that we define , but the sign of is not determined, i.e. a sign change in does not affect the discussion.
Using the Breit-Wigner equation we can obtain the ratio from the measured peak height without fitting. The measurements yield in DMSO and in toluene, more than twice the DMSO value. Because we expect to be the same for both solvents (after all it is the same linker), this suggests that the level is lying closer to the Fermi level of the electrodes in toluene as compared to DMSO.
That we can measure directly the ratio is a very nice fact. But we would like to obtain both and . This is at first sight not possible, because Eq. (1) is scale-invariant. Changing , , and by the same factor leaves the curve invariant. To our rescue, we emphasize that we did not measure the linear-response conductance, but at a bias of eV, much larger than at room temperature. The finite bias introduces an energy scale which allows a considerable narrowing down of the range of possible values.
Integrating Eq. (1) over the bias window, given by the applied voltage , yields:
| (2) |
All parameters are now scaled to , i.e. , , and . There are two regimes: a) and b) , the latter corresponds to the Breit-Wigner equation. In both cases a peak develops in , but there is a pronounced crossover, which sets in sharply at . This crossover is shown in Fig. 3c for a selected value of . In the following, we will try to fit our measurements to Eq. (2) in both the low and large limit. There are four fitting parameters: , , , and . Note, that we always use the ansatz and that we define the zero of the distance axis to match with the peak position in the measurement. This is possible, as we have no means to determine the ‘true’ zero, i.e. the point of contact of the right electrode with the C60 molecule.
In the first step, we obtain by focussing on large where the junction is widely open and the conductance well below the conductance at the peak. In this simple tunneling regime, . From fits to the averaged conductance curves of the C60-modified junctions (Fig. 2 insets), we extract the inverse decay lengths Å-1 and Å-1. We emphasize that the value obtained for DMSO is more reliable than the one for toluene, since the fit could be performed over a more extended range of conductance. This is due to the presence of a lower conductance peak in toluene (see Fig. 2b). The inverse decay lengths are slightly suppressed as compared to the values measured in the solvent alone [23].
We next compare our data to conductance curves calculated in the limit . We fix the values to the ones determined for large and try to obtain a good match with the experiment by tuning both and . The dashed lines in Fig. 4 show curves for meV and meV, and meV, meV. In both cases, the adjusted curves present a substantially broader peak than the data, showing that the limit is inappropriate.
We now relax the condition and try to find the smallest possible for which a good match between the calculated and measured curve is obtained, again using the values determined for a large . We obtain eV, meV, eV, and eV, meV, meV. Care has to be taken at this point, because eV is very close to the transition region between the Breit-Wigner and the case where the theoretical curves are quite sensitive to the temperature. When taking the finite temperature into account, slightly increases, so that eV is a good approximation for both DMSO and toluene.
If we allow for larger values of we cross over to the Breit-Wigner equation. In this scale-invariant limit, we obtain convincing fits for both DMSO and toluene with the parameters (DMSO) and (toluene), and as required (solid lines in Fig. 4). Hence, at this stage we can say with confidence that eV for both DMSO and toluene.
As emphasized before, the Breit-Wigner formula cannot provide an upper bound for . However, we can – on a physical ground – provide an upper bound on and therefore also on . The latter is obtained through the relation . The peak in appears at relatively large values, but cannot grow to too high values, because otherwise higher molecular states of the C60 molecule will strongly hybridize with the states in the Au electrode and the model will break down. Moreover, a large at short distances corresponds to a large binding force of order between the molecule and the Au electrode. In fact, we think that the crossover from the peak to the plateau in DMSO is determined by this consideration. Furthermore, the fully developed peak in toluene suggests that at the position of the peak () is smaller in toluene than in DMSO.
In order to fix the upper bound of we need to discuss the typical energy scales of the orbitals in C60 [27]. In the inset of Fig. 4 we show the energy levels of C60 and C (adapted from Green et al. [28]). The HOMO-LUMO gap of C60 determined in solution is around eV [29] whereas local density approximation calculations provide a value of eV for the free C60 molecule (see e.g. [17] and refs. therein). Experiments on C60 monolayers assembled on metallic surfaces showed values ranging from eV to eV [30, 31, 32, 33].
Due to its high electronegativity, a C60 molecule in contact with a metal tends to gain charge from the metal. The ionization potential of Au is eV and the electron affinity of C60 equals eV. The latter includes the Coulomb energy of the singly charged C60 amounting to eV. If we assume that the Coulomb energy is strongly screened in the gap between the Au electrodes, CC is favorable. Photoemission studies of C60 on a Au surface yield values for the electron charge on C60 of [34] and [35]. Hence, it is very likely that C60 is singly charged also in our work. On acquiring an electron the threefold degenerate LUMO state of C60 splits by a very small amount of meV (not shown and also not resolvable in our experiment) and the chemical potential is expected to align closely with this orbital (dashed line). In fact, may lie above () or below (), depending on the exact charge state.
Taking the HOMO-LUMO gap of the C60 and the C60 anion as the proper energy scales, eV to avoid hybridization with higher lying orbitals. If we impose that this condition occurs in DMSO at the transition from the peak to the observed plateau at Å (see arrow in Fig. 4), we obtain eV. Together with the previous consideration, is determined quite accurately to eV. Similarly, if we pretend to describe the full peak in toluene up to Å (arrow), we obtain eV. These rather small values for are inconsistent with the previous consideration. In order to obtain an upper bound for of at least eV, one would have to set the cut-off to as large a value as eV. This disagreement shows that the full decay of in toluene to approximately zero conductance beyond the peak must have another origin. This will be addressed in the following.
We have assumed here that we are allowed the use the resonant tunneling model with an unperturbed level beyond the peak. However, a full understanding of the small regime would require the understanding of local rearrangement effects taking place when the electrodes and the molecules are reaching mechanical contact. In the case of toluene we observe that the conductance drops to a negligibly small value after the peak and then shows a pronounced increase, similarly to the behavior of the junction in the pure solvent (Fig. 2b). We can presume that, upon closing of the junction to small values of , the molecules are pushed away from the inter-electrode space, resulting in conductance properties dominated by Au-Au tunneling. The shoulder observed in the case of DMSO (Fig. 2a) lets envision a different scenario in which the molecules remain within the junction and therefore continue to substantially affect the conductance of the junction at very short inter-electrode separations. Additionally, large conductance fluctuations can be observed in toluene (see Fig. 2b) while the curves are much smoother in DMSO. We attribute these differences to the solubility of the fullerene derivative in the solvent considered. Whereas toluene is a good solvent, the fullerenes tend to aggregate with time when suspended in DMSO. In our view, the large conductance fluctuations observed in toluene reflect the tendency of the fullerene molecules to be re-solved if the cavity is getting to narrow. In contrast, the molecules rather stay within the junction if DMSO is used due to the lower solvation energy.
Whether a single molecule picture really holds in such a system is an important question. The very good match between theory and experiment supports the single molecule approach. The analysis provides more than a qualitative agreement with the data and allows the extraction of narrowed range estimates for the LUMO position and the tunneling rate of the molecular bridge between the Au electrode and the C60 molecule. The results are: eV, and .
The above discussion is based on a non-interacting model, where the interaction energy has been absorbed in the level energy . When the coupling to the molecule changes, the average charge on the molecule is modified, thereby changing the interaction contribution to . However, we have numerically checked (within a self-consistent mean field theory [36]) that this effect does not appreciably change the shape of the conductance versus distance curves, but only slightly scales the parameters , and .
The presence of a much lower peak in some raw conductance curves in toluene (about Å prior to the main peak, Fig. 2b) might be a signature for a weaker tunneling process involving C60 molecules on both electrodes. If running experiments confirm this feature, an interpretation in terms of a triple-barrier system could further support this approach.
4 Conclusions
We have performed transport measurements through C60 molecules tethered by a single anchor group in Au break junctions operated in a liquid environment. The signature of the presence of the molecules within the junction appeared as a peak in conductance versus distance curves. The shape of this peak was strongly influenced by the solvent in which the junction was operated, thereby showing the importance of a proper environmental control in nanoscale junctions.
The data can be understood in a resonant tunneling picture through a single level located close to the Fermi energy . The particular geometry of the experiment combined with the environmental control allowed us to provide numbers for the electronic tunneling rates between a gold electrode and a fullerene derivative. By systematically varying the linker group, our approach will allow to better understand the electronic coupling between molecules and electrodes in molecular devices. Moreover, gating will allow the resonant level to be moved even closer to the Fermi level. An increase of the conductance up to the quantum conductance value can then be envisaged.
References
References
- [1]
- [2]
- [3] J. Park, A. N. Pasupathy, J. I. Goldsmith, C. Chang, Y. Yaish, J. R. Petta, M. Rinkoski, J. P. Sethna, H. D. Abruna, P. L. McEuen, D. C. Ralph, Nature 417, 722 (2002).
- [4] W. Liang, M. P. Shores, M. Bockrath, J. R. Long, H. Park, Nature 417, 725 (2002).
- [5] J. Chen, M. A. Reed, A. M. Rawlett, and J. M. Tour, Science 286, 1550 (1999).
- [6] C. P. Collier, E. W. Wong, M. Belohradský, F. M. Raymo, J. F. Stoddart, P. J. Kuekes, R. S. Williams, and J. R. Heath, Science 285, 391 (1999).
- [7] M. A. Reed, C. Zhou, C. J. Muller, T. P. Burgin, and J. M. Tour, Science 278, 252 (1997).
- [8] H. Park, A. K. L. Lim, A. P. Alivisatos, J. Park, and P. L. McEuen, Appl. Phys. Lett. 75, 301 (1999).
- [9] X. D. Cui, A. Primak, X. Zarate, J. Tomfohr, O. F. Sankey, A. L. Moore, T. A. Moore, D. Gust, G. Harris, and S. M. Lindsay, Science 294, 571 (2001).
- [10] J. K. Gimzewski and C. Joachim, Science 283, 1683 (1999).
- [11] C. Kergueris, J.-P. Bourgoin, S. Palacin, D. Esteve, C. Urbina, M. Magoga, and C. Joachim Phys. Rev. B 59, 12505 (1999).
- [12] J. Reichert, R. Ochs, D. Beckmann, H. B. Weber, M. Mayor, and H. v. Löhneysen, Phys. Rev. Lett. 88, 176804 (2002).
- [13] A. R. Champagne, A. N. Pasupathy, and D. C. Ralph, Nano Lett. 5, 305 (2005).
- [14] M. Krüger, M. R. Buitelaar, T. Nussbaumer, C. Schönenberger, and L. Forró, Appl. Phys. Lett. 78, 1291 (2001).
- [15] X. Y. Xiao, B. Q. Xu, and N. J. Tao, Nano Lett. 4, 267 (2004).
- [16] F. Jäckel, M. D. Watson, K. Müllen, and J. P. Rabe1 Phys. Rev. Lett. 92, 188303 (2004).
- [17] M. Dresselhaus, G. Dresselhaus, and P. C. Eklund Science of Fullerenes and Nanotubes (Academic Press, 1996).
- [18] C. Joachim and J. K. Gimzewski, Chem. Phys. Lett. 265, 353 (1997).
- [19] H. Park, J. Park, A. K. L. Lim, E. H. Anderson, A. P. Alivisatos, and P. L. McEuen, Nature 407, 57 (2000).
- [20] D. Porath, Y. Levi, M. Tarabiah, and O. Millo Phys. Rev. B 56, 9829 (1997).
- [21] X. Shi, W. B. Caldwell, K. Chen, and C. A. Mirkin, J. Am. Chem. Soc. 116, 11598 (1994).
- [22] J. M. van Ruitenbeek, A. Alvarez, I. Piñeyro, C. Grahmann, P. Joyez, M. H. Devoret, D. Esteve, and C. Urbina, Rev. Sci. Instrum. 67, 108 (1996).
- [23] L. Grüter, M. González, R. Huber, M. Calame, and C. Schönenberger, to appear in Small (2005).
- [24] Y. Marcus, A. L. Smith, M. V. Korobov, A. L. Mirakyan, N. V. Avramenko, E. B. Stukalin, J. Phys. Chem. B 105, 2499 (2001).
- [25] X. D. Cui, X. Zarate, J. Tomfohr, O. F. Sankey, A. Primak, A. L. Moore, T. A. Moore, D. Gust, G. Harris, and S. M. Lindsay, Nanotechnology 13, 5 (2002).
- [26] S. Datta, Electronic Transport in Mesoscopic Systems (Cambridge University Press, 1995).
- [27] We do not take into account the modifications in the orbitals induced by the anchor group attached to C60.
- [28] W. H. Jr. Green, S. M. Gorun, G. Fitzgerald, P. W. Fowler, A. Ceulemans, and B. C. Titeca, J. Phys. Chem. 100, 14892 (1996).
- [29] L. Echegoyen and L. E. Echegoyen, Acc. Chem. Res. 31, 593 (1998).
- [30] A. J. Maxwell, P. A. Brühwiler, A. Nilsson, N. Mårtensson, and P. Rudolf, Phys. Rev. B 49, 10717 (1994).
- [31] G. Gensterblum, J. J. Pireaux, P. A. Thiry, R. Caudano, J. P. Vigneron, Ph. Lambin, A. A. Lucas, and W. Krätschmer, Phys. Rev. Lett. 67, 2171 (1991).
- [32] H. Wang, C. Zeng, Q. Li, B. Wang, J. Yang, J. G. Hou, and Q. Zhu, Surface Science 442, L1024 (1999).
- [33] X. Lu, M. Grobis, K. H. Khoo, S. G. Louie, and M. F. Crommie, Phys. Rev. B 70, 115418 (2004).
- [34] C.-T. Tzeng, W.-S. Lo, J.-Y. Yuh, R.-Y. Chu, and K.-D. Tsuei, Phys. Rev. B 61, 2263 (2000).
- [35] B. W. Hoogenboom, R. Hesper, L. H. Tjeng, and G. A. Sawatzky, Phys. Rev. B 57, 11939 (1998).
- [36] F. Zahid, M. Paulsson, and S. Datta, in Advanced Semiconductors and Organic Nano-Techniques, H. Morkoc Ed., Academic Press (2003).
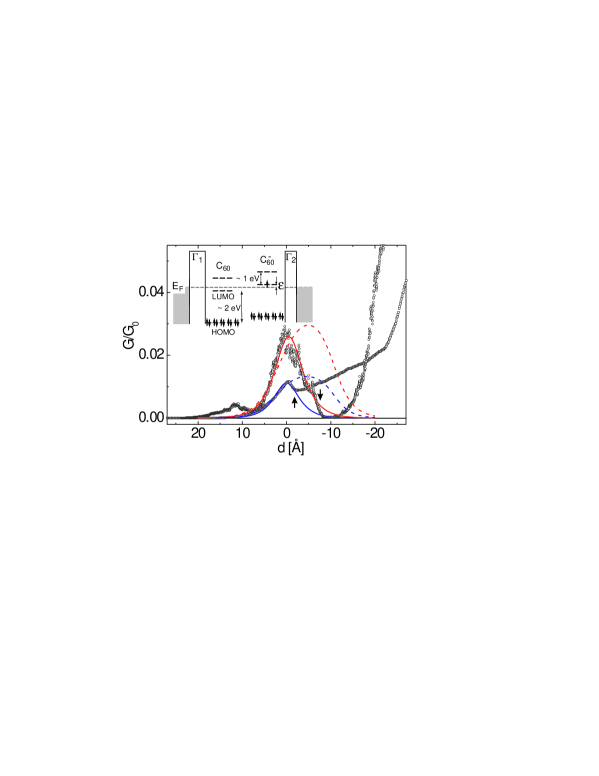
Inset: Schematic energy diagram of the metal-molecule-metal junction showing the energy level of C60 and C. Due to its large electronegativity, C60 tends to gain charge from a nearby metallic surface as illustrated by the position of its LUMO level, lying below the Fermi energy of the Au electrodes.