Self-similar Scale-free Networks and Disassortativity
Abstract
Self-similar networks with scale-free degree distribution have recently attracted much attention, since these apparently incompatible properties were reconciled in havlin by an appropriate box-counting method that enters the measurement of the fractal dimension. We study two genetic regulatory networks (Saccharomyces cerevisiae teichmann and Escherichai coli zheng ) and show their self-similar and scale-free features, in extension to the datasets studied by havlin . Moreover, by a number of numerical results we support the conjecture that self-similar scale-free networks are not assortative. From our simulations so far these networks seem to be disassortative instead. We also find that the qualitative feature of disassortativity is scale-invariant under renormalization, but it appears as an intrinsic feature of the renormalization prescription, as even assortative networks become disassortative after a sufficient number of renormalization steps.
pacs:
05.45.Df, 89.75.Hc, 87.16.YcI Introduction
Until very recently, the celebrated properties of a scale-free degree distribution seemed to be incompatible with self-similar features of networks, in which the number of boxes of linear size scales with according to a power-law , with an exponent that is given by the fractal dimension . Using the box-counting method, Song et al. showed that many scale-free (SF) networks observed in nature can have a fractal structure as well havlin . This result is striking, because the tiling and renormalization according to the linear size of the boxes, in which all pairs of nodes inside a box have mutual distance less than , appear to be physically relevant rather than being a formal procedure. Therefore, the essential quantity in the tiling is the linear size of the box, , defined by being the maximal distance between the nodes of the box. In the renormalization procedure the boxes are contracted to the nodes of the renormalized network whose edges are the interconnecting edges between the boxes on the original network.
In this paper we study the genetic regulatory network of two well-known organisms, Saccharomyces cerevisiae teichmann and Escherichia coli zheng . We first determine the degree-distribution , that is the probability for finding a node with degree , to read off the exponent according to Albert in order to check that the networks are scale-free. Next we measure for various box-sizes to obtain the fractal dimension from . After renormalizing the networks according to the procedure proposed in havlin , we measure the scaling behavior of the degree according to , where stands for the degree of a node in the renormalized network, is the largest degree inside the box that was contracted to one node with degree in the renormalization process, and is assumed to scale like with a new exponent . The invariance of under renormalization and the transformation behavior of the degree itself imply the relation havlin
| (1) |
between the exponents. Therefore we check this relation by measuring , and comparing the values of from Eq.1 with the measured from the degree distribution.
One of the important features of networks is their “degree” of assortativity. The notion of assortative mixing was known from epidemiology and ecology when it was introduced as a characteristic feature of generic networks by Newman newman . Assortativity refers to correlations between properties of adjacent nodes. One particular property is the (in- or out-)degree of a node as the number of its (in- or out-)going links, respectively. Degree-degree correlations can be recorded as histograms; in order to facilitate the comparison between networks of different size, they can be also characterized by the Pearson coefficient. The Pearson coefficient is obtained from the connected degree-degree correlation function after normalizing by its maximal value, which is achieved on a perfectly assortative network. Here, stands for the average of having vertex degrees and at the end of an arbitrary edge. The Pearson coefficient takes values between , it is positive for assortative networks ( for complete assortativity) and negative for disassortative ones. We have measured this coefficient for a number of self-similar scale-free networks and present the results below. The reason why this feature is of interest in the present context is its relation to the power-law or exponential behavior of . In particular, we are interested in the question whether disassortativity is scale-invariant on a qualitative level under renormalization according to the prescription proposed in havlin , and why these properties go along. Disassortative features in protein interaction networks were found and explained by Maslov and Sneppen maslov on the level of interacting proteins and genetic regulatory interactions. According to their results links between highly connected nodes are systematically suppressed, while those between highly-connected and low-connected pairs of proteins are favored. In this way there is little cross-talk between different functional modules of the cell and protection against intentional attacks, since the failure of one module is less likely to spread to another one. Also in immunological networks one speaks of lock- and key-interactions between molecular receptors and antigenic determinants copelli . In general, complementarity is essential for pattern recognition interactions, underlying biological and biochemical processes as well as for symbiotic species in ecological networks. Of course, it is not at all obvious or necessary that complementarity in “internal” (functional) properties should be manifest in topological features like the degree-degree correlations. Therefore we study the relation between self-similarity and degree-assortativity in this paper.
II Measurements and Results
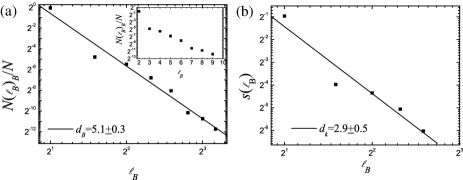
For the genetic regulatory networks Saccharomyces cerevisiae teichmann and Escherichia coli zheng we observe a power-law behavior of for with for S. cerevisiae and , respectively. The obtained degree-distributions are scale-free and satisfy a power-law with exponent for S. cerevisiae and for E.coli. The scaling relation (1) between the exponents and is also satisfied within the error bars for both networks.
In Table 1 we summarize the results also for some additional networks, for which we list their properties of self-similarity and disassortativity. If we confirm the property of self-similarity it means not only the scaling behavior of according to a power-law, but also the numerical verification of the scaling relation of Eq.1 and the invariance of under renormalizationhavlin . This is more conclusive, because it is sometimes difficult to disentangle exponential from power-law behavior of for networks with a small diameter (for example see Fig.1 for the regulatory network of S.cerevisiae with an inset that shows the same data points on a log-linear scale instead of the log-log scale), whereas the scaling relation only holds for a power-law of the decay, it is easier to prove or disprove. A confirmation of (dis)assortativity refers to histograms with (negative) positive slope of next-neighbor degree-degree correlations and/or a (negative) positive Pearson coefficient, respectively. In most cases we measured the degree-degree correlations also between nodes at distance as indicated in the figures.
The first four networks of Table 1
| Network | Self-similarity | Disassortativity |
| genetic reg.S.cerevisia teichmann | yes Fig.1 | yes Fig.4 a |
| genetic reg.E.coli zheng | yes Fig.3 | yes Fig.4 b |
| scient.collab. bara | no Fig.5 a | no Fig.5 b |
| internet aut.sys.bara | yes supply | yes supply |
| biochem.pathwayE.coli bara | yes havlin | yes supply |
| actor bara | yes havlin | (yes,)Fig.2 |
| www bara | yes havlin | yes supply |
refer to the genetic regulatory networks of S.cerevisia and E.coli, the scientific collaboration network, and the internet on the autonomous systems level. For these networks the properties of column 2 and 3 were examined by us, while for the last three networks (the biochemical pathway network of E.coli, the actor network and the world-wide-web), the self-similarity was established before havlin , and we studied their property of disassortativity in addition. In particular the actor network deserves some further comments. The actor-network is self-similar havlin , but its positive Pearson coefficient suggests that it is assortative, in contrast to all other self-similar networks we have studied so far. A closer look at its next neighbor-degree-degree correlation (Fig.2)

shows an assortative behavior for degrees up to the order of 1000, but slowly decays for larger degrees and becomes disassortative. The degree-degree correlation between nodes at distance larger than 1 is decreasing with degree for all .
Moreover, some comments are in order to the yeast-genetic regulatory network with 3456 nodes and 14117 edges, (cf. Fig.1). Since it has a diameter of 9, the largest value for the tiling is 10. Therefore we have only 8 data points available for the fit. Each point corresponds to an average over 100 tiling configurations. Different tiling configurations result from different starting seeds as well as the random selection of neighbors during the tiling process. The data point at in Fig.1 lies clearly outside the fluctuations about the average over different tiling configurations, thus outside the error bars, which are at least two orders of magnitude smaller than the respective value of , so that they are not visible on the scale of the figure. In Fig. 3, we find
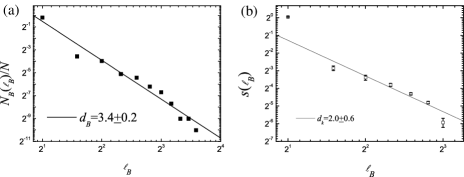
a similar behavior for E.coli. The deviation from the power-law behavior at goes along with an assortative degree-degree correlation between nodes at distance as it is seen from Fig.4a and Fig.4b, showing the degree-degree correlation of S.cerevisiae and E.coli, respectively, at distances . The data in Fig.4
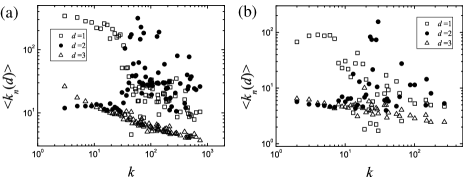
explicitly show the disassortative behavior at and for both S.cerevisiae and E.coli. However, for , we find that there is a certain value of , at which abruptly increases and slowly decreases for . Here for S.cerevisiae and for E.coli. These mixed properties of assortativity and disassortativity seem to go along with the deviation from the power-law behavior of . On a qualitative level, this is plausible if we focus on a hub that should be present in a scale-free network. In an assortative network (assortative say at distance , for example ), this hub is likely connected to another hub within the distance . If this hub is chosen as a seed of a box in a tiling with linear box size , we need much less boxes to cover the many nodes in the neighborhood of the hub than in a disassortative network.
In a network which is assortative not only for a certain range of , but for all and at distances , like the scientific collaboration network, actually decays faster than power-like for all , as it is seen from the exponential fit of Fig.5a.
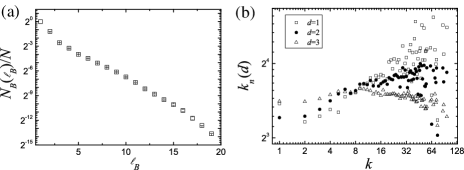
The scaling relation between the exponents and assumes the scale-invariance (under renormalization) of the degree distribution, that is the invariance of the exponent . Similarly, it is of interest how the disassortativity transforms under renormalization (as defined in havlin ). As we see from Fig.6,

even networks like the scientific collaboration network (Fig.5), which are originally assortative, transform to more and more disassortative ones under iterated renormalization. (The number of renormalization steps is determined by the size of the networks, in particular by its diameter. The final step is achieved when the reduced network consists of just one node.) Therefore the transformation behavior of disassortativity seems to be an effect of the renormalization procedure rather than an intrinsic self-similar property of the network. Similarly, we measured the transformation behavior of the clustering coefficient under renormalization of self-similar networks. As the data supply show, it is an invariant property of scale-free networks, while it changes under renormalization for non-self-similar ones like the Barabási-Albert one BA .
To summarize, we find numerical evidence that self-similar scale-free networks are preferably disassortative in their degree-degree correlations. For biological networks this result may reflect the complementarity in interactions that is observed on various levels.
Acknowledgements.
One of us (H.M.-O.) would like to thank S.Havlin for drawing her attention to self-similar networks at the COSIN-final meeting at Salou (Spain) March 2005.References
- (1) C.Song,S.Havlin and H.A.Makse, Nature 433, 392 (2005)
- (2) N.M.Luscombe, M.M.Babu, H.Yu, M.Snyder, S.Teichmann and M.Gerstein, Nature 431, 308 (2004)
- (3) http://www.ccg.unam.mx/Computational_Genomics /regulondb/DataSets/RegulonNetDataSets.html and http://www.gbf.de/SystemsBiology
- (4) R. Albert and A.-L. Barabási, Rev. Mod. Phys. 74, 47 (2002)
- (5) M.E.J.Newman, Phys.Rev.Lett.89, 208701 (2002); M.E.J.Newman and J.Park, Phys.Rev.E 68, 036122 (2003)
- (6) S.Maslov and K.Sneppen, Science 296, 910 (2002)
- (7) M.Copelli, R.M.Zorzenon dos Santos and J.S.Sa Martins, cond-mat/0110350 (2001)
- (8) www.nd.edu/networks
- (9) P.Uetz et al., Nature 403, 623 (2000)
- (10) The additional data are available on the web http://imperia.iu-bremen.de /ses/physics/ortmanns/36753/index.shtml
- (11) A.-L. Barabási and R. Albert, Science 286, 509 (1999)