Finite Temperature Behavior of Small Silicon and Tin Clusters: An Ab Initio Molecular Dynamics Study.
Abstract
The finite temperature behavior of small Silicon (Si10, Si15, and Si20) and Tin (Sn10 and Sn20) clusters is studied using isokinetic Born-Oppenheimer molecular dynamics. The lowest equilibrium structures of all the clusters are built upon a highly stable tricapped trigonal prism unit which is seen to play a crucial role in the finite temperature behavior of these clusters. Thermodynamics of small tin clusters (Sn10 and Sn20) is revisited in light of the recent experiments on tin clusters of sizes 18-21 [G. A. Breaux et. al. Phys. Rev. B 71 073410 (2005)]. We have calculated heat capacities using multiple histogram technique for Si10, Sn10 and Si15 clusters. Our calculated specific heat curves have a main peak around 2300 K and 2200 K for Si10 and Sn10 clusters respectively. However, various other melting indicators such as root mean square bond length fluctuations, mean square displacements show that diffusive motion of atoms within the cluster begins around 650 K. The finite temperature behavior of Si10 and Sn10 is dominated by isomerization and it is rather difficult to discern the temperature range for transition region. On the other hand, Si15 does show a liquid like behavior over a short temperature range followed by the fragmentation observed around 1800 K. Finite temperature behavior of Si20 and Sn20 show that these clusters do not melt but fragment around 1200 K and 650 K respectively.
pacs:
61.46.+w, 36.40.–c, 36.40.Cg, 36.40.EiI Introduction
The finite temperature behavior of small clusters is of great interest owing to the recent exciting calorimetric measurements carried out on clusters of sodium, tin, gallium and aluminum Hab-Na1 ; Jar-tin1 ; Ga-PRL ; Jar-jacs ; Jar-Al . Calorimetric experiments on tin and gallium clusters with 10-50 atoms reveal many interesting features. For example, contrary to the standard paradigm, it has been shown that clusters can have higher than bulk melting temperatures Jar-tin1 ; Ga-PRL . Further, addition of a single atom is seen to change the specific heat curve characteristics dramatically by changing a ‘magic melter’ into a so called ‘non-melter’ Jar-jacs . These experiments have motivated many researchers to simulate the finite temperature behavior of small clusters PRB-Lu ; Na-AMV ; Our-PRBsn10 ; Our-PRBsn20 ; Our-PRL ; Eur-Phys.J ; James-Tin ; Our-Na .
In the present work, we study the finite temperature behavior of small silicon and tin clusters. The silicon clusters are of potential relevance to nanoelectronics industry and hence remain subject of many experimental as well as theoretical studies PRL-spectroscopic-Muller ; Jar-Chem-Soc ; Photo ; Si-Disso ; Jar-Nat ; Si-JCP2 ; Si-laser ; TTP ; Si-PRL-Dynamics ; Jackson ; Si6 ; Si6-19 ; Jackson-2004 ; Si-36 ; Si-JCP ; Si-JCP1 ; Si-ACIE . Most of the theoretical studies are devoted to the investigation of lowest equilibrium geometries of small silicon clusters, motivated by the experimental findings that Si clusters undergo structural transition (prolate to spherical) in the range 22-34 PRL-spectroscopic-Muller ; Photo . To date, global minima of silicon clusters with sizes n24 have been well established from various recent unbiased searches such as genetic algorithm, single-parent evolution algorithm, ‘big bang’ optimization etc Jar-Nat ; Jackson ; Jackson-2004 .
The surface induced dissociation studies revealed that the fragmentation behavior is common within the clusters of semiconducting group 14 elements Tin-pathway ; Ge-pathway . Studies on silicon clusters of various sizes report existence of fragmentation pathway as compared to evaporation process Si-Disso ; Si-pathway and predict that clusters with sizes 6-10 are the most abundant fragments and are referred to as magic fragments Si-PRL-Dynamics ; Zhang-magic-jcp . Although, it is speculated that silicon clusters up to sizes will undergo fragmentation rather than evaporation Si-Disso , it is not yet clear if the clusters undergo the traditional solid-like to liquid-like transition before fragmenting or they fragment without melting as reported recently in case of tin clusters Jar-Tin-frag . Hence, we report detailed thermodynamic simulations on Sin clusters with various sizes; . These simulations have been carried out using Density Functional Theory (DFT) within the Generalized Gradient Approximation (GGA). The total simulation time for each cluster is at least 2 ns. Our detailed analysis of finite temperature behavior shows that the finite temperature behavior of Si10 is dominated with isomerization and it is rather difficult to identify the region corresponding to solid-like to liquid-like transition. However, the cluster clearly fragments around 2800 K. Si15, on the other hand, does exhibit a liquid like phase over a short temperature range before fragmenting around 1800 K. Si20 does not melt but fragments around 1200 K.
Both silicon and tin are group IV elements and it is interesting to note some peculiarities of this group. Carbon, the first element is a non-metal with a high energy gap between valence band and conduction band (around 5.5 eV) whereas silicon and germanium are semiconductors at room temperature. Tin and lead are metals at room temperature of which tin undergoes a structural phase transition and transforms into a semiconductor below 286 K. Contrary to the bulk, tin clusters (n25) resemble greatly to that of small silicon and germanium clusters PRB-Lu ; Jar-PRA-Tin-Prolate . Interestingly, Si, Ge and Sn clusters with sizes 9 are built on stable TTP unit which, as we shall see, plays a crucial role in finite temperature behavior of these clusters. However, in contrast to silicon clusters, tin clusters undergo a size rearrangement from prolate (stacked TTP units) to a more compact spherical shape in a considerably broad range (from 35-65 atom cluster). The ionic mobility experiments exploited the fact that small tin clusters have prolate ground states. Experiments on small tin clusters (10-30 atom clusters) indicated that these clusters do not melt at least 50 K above the bulk melting temperature. Jar-tin1 This conclusion is based on the argument that presence of a liquid phase is identified with the change in the shape from prolate to spherical and hence enhanced ionic mobilities in the liquid like region Jar-tin1 . Density functional simulations supported these findings showing that, indeed, melting temperatures of small tin clusters are at least 1000 K higher than that of Tm[bulk] PRB-Lu ; Our-PRBsn10 ; Our-PRBsn20 ; James-Tin . Our previous calculations, within LDA showed that Sn10 has substantially higher melting temperature, 2300 K whereas Sn20 is in a liquid-like phase after 1200K Our-PRBsn10 ; Our-PRBsn20 . However, the recent experiments on Sn, Sn, Sn and Sn demonstrated that these clusters do not melt, but sublimate Jar-Tin-frag around 650 K. In light of these findings, we simulate the thermodynamics of tin clusters, Sn10 and Sn20, using GGA functionals. In the present work, simulations are extended over much longer time scale, at least 90 ps per temperature as compared to our earlier simulations of 40 ps per temperature Our-PRBsn10 ; Our-PRBsn20 . Our studies confirm the fragmentation observed experimentally and bring out similarities between small tin and silicon clusters in terms of structure and dynamics.
II Computational Details
All the thermodynamic simulations are performed using Born–Oppenheimer molecular dynamics based on Kohn-Sham formulation of DFT KS . We have used Vanderbilt’s ultrasoft pseudopotentials uspp-vanderbilt within GGA, as implemented in vasp package vasp for all the clusters. Thermodynamic behavior of tin clusters is also studied using LDA as implemented in vasp. For all the calculations, we use only and –electrons as valence in case of Si. In case of Sn, we use and –electrons as valence, taking –electrons as a part of the ionic core. An energy cutoff of 13.84 Ry and 9.77 Ry is used for the plane–wave expansion of Si and Sn wave functions respectively, with a convergence in the total energy of the order of 10 eV. Cubic supercells of lengths , and are used for X10, X15 and X20, where , respectively.
The ground state and other equilibrium structures of all the clusters are found by optimizing several structures chosen periodically from a high temperature simulation. We analyze the bonding characteristics of the ground state and few excited state isomers of the clusters using Electron Localization Function (ELF) elf-silvi . This function is normalized between zero and unity; a value of 1 represents a perfect localization of the valence charge while the value for the uniform electron gas is . The locations of maxima of this function are called attractors, since other points in space can be connected to them by maximum gradient paths. The set of all such points in space that are attracted by a maximum is defined to be the basin of that attractor. Basin formations are usually observed as the value of the ELF is lowered from its maximum, at which there are as many basins as the number of atoms in the system. Typically, existence of an isosurface or a basin along the bonding region between two atoms at a high ELF value, say , signifies a localized bond in that region.
For examining the finite temperature behavior, ionic phase space of all the clusters is sampled by isokinetic MD where kinetic energy is held constant using velocity scaling. In case of X10 () clusters we split the total temperature range from 100-3000 K into 22 different temperatures. In case of Si15 and Si20 clusters we split the temperature range from 100-1800 K into 14 different temperatures. Each system is heated to desired temperature from previous temperature slowly within a time scale of 15 ps. Molecular dynamics is then simulated at each temperature for 30 ps after which it is subsequently heated to the next temperature. The MD for each temperature is then continued for an additional time scale of 90 ps so as to have sufficiently large statistics. In case of Sn20, the molecular dynamics simulations were carried out within the LDA as well as GGA approximations. In case of GGA, we have studied the finite temperature behavior of the cluster around 200 K, 350 K, 500 K and 650 K. In case of LDA calculations the temperature range is split so to have the finite temperature behavior of the cluster around 100 K, 250 K, 500 K, 650 K, 800 K and 1000 K.
Following the MD simulation, classical ionic density of states of system is extracted using multiple histogram technique and the details are found in literature MH . Various other thermodynamic indicators such as Mean Square Displacements (MSD) of atoms and Root-Mean Square bond-length fluctuations (RMS-BLF, ) are computed. More technical details concerning the extraction of thermodynamics averages, indicators and computation of specific heat curve can be found in our earlier paper amv-review .
III Results and Discussion
III.1 Thermodynamics of Silicon clusters
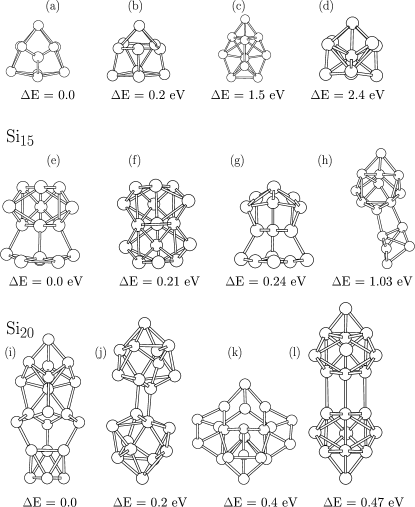
First, we discuss the finite temperature behavior of Si10. The ground state and various excited state geometries of Si10 are shown in Fig.1 – (a) to (d). The ground state of Si10 is a tetra capped trigonal prism (similar to that of Sn10 Our-PRBsn10 ) and is consistent with the one reported earlier Si10geo . It may be noted with some interest that the ground state and the first excited state structure (higher by 0.2 eV) contain one TTP unit whereas all other excited configurations do not contain a TTP unit. This explains the significant energy difference (of 1 eV) between the first two equilibrium structures and the remaining excited state structures. We also note that in the ground state geometry, all the atoms except one capping the triangular face of trigonal prism have a minimum of four-fold coordination. The nature of bonding is analyzed using ELF which shows the expected covalent bonding among all the silicon atoms.

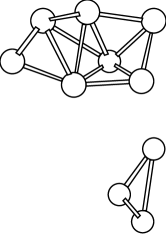
Next, we discuss the calculated ionic specific heat curve for Si10 shown in Fig. 2. The salient features of the curve are presence of a broad shoulder from 350 K to 1400 K and a main peak at 2300 K. An analysis of ionic motion at various temperatures, reveals several additional aspects. The shoulder at 350 K arises from a structural transition of cluster from the ground state to the first excited state and back to the ground state. This process is due to the attempt of the tri-coordinated atom (the atom capping the triangular face of the trigonal prism) to acquire the forth neighbor. The isomerization seen around 350 K is quite similar to that of Sn10 Our-PRBsn10 and occurs in such a way that at least three atoms (cap on triangular face, rectangular face and one from the trigonal prism) exchange their positions without changing the geometry considerably. This transition occurs with increased frequency until 1400 K and leads to the diffusion of atoms through out the cluster without considerable change in the geometry. It is only at 1600 K and beyond that structures corresponding to the other excited states (which are higher in energy by almost 1 eV) are observed. Thus, the rise in the specific heat curve observed after 1400 K is associated with the destruction of the TTP unit and occurrence of other excited states. At much higher temperatures, around 2300 K and above, we observe several high lying configurations which can be thought of as two weakly bonded clusters of smaller sizes, with energies above 2.5 eV with respect to the ground state. The cluster eventually fragments around 2800 K into Si7 and Si3 as shown in Fig. 3.
Thus, though the main peak in the specific heat curve of Si10 is seen around 2300 K, it cannot be attributed to the solid-like to liquid-like transition. In fact, we believe that this peak is due to the fragmentation that occurs around 2800 K. This is also evident from the analysis of the root mean square bond-length fluctuations () shown in Fig. 4–(a). It is clearly seen that is characterized by two sharp increments, first one from 175-650 K and another at 2800 K. According to the bulk Lindemann criterion a value of greater than 0.1 is indicative of transition from solid phase to

liquid phase. In bulk, the solid-liquid transition is sharp whereas in clusters, the transition is gradual and is observed that, in a liquid-like phase, the value of saturates around . At 650 K reaches a value of 0.2. This is due to the fact that GS-First Excited state-GS transition results in diffusion of atoms through out the cluster thereby saturating the value of . The value of is almost constant for next 1000 K (i.e. up to 1600 K). Above 1600 K, coincident with the destruction of TTP unit, the experiences a gradual and slow rise until 2600 K. This gradual rise ends with a second sharp jump at 2800 K due to fragmentation of the cluster.
Next we analyze the average distribution of atoms from Center of Mass (COM) of the cluster as a function of temperature (shown in Fig. 5). We have plotted the probability of finding an atom as a function of distance from the COM. At low temperatures, a perfect shell structure is retained, as observed for 100 K (shown in Fig. 5–a). It can be easily identified that the first two peaks correspond to

the two faces of the trigonal prism, the third peak corresponds to the caps on the rectangular surfaces and the last one is due to the cap on the triangular face. With increasing temperature, the peaks begin to merge in the bottom, (as seen around and above 350 K) indicating an exchange of atoms between various shells. Around 650 K, four peaks merge into two and the distribution of atoms remains identical till 1400 K. Above 1600 K, the COM plot indicates absence of any sort of average order in the arrangement of the atoms. The peak gets more broader at higher temperatures and around 2300 K (coincident with the peak in the specific heat), the atomic distribution from COM is seen as a broad curve.
In short, the main peak in the specific heat curve occurs around 2300 K which is due to fragmentation. The Lindemann criteria, atomic distribution of atoms around COM and other qualitative parameters indicate diffusive motion of atoms within the cluster around 650 K. Although, for a very broad range of temperatures, from 650 K to 1400 K, the cluster undergoes characteristic isomerization discussed earlier, it retains the shape of the cluster, but allows diffusion of the atoms through out the cluster. Thus, finite temperature behavior of very small clusters like Si10, is dominated by isomerization. The solid-like to liquid-like transition is continuous and it is rather difficult to discern the transition temperatures for the same. This is also confirmed by our on going studies on small sodium and lithium clusters Na-Mal-Soon .
Turning to the finite temperature study of Si15, we first discuss the equilibrium structures of Si15 shown in Fig. 1–(e to h). The ground state geometry of Si15 can be described as a tricapped trigonal prism fused with a tricapped trigonal anti prism (C3v symmetry Fig. 1–(e)). This is consistent with the lowest energy configuration reported by CCSD(T) Si-JCP and DFT simulations Jackson . The first excited state consists of two TTP units sharing a common triangular face as shown in Fig. 1–(f). This structure can be viewed as a serious distortion of the lower six atom ring present below the TTP unit in the ground state. The first few excited states are built on TTP unit of Si9 as shown in Fig. 1–(f,g), whereas isomers observed at higher temperatures can be thought of as a combination of two small silicon clusters as shown in Fig. 1–(h) and suggest probable paths for fragmentation.
The ionic specific heat curve computed for Si15 (see Fig. 6) has two small peaks around 400 K and 800 K and a main peak around 1400 K which is associated with fragmentation of the cluster around 1800 K. Ionic motions of Si15 cluster at various temperatures provide a plausible explanation for different features observed in the specific heat curve.

We would also like to note that Si15 has many low lying isomers (we have at least 30 different equilibrium structures out of which few relevant structures are shown in the figure) unlike Si10. The isomerization begins around 400 K when we observe the first excited state within our calculation (Fig. 1–(f)). This involves rearrangement of lower six atom ring. With further rise in temperature, the cluster remains in the first excited state for a reasonable amount of time after which the atoms in upper TTP unit reorient into a six atom ring leading to an inverted ground state. Thus, the first excited state appears to be an intermediate for interchanging the positions of TTP unit and the hexagonal ring in the ground state. This isomerization process does not involve diffusion of atoms within the cluster and continues to occur with increased frequency until 700 K. Further rise in temperature leads to several other isomerization routes along with the one described above which results in to diffusion of atoms through out the cluster. This corresponds to the second shoulder seen in the specific heat curve around 800 K (see Fig. 6). Around 1200 K isomers corresponding to two small silicon clusters (Fig. 1–(h)) are observed in the ionic motion which provide a fragmentation path at higher temperatures.
The (shown in Fig. 4–(c)) and the distribution of atoms from COM of Si15

(shown in Fig. 7) support these observations. Linear rise in at lower temperatures is indicative of pure vibrational motion. Beginning of isomerization is shown up as a rise in around 400 K which continues till 900 K. The value of saturates after 900 K showing a liquid-like state over a short temperature range. Around this temperature, the diffusive motion of atoms between the upper and lower units of Si15 is clearly seen in the distribution of atoms from the COM plot. The value of increases abruptly around 1800 K due to the fragmentation of Si15 into Si9 and Si6 clusters.
It is interesting to compare the finite temperature behavior of Si15 and Si10. Although, both clusters fragment, Si15 (1800 K) dissociates at considerably lower temperature than Si10 (2600 K) note . In case of Si10, all isomers except one, are at much higher in energy. As a result, the cluster undergoes a peculiar isomerization (described earlier) over a wide range of temperatures (350 K to 1400 K) leading to a broad shoulder in the specific heat curve and a flat region in the plot. On the other hand, in case of Si15, the isomerization region is spread over comparatively shorter range of temperatures (400 K to 900 K).
As we have already noted, for the clusters of group IV elements, TTP forms a basic block on which larger clusters are built upon. As will be discussed, the ground state of Si20 is a prolate structure whereas the TTP unit is evident in the excited states. Though the fragmentation of Si20 is expected, it will be interesting to see if the fragmentation is preceded by a liquid like state. In what follows, we present the thermodynamics of Si20 cluster. In Fig. 1–(i) to (l), we show the ground state as well as some of the excited state geometries of Si20. The lowest-energy isomer of Si20 is composed of three units: a so called magic number cluster Si6, a hexagonal chair unit in the middle, and a low energy isomer of Si8 unit. The first excited state consist of two distinct TTP units whereas the second one is non-prolate, spherical structure. The forth equilibrium structure that we have shown in the figure, (see Fig. 1–(l)) has two Si10 units connected via very weak bonds (bond lengths as compared to the normal Si-Si covalent bondlength of 2.34 Å). As we shall see, the cluster fragments via this isomer. All the equilibrium structures shown here are consistent with earlier reports Jackson-2004 ; Si-PRL-Dynamics .
The nature of bonding is examined using ELF. As expected, ELF for the ground state shows a high covalent bonding with all the basins completely connected by an isovalue of 0.75. It is also observed from ELF that the two TTP units in Fig. 1–(l) are weakly bonded to each other. Turning to the finite temperature behavior of Si20, we note that till 800 K, atoms in the cluster vibrate about their mean positions and no isomerization is observed. Around 1000 K, the cluster transforms from the ground state to the excited state having two distinct Si10 units (Fig. 1-(l)) and eventually fragments into two Si10 units around 1200 K. This is reflected in the shown in Fig. 4–(d) where the fragmentation is evident from the sharp rise around 1200 K. In other words, finite temperature behavior of Si20 does not show solid-liquid transition prior to fragmentation. This may be attributed to the low dissociation energy barrier in case of Si20 cluster (of the order of 1.2 eV) in comparison to that of Si10 and Si15 (which have a dissociation energy barrier of 4.2 eV and 2.2 eV respectively) Si-Disso . To understand the influence of starting geometry on the fragmentation behavior of the cluster, we have repeated the thermodynamic simulations on Si20 cluster with Fig. 1–(j) and Fig. 1–(k) as the starting configurations. We observe the cluster to fragment around 1200 K in both these calculations as well indicating that the fragmentation behavior is not sensitive to the starting configuration of the cluster.
We end our discussion on silicon clusters with an interesting observation. The observed fragmentation can be bypassed with higher rate of heating. In all these simulations, the cluster is heated to a particular temperature from the previous temperature at a rate of 1 K in 30 fs and then maintained at that temperature for next 30 ps. This is used as a starting point for heating the cluster to the next temperature. We observed the fragmentation after maintaining the cluster at 1200 K for at least 60 ps. On the other hand when the cluster is heated from 1200 K to 1600 K, without sufficiently thermalizing it at 1200 K, it shows liquid-like behavior at 1600 K. This liquid like state is also observed for 1800 K note1 .
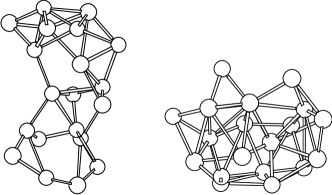
It is seen that while heating the cluster without allowing enough time for thermalization, it attains enough kinetic energy to push the two Si10 units closer to each other (SiTTP1-SiTTP2 bond distance of 2.2 Å). Consequently, the two TTP units begin to interact leading to high lying configurations (containing no TTP units) as shown in Fig. 8. The ionic motion of this super heated cluster shows that the cluster does not fragment at the end of 100 ps. On the contrary, a complete diffusive motion of atoms within the cluster is observed.

The temperature of the cluster was further raised to 1800 K. The cluster was then maintained at that temperature for an additional time scale of 100 ps. An analysis of ionic motion at this temperature shows the cluster to be in a liquid-like state there by revealing a possibility to bypass the fragmentation process. An examination of ionic motion at 1600 K and 1800 K reveals many interesting features. Around 1600 K, the cluster oscillates between prolate configurations and non-prolate (near spherical) configurations several times. As the temperature rises, the cluster spends more time within the near spherical configurations. This shape change can be experimentally detected using ion mobility experiments (diffusion coefficient) Jar-tin1 . Hence, is it interesting to analyze these shape changes in a more detailed fashion. In Fig. 9, we have plotted the deformation coefficient () of the cluster as a function of time, at 1600 K and 1800 K respectively. For a given ionic configuration, is defined as
| (1) |
where, Q1,Q2 and Q3 are the eigenvalues, in descending order of the quadrapole tensor
| (2) |
I runs over the number of ions and RIi is the ith coordinate (i and j run from 1 to 3) of the ion ‘I’ relative to the center of mass of the cluster. An ionic configuration with spherical shape has a value of = 1. Deviation of the value of from 1 is a measure of prolaticity of the cluster. As is seen from the figure, the cluster oscillates between prolate and nearly spherical configurations quite frequently around 1600 K. At 1800 K, the oscillations reduce and the structure is seen to visit the spherical configurations more often. The value of at 1600 K and 1800 K is 0.35 and 0.37 respectively and satisfies the Lindemann criterion.
III.2 Thermodynamics of Tin clusters
Various interesting observations seen in case of the silicon clusters and recent experiments Jar-Tin-frag on tin clusters (Sn19, Sn19, Sn20 and Sn21) have motivated us to revisit the thermodynamics of tin clusters (Sn10 and Sn20). In the present work, the finite temperature study is carried out within the GGA as well as LDA approximations using the vasp package vasp . The clusters are heated to each temperature at a much slower rate (1 K in 0.036 ps) than in our earlier work. The cluster was maintained at each temperature for a period of aleast 90 ps (as contrast to 40 ps per temperature in our earlier work). The heat capacity curves are computed from the above calculations (GGA and LDA) and compared with our earlier results.
The finite temperature behavior of Sn10 is seen to be considerably similar to that of Si10. This is in fact expected result as the ground state and even the excited state configurations of Si10 and Sn10 are identical. It is gratifying to note that the specific heat curves computed from GGA as well as LDA calculations are nearly similar to that of our earlier reported one Our-PRBsn10 (with a slightly shifted main peak around 2200 K as compared to our earlier reported one at 2300 K). Various inferences concerning bonding and ionic motion are in perfect agreement with our earlier report. The significant difference to be noted is the fragmentation of Sn10 observed at 2600 K. This process is observed only after a time scale of 60 ps. We believe this feature to be missing in our earlier reports due to the smaller simulation time scales ( 50 ps per temperature). However, it may be recalled, that ionic motion of cluster at 2600 K in our earlier study revealed few configurations corresponding to weakly interacting Snx and Sn10-x units. Thus, we conclude that the peak in the specific heat curve is due to the fragmentation of Sn10 cluster seen at 2600 K and not due to the traditional solid-liquid transition as reported.
We have also computed the ionic specific heat of Sn20 cluster within GGA and LDA approximations. Analysis of the ionic motion of Sn20 cluster (GGA) at various temperatures shows that the cluster vibrates around its ground state until 600 K. Around 650 K, the cluster fragments into two TTP (Sn10) units. This is in perfect agreement with the recently reported experimental observations Jar-Tin-frag . Finite temperature study of Sn20 cluster within LDA approximation shows the cluster to fragment into two Sn10 units around 1000 K. The failure to detect the fragmentation behavior in our earlier reports is attributed to the following reasons: (a) faster heating rate (1 K in 0.01 ps) with smaller simulation time scales in our earlier simulations (40 ps per temperature). (b) Use of LDA functional in our earlier reports. As already mentioned ground state Sn20 Our-PRBsn20 cluster has inhomogeneous bond strength distribution. While the bonds within intra-TTP atoms are strongly covalent in nature, inter-TTP atoms are connected through very weak covalent bonds. The LDA approximation was unable to distinguish these differences leading to an over-estimation of binding energies between the two TTP units. Hence, the Sn20 cluster did not fragment in the small simulation times scales reported earlier. Sn10 cluster in contrast, has all its atoms connected with similar bond strengths, resulting in a more accurate finite temperature behavior within the LDA approximation.
IV conclusions
We have presented thermodynamics of small silicon and tin clusters (Si10, Si15, Si20, Sn10 and Sn20) within LDA and GGA approximations of DFT. Finite temperature behavior of Si10 and Sn10 is dominated by isomerization process and fragmentation is observed around 2800 K and 2600 K respectively. The peak in the specific heat curves around 2300 K and 2200 K for Si10 and Sn10 correspond to the observed fragmentation rather than solid-like to liquid-like transition. The similarities observed in the finite temperature behavior of these two clusters suggest the influence of ground state structures on the finite temperature behavior of a cluster. The specific heat curve of Si15 has a main peak around 1400 K which is due to the fragmentation observed around 1600 K. However, the cluster exhibits a liquid like behavior over a short temperature range (900 K to 1400 K) before fragmenting. Si20 and Sn20 are found to dissociate without melting around 1200 K and 650 K respectively. Our simulations on Sn20 agree with the recently reported experimental results.
V acknowledgments
We are grateful to Prof. Jackson for providing us with the ground state configuration of Si20. C–DAC (Pune) is acknowledged for providing us with the supercomputing facilities. The authors thank IFCPAR for partial financial support.
References
- (1) M. Schmidt, R. Kusche, B. von Issendorff, and H. Haberland, Nature (London) 393, 238 (1998). M. Schmidt and H. Haberland, C. R. Physique 3 327, (2002), H. Haberland, T. Hippler, J. Dongres, O. Kostko, M. Schmidt, and B. von Issendroff. Phys. Rev. Lett. 94 035701 (2005).
- (2) A. Shvartsburg and M. F. Jarrold, Phys. Rev. Lett. 85, 2530 (2000)
- (3) G. A. Breaux, R. C. Benirschke, T. Sugai, B. S. Kinnear, and M. F. Jarrold, Phys. Rev. Lett. 91, 215508 (2003).
- (4) G. A. Breaux, D. A. Hillman, C. M. Neal, R. C. Benirschke, and M. F. Jarrold, J. Am. Chem. Soc. 126, 8628 (2004).
- (5) G. A. Breaux, C. M. Neal, B. Cao, and M.F. Jarrold Phys. Rev. Lett. 94, 173401 (2005).
- (6) Z.Y. Lu, C.Z. Wang, and K.M. Ho, Phys. Rev. B 61, 2329 (2000)
- (7) A. M. Vichare, D.G. Kanhere, and S. A. Blundell Phys. Rev. B 64 045408 (2001)
- (8) K. Joshi, D. G. Kanhere, and S.A. Blundell, Phys. Rev. B 66 155329 (2002)
- (9) K. Joshi, D. G. Kanhere, and S.A. Blundell, Phys. Rev. B 67 235413 (2003)
- (10) S. Chacko, Kavita Joshi, D.G. Kanhere, and S. A. Blundell, Phys. Rev. Lett. 92, 135506 (2004)
- (11) M.Manninen, A. Rytkonen, and M. Manninen Eur. Phys. J. 29, 39 (2004)
- (12) F.C. Chuang, C.Z. Wang, S.Ogut, J.R. Chelikowsky, and K.M. Ho, Phys. Rev. B 69, 165408 (2004)
- (13) S. Chacko, D.G. Kanhere, and S. A. Blundell, Phys. Rev. B 71, 155407 (2005)
- (14) K. Fuke, K. Tsukamoto, F. Misaizu, and M. Sanekata, J. Chem. Phys. 99, 7807 1993.
- (15) A.A. Shvartsburg, M.F. Jarrold, B. Liu, Z.Y. Lu, C.Z. Wang, and K-M. Ho Phys. Rev. Lett. 81, 4616 (1998)
- (16) K.-M. Ho, A.A. Shvartsburg, B. Pan, Z.Y. Lu, C.Z Wang, J.G. Wacker, J.L. Fye, and M.F. Jarrold, Nature, 392, 582 (1998)
- (17) B. Liu, Z.Y. Lu, B. Pan, C.Z. Wang, K.M. Ho, A.A. Shvartsburg, and M.F. Jarrold J. Chem. Phys. 109, 9401 (1998)
- (18) K. Zickfeld, M.E. Garcia, and K.H. Bennemann Phys. Rev. B 59, 13422 (1999)
- (19) A.A. Shvartsburg and M.F. Jarrold, Chem. Phys. Lett. 317, 615 (2000)
- (20) J. Muller, B. Liu, A.A. Shavartsburg, S. Ogut, J. Chelikowsky, K.W.M. Sui, K-M. Ho, and G. Gantefor Phys. Rev. Lett. 85, 1666 (2000)
- (21) L. Mitas, J.C. Grossman, I. Stich, and J. Tobik Phys. Rev. Lett. 84, 1479 (2000)
- (22) I. Rata, A. A. Shvartsburg, M. Horoi, T.Frauenheim, K. W. Michael Siu, and K. A. Jackson Phys. Rev. Lett. 85, 546 (2000).
- (23) A.D. Zdetsis Phys. Rev. A 64, 023202 (2001)
- (24) A.A. Shvartsburg, R.R. Hudgins, P. Dugourd, and M.F. Jarrold Chem. Soc. Rev. 30, 36 (2001)
- (25) B.K. Panda, S. Mukherjee, and S.N. Behera Phys. Rev. B 63, 045404 (2001)
- (26) K.A. Jackson, M. Horoi, I. Chaudhuri, T. Frauenheim, and A. A. Shvartsburg Phys. Rev. Lett. 93, 013401, 2003.
- (27) Q. Sun, Q. Wang, P. Jena, S. Waterman, and Y. Kawazoe, Phys. Rev. A 67, 063201 (2003)
- (28) X. L. Zhu and X. C. Zeng J. Chem. Phys. 118, 3558 (2003)
- (29) X. L. Zhu, X. C. Zeng, and B. Pan J. Chem. Phys. 120, 8985 (2004)
- (30) S. Yoo and X.C. Zeng Angew. Chem. Int. Ed. 44, 1491 (2005)
- (31) Y.Tai and J. Murakami Chem. Phys. Lett. 339, 9 (2001)
- (32) Y.Tai, J. Murakami, C. Majumdar, V. Kumar, H. Mizuseki, and Y. Kawazoa, J. Chem. Phys. 117, 4317 (2002)
- (33) Y.Tai, J. Murakami, C. Majumdar, V. Kumar, H. Mizuseki, and Y. Kawazoa, Eur. Phys. J. D 24, 295 (2003)
- (34) A.L. Zhang, Y. Liu, R.F. Curl, F.K. Tittel, and R.E. Smalley, J. Chem. Phys. 88, 1670 (1988)
- (35) G.A. Breaux, C. M. Neal, B. Cao, and M.F. Jarrold Phys. Rev. B 71, 073410 (2005)
- (36) A.A. Shvartsburg and M.F. Jarrold, Phys. Rev. A 60, 1235 (1999)
- (37) M.C. Payne, M.P. Teter, D.C. Allen, T.A. Arias, and J. D. Joannopoulos, Rev. Mod. Phys. 64, 1045 (1992).
- (38) D. Vanderbilt, Phys. Rev. B 41, 7892 (1990).
- (39) Vienna ab initio simulation package, Technische Universität Wien (1999); G. Kresse and J. Furthmüller, Phys. Rev. B 54, 11169 (1996).
- (40) B. Silvi, and A. Savin, Nature (London), 371, 683 (1994).
- (41) A. M. Ferrenberg and R. H. Swendsen, Phys. Rev. Lett. 61, 2635 (1988); P. Labastie and R. L. Whetten, Phys. Rev. Lett. 65, 1567 (1990).
- (42) D. G. Kanhere, A. Vichare, and S. A. Blundell, Reviews in Modern Quantum Chemistry, Edited by K. D. Sen, World Scientific, Singapore (2001).
- (43) K. Raghavachari and C. M. Rohlfing, J. Chem. Phys. 89, 2219 (1988). P. Ballone, W. Andreoni, R. Car, and M. Parrinello, Phys. Rev. Lett. 60, 271 (1988). C. M. Rohlfing and K. Raghavachari, Chem. Phys. Lett. 167, 559 (1990).
- (44) Mal-Soon Lee, S. Chacko, and D. G. Kanhere (submitted to J. Chem. Phys.)
- (45) Fragmentation is first observed at these temperarures and it is shown up as a sudden rise in the value of . See Fig. 4
- (46) The observed liquid-like behavior sustains for atleast 100 ps.