Low Frequency Acoustic Resonance Studies of the Liquid-Vapor Transition in Silica Aerogel
Abstract
Fluid phase transitions in porous media are a powerful probe of the effect of confinement and disorder on phase transitions. Aerogel may provide a model system in which to study the effect of dilute impurities on a variety of phase transitions. In this paper we present a series of low frequency acoustic experiments on the effect of aerogel on the liquid-vapor phase transition. Acoustic resonators were used to study the liquid-vapor transition in two fluids (helium and neon) and in two different porosity aerogels ( and ). While effective coexistence curves could be mapped out, the transition was sometimes difficult to pinpoint, leading to doubt as to whether this transition can be treated as an equilibrium macroscopic phase transition at all.
I Introduction
Fluids confined in porous media provide a valuable system in which to study the effects of disorder and confinement on phase transitions and critical behavior. Helium, with its rich phase diagram, has proven a particularly important testing ground. For instance, when liquid 4He is confined in porous Vycor glass, the superfluid density varies with the same exponent as near the bulk lambda transition, but the heat capacity anomaly is greatly suppressedZassenhaus and Reppy (1999). Films of 4He adsorbed on Vycor, on the other hand, share some features with the Kosterlitz-Thouless transition in 2-dimensional films (e.g. superfluid transition temperatures decrease with film thickness) but have significant heat capacity peaks Murphy and Reppy (1990); Crowell et al. (1997).
Silica aerogels, with their tenuous structure and extraordinarily low densities, provide a unique opportunity to introduce small concentrations of impurities into helium in a controllable way. Experiments include a variety of transitions which are affected differently by the presence of aerogel. For example, the lambda transition for 4He remains very sharpChan et al. (1988); Yoon et al. (1998) but with a non-bulk critical exponent for superfluid density, while for 3He, aerogels suppress or even completely eliminate superfluidityMatsumoto et al. (1997); Porto and Parpia (1999), resulting in a zero temperature “quantum phase transition.” A major difference between these superfluids is their correlation length. In 4He it is very small and only approaches the characteristic length scale of the aerogel structure at temperatures very close to the lambda point; in 3He the correlation length is much larger, comparable to that of the aerogel at all temperatures. The aerogel strands also couple more strongly to some order parameters, e.g. to the concentration in a binary fluid mixture, so we would expect a transition such as phase separation to be strongly affected by an aerogel. For 3He-4He mixtures, the presence of 2% or even 0.5% silica (i.e. aerogels with porosity of 98% or 99.5%) has dramatic effectsChan et al. (1996); Kim et al. (1993); Mulders and Chan (1995) on the entire phase diagram, causing the phase separation curve to detach from the lambda line and stabilizing a region of dilute 4He superfluid inaccessible in bulk mixtures.
The liquid-vapor transition has an order parameter (density) which couples directly to a porous medium via the Van der Waals interaction. It is well known that in small pores the attraction to pore surfaces stabilizes the liquid phase at pressures well below bulk saturation. In most porous media the variety of adsorption environments leads to a gradual transition in fluid density from a “pore vapor” to a “pore liquid” phase, rather than the sharp transition of bulk fluids. Adsorption isotherms are used to study this capillary condensation, which is often accompanied by hysteresis between adsorption and desorption, indicating the importance of metastable liquid-vapor configurations. The traditional picture of capillary condensation involves a liquid covering the surface of a simple pore (e.g. a cylinder) and a liquid-vapor interface with a negative curvature needed for surface tension to stabilize the liquid phase. However, this picture breaks down in aerogels and near the liquid-vapor critical point (LVCP).
Aerogels are better described as a dilute network of interconnected strands than as a collection of closed pores and so we might expect a liquid film to have a positive rather than negative curvature. Aerogel strands are very narrow (diameters of a few nm) and close to the LVCP thermal fluctuations grow from atomic to macroscopic scales. In this regime, many thermodynamic properties diverge (e.g. compressibility) or tend to zero (e.g. surface tension) and the thickness of the liquid-vapor interface itself exceeds the strand diameter or even the effective pore size. It is then necessary to picture the aerogel as a random perturbation affecting the fluid phases in some averaged way.
In bulk fluids, the liquid-vapor transition falls into the Ising universality class and deGennesBrochard and de Gennes (1983); de Gennes (1984) has suggested that fluids in porous media may provide a realization of the random field Ising model. Studies of binary fluid separationGoh et al. (1987); Monette et al. (1992); Lin et al. (1994); Frisken et al. (1995); Valiullin and Furo (2002) in porous media lend some support to this theory, although in some cases the behavior can also be described within a single-pore model which neglects the presence of disorder in the medium. Experimental work on near-critical single-component fluids includes xenon and SF6 in dense porous glassesMachin (1999); Thommes and Findenegg (1994); Thommes et al. (1995). These studies showed a slight narrowing in the phase separation curve, with the vapor branch shifted to higher densities than in the bulk fluid. In addition, the termination of this curve, sometimes referred to as the “capillary critical point,” was shifted to a temperature below the bulk LVCP. Despite the relatively well defined pore geometries of these systems there is no general agreement about how to picture the behavior near the LVCP.
The first liquid-vapor experiments involving aerogelsWong and Chan (1990) showed a reduced critical temperature for 4He in a 95% porosity sample and a coexistence region which was dramatically narrowed (by an order of magnitude). Below the critical point, isotherms appeared to have discontinuous density jumps between vapor- and liquid-like phases and no hysteresis was observed, consistent with an equilibrium liquid-vapor transition. The surprisingly narrow coexistence curve, determined from heat capacity and isotherm measurements, could be fit using the bulk critical exponent. Light scattering measurements with N2 in aerogelWong et al. (1993) also showed a coexistence curve that was narrower than for bulk, but substantially broader than for 4He.
More recently, a mechanical pendulumGabay et al. (2000b, a) was used to study 4He in a similar aerogel. Thermal response times were very long but the isotherms showed hysteresis between filling and emptying, even near the critical point, and appeared to have finite slopes at all temperatures. This behavior is characteristic of capillary condensation, rather than equilibrium coexistence and critical behavior. Preliminary ultrasonic and acoustic resonator measurements in our laboratoryTan and Beamish (2000); Herman and Beamish (2002, 2003) showed hysteresis for both neon and helium in aerogels and implied phase separation curves for which were substantially broader than the 4He curve in Ref. Wong and Chan, 1990. A recent direct measurement of density fluctuations in carbon dioxide confined in aerogelMelnichenko et al. (2004) showed little evidence for a diverging correlation length at the LVCP, suggesting that the disorder introduced by aerogel structure may limit the range of thermal fluctuations.
In parallel with this acoustic study of fluids in aerogel we have performed measurementsBeamish and Herman (2003, 2004); Herman (2005); Herman et al. (2005a) of helium density in aerogels along adsorption and desorption isotherms at temperatures ranging from far below to well above the bulk LVCP. While the aerogels filled and emptied over narrow pressure ranges, there was no direct evidence for a discontinuous change in fluid density along any of the isotherms. Hysteresis between the adsorption and desorption branches was evident until very close to the critical point in both 95% and 98% porosity aerogels, in contrast to Ref. Wong and Chan (1990). Furthermore, these experiments provided a direct measurement of the thermal relaxation within the aerogel — even the very thin samples used (mm thick) exhibited equilibration times of up to several hours.
The differences between the behavior seen in the early 4He heat capacity experiments and that in more recent isotherm measurements are puzzling, but could reflect differences in how the measurements were made. The heat capacity and light scattering measurements followed isochores, in cells almost completely filled with aerogel, so only small amounts of helium were adsorbed or desorbed when the temperature was changed. Subsequent isotherm measurements were made in cells which contained large amounts of bulk fluid and involved substantial changes in the adsorbed helium density. Although the different measurements used aerogels of similar porosity (about 95%), it is also possible that the hysteresis and the width of the liquid-vapor coexistence curve are sensitive to small variations in aerogel density or structure. Simulations of fluids in aerogelsKrakoviack et al. (2001) indicate that the liquid-vapor behavior is also controlled by the relative strengths of adsorbate-adsorbate and adsorbate-substrate interactions, so variations in the width of the coexistence curves for helium and nitrogen could reflect the interactions in these fluids.
The experiments described in this paper were designed with several goals in mind. We wanted to measure a fundamental thermodynamic parameter, to complement the information available from adsorption isotherms and provide a more complete picture of critical behavior of fluids in aerogels. We looked for a probe that, as well as being sensitive to phase separation, could provide thermodynamic information in the single phase region above the critical temperature where measurements are not complicated by the presence of a liquid-vapor interface. In order to avoid large amounts of fluid moving in and out of the aerogel and to allow direct comparison to the earlier heat capacity measurements, we tried to minimize the amount of bulk fluid surrounding the aerogels and took data along isochores. We wanted to measure coexistence curves in more detail and over a broader temperature/density range around the LVCP than previous experiments. By using different fluids in the same aerogel we could study how the behavior varied with interaction strength and by comparing the behavior in aerogels with different porosities we could see how it depended on impurity density.
To meet these goals, we built acoustic resonatorsHerman and Beamish (2002, 2003) and used them to study helium and neon in aerogels with porosities near 95% and 98%. Acoustic resonators have proven their value in the study of superfluidity in aerogels, for example by measuring the speed of sound in 3He confined in aerogelsGolov et al. (1999); Lawes et al. (2003). A resonator measures compressibility, one of the fundamental thermodynamic properties that characterize critical behavior. The isothermal compressibility of a fluid diverges at Tc but low frequency acoustic measurements probe the adiabatic compressibility, which is dominated near Tc by the heat capacity’s behavior allowing, for example, the heat capacity exponent to be determined for bulk fluidsThoen and Garland (1974).
Acoustic resonances probe the entire sample and their frequencies are sensitive to the large scale inhomogeneities associated with phase separation. When aerogels are present, the damping of resonant modes provides additional information about dissipation due to processes such as microscopic heat flow and redistribution of fluid in response to adiabatic compressions. Aerogel complicates matters as well, since most resonator modes then have both compressional and shear components. The resonant frequencies also depend on boundary conditions, so even a relatively small bulk-fluid volume around the aerogel can have a significant effect. However, even if it is not possible to extract quantitative values of fluid compressibility, both the resonance frequencies and their amplitudes can be used as markers of phase separation. Since sound modes depend directly on density, which for high porosity aerogels is dominated by the fluid, acoustic resonators provide a sensitive method by which to map out the coexistence curve, as has been done for bulk fluidsColgate et al. (1990).
In this paper we present detailed results of our acoustic resonator studies of liquid-vapor behavior in aerogels. We made measurements with helium and neon in aerogels similar to those used in earlier experiments (95% porosity) and with helium in a lower density (98% porosity) aerogel. Resonator measurements with bulk fluid were easily interpreted, but were much more complicated when the aerogels were present, with unexpected splitting of resonances and apparent mode crossings. Nonetheless, we were able to map out coexistence curves for the three systems described above. The results for helium were consistent with previous isotherm measurementsGabay et al. (2000a); Herman et al. (2005a) but in neither aerogel was there evidence for coexistence curves as narrow as those reported from heat capacity measurementsWong and Chan (1990). The helium and neon coexistence curves in the 95% porosity aerogel had similar widths, both somewhat narrower than in bulk. The helium coexistence curve in the 98% porosity aerogel was wider than in 95% aerogel, although still narrower than for bulk, consistent with the idea that a lower density aerogel has less effect on the liquid-vapor transition.
II Experimental Details
Our cells were cylindrical resonance chambers capped by thin membranes; piezoelectric transducers mounted on the two membranes acted as speaker and microphone respectively. When filled with a single phase fluid (without aerogel) the resonance frequencies () were those of a closed pipe:
| (1) |
where v is the speed of sound in the fluid, L the length of the cavity, and n is any positive integer. Due to the low density and compliant nature of aerogel, the resonant frequencies in the presence of aerogel were similar to those of the bulk fluid resonator. To extract the actual fluid compressibility from this data requires a detailed analysis which takes into account both the solid backbone of the porous medium and the fluid within the medium. Analysis tools were pioneered by Biot, and expanded by othersBiot (1956a, b); Forest et al. (1998), but experimental factors complicated our data, preventing us from extracting the critical behavior of the compressibility. Hence, the features of the resonant frequency along isochores were used solely to map out the coexistence curve.
The two aerogel densities studied were and , corresponding to porosities of 95% and slightly less than 98% respectively. They are referred to as aerogels “B110” and “B51” throughout this paper. The aerogel samples were synthesized in our lab from tetramethyl orthosilicate (TMOS) using a standard one-step base catalyzed method followed by supercritical extraction of the methanol solventPoelz and Riethmüller (1982). The samples were approximately 2cm long cylinders, 1.2cm in diameter.
The copper cells were capped by mm copper membranes and the cavities were machined to fit the precise dimensions of the individual aerogels used, to reduce bulk fluid in the cell. Each sample was about 2cm long; the cavity was machined about 0.5mm shorter than the aerogel to ensure good contact with the membranes once assembled. Slight irregularities in the aerogel sample resulted in up to 2% of the resonator cavity being filled with bulk liquid. Figure 1
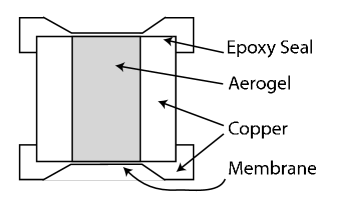
shows a cell used for helium. The caps on the helium resonators were sealed and held in place using epoxy111Bipax Tra-Bond (BA-2151) epoxy; the pressure was kept below 0.5MPa to avoid cell damage. The neon resonator caps were sealed with indium and held in place by bolts; the membranes were slightly thicker and could withstand pressures up to 5MPa.
A piezoelectric transducer (0.25mm thick PZT disc with silver electrodes) was soldered onto the outside face of each acoustic membrane and electrical contact to the top face of the transducer was made by directly soldering a thin copper wire to the transducer. The intrinsic resonance of these transducers was in the MHz range, far from interfering with the fluid resonances which were in the kHz range. The sinusoidal excitation frequency was swept over a range that included the fundamental resonant frequency of the system and usually the first harmonic frequency while the response was measured by a lock-in amplifier. Occasionally other resonances interfered with the signal (e.g. mechanical resonances of the membranes themselves), especially at higher frequencies (kHz).
The neon resonator was mounted on a closed cycle refrigerator, suspended from braided copper cables to adsorb vibrations while providing a thermal link to the baseplate of the cryostat. Its temperature was controlled using a 100 platinum resistance thermometer and a 200 thick film resistor, both mounted on the cell body. The helium resonators were mounted below the 1K pot of a helium cryostat. Its temperature was controlled using a calibrated germanium resistive thermometer and 200 thick film heater. The B110 helium resonator was cooled by admitting a few mbar of exchange gas into the vacuum can, while the B51 helium resonator was cooled through a weak thermal link to the 1K pot.
All thermometers used in this work came with manufacturer’s calibrations. However, the platinum resistance thermometer used for the neon experiments showed signs of a deviation from its calibration. To address this, the bulk neon coexistence curve was mapped out and the critical temperature was used as a fixed point to adjust the thermometer readings. The recalibration used a coaxial capacitor with neon as the dielectric between capacitor plates; it indicated an error in thermometer calibration of about mK. Some tests of the resonator technique using bulk neon indicated a comparable magnitude for the thermometer error. Combined with the capacitive measurements above these indicated that the thermometer calibration had shifted by more than 100mK and that it seemed to be slowly drifting over time, thus limiting the accuracy with which we could determine temperatures along the neon coexistence curve. The germanium thermometer used for the helium resonators was checked against the liquid-vapor critical point of 4He and found to agree within 3mK.
The density of neon in our experiment was calibrated by dosing the cell with neon from a gas handling system of known volume. Helium density was calibrated using a direct capacitive density measurement of helium in aerogel slices of the same density as used in the resonators. The method used for those measurements is described elsewhereHerman (2005); Herman et al. (2005a).
Data collection was fully automated; once the cell reached a set temperature point, it remained at that temperature for a prescribed “equilibration time” while the aerogel’s internal temperature settled. A full acoustic spectrum was then collected (such as that shown in Fig. 2, and the system moved onto the next temperature point. The resonant frequency was also tracked and logged during equilibration, although there were problems with spurious resonances and irregular peak shapes. The log files were valuable in showing how quickly the cell equilibrated, but the final data were taken from the full spectrum data files.
Filling and emptying of the sample between isochores were performed manually. During filling and emptying the cell was held well above the critical point to eliminate problems with latent heat or the equilibration of any liquid-vapor interfaces in the cell. Also, at no point during data collection was the cell allowed to cool below 43.500K for the neon in B110, 4.800K for helium in B110, or 5.000K for helium in B51. By keeping the temperatures in the cell close to the critical temperature we avoided possible damage to the aerogel from surface tension induced strains. In another study we have measured the deformation of these aerogels during adsorption and desorption of low surface tension fluidsHerman (2005); Herman et al. (2005b) and found that even liquid helium can cause significant deformation for gels with porosities of 95% and greater.
III Results
Each “coexistence curve” described in this paper was constructed by locating the transition temperature along each of a series of isochores, constructed in turn from a series of acoustic spectra taken as the temperature was varied. A phase change appeared as a sharp feature in the isochore — usually a dip or a kink in the resonant frequency, often accompanied by a sharp feature in the resonance amplitude. It will be shown that although the form of the feature was well defined in bulk fluid experiments, it was not as simple to locate the transition in the aerogels.
III.1 Bulk Neon
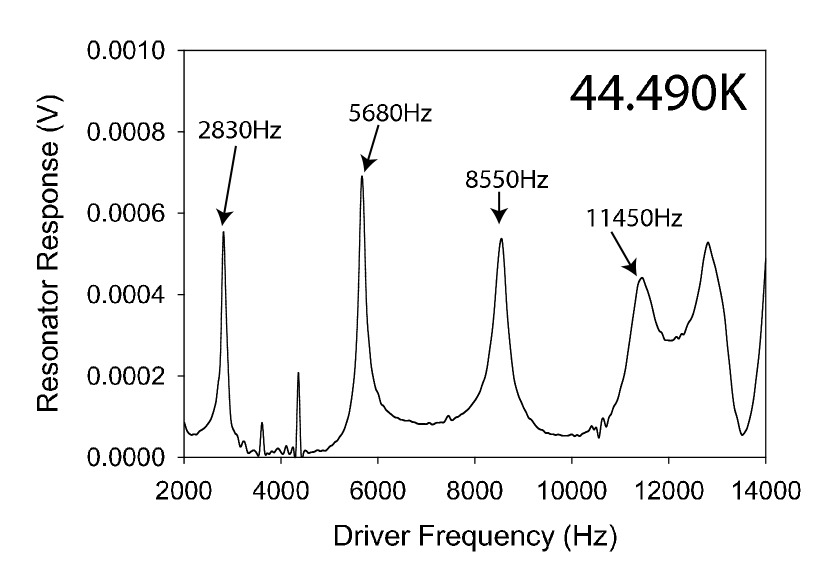
Figure 2 is an example of a spectrum, taken with bulk neon near its critical density () at a temperature just above the liquid-vapor critical point; the fundamental and first three harmonics are labelled. At higher frequencies there was interference from other modes; only the low frequency resonances were used to track the system’s behavior. The frequency of the fundamental resonance was recorded at different temperatures and these data were combined to form an isochore. As can be seen in Figure 3,
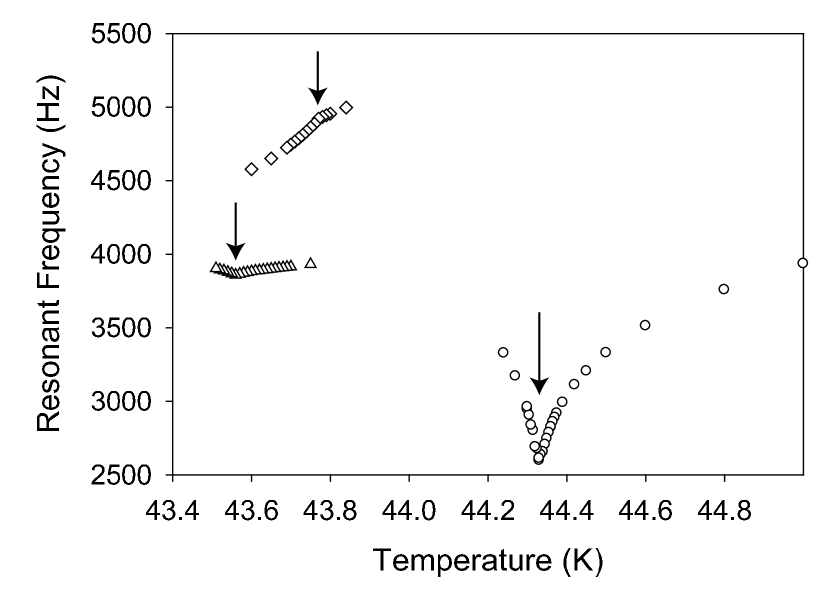
the shape of such an isochore depends on the density of the fluid. The phase transition appeared as a very sharp dip when , but far from the transition appeared as a less pronounced kink.
The position of the resonant peaks can be used to calculate the approximate speed of sound in bulk neon as a function of temperature along an isochore. The fundamental and first harmonic should give identical values for sound speed in a cylindrical resonator, although there will be a slight offset due to the non-ideality of our resonator. In our case the two peaks gave very similar values for sound speed in the one phase region, but the apparent “sound speeds” differ in the two phase region. This was because the existence of an inhomogeneous fluid distribution, with the appearance of a liquid-vapor meniscus, destroyed the cylindrical symmetry of the resonator and the second resonant frequency was no longer a simple harmonic of the fundamental frequency. Apparent sound speed (i.e. ) along an isochore is plotted for in
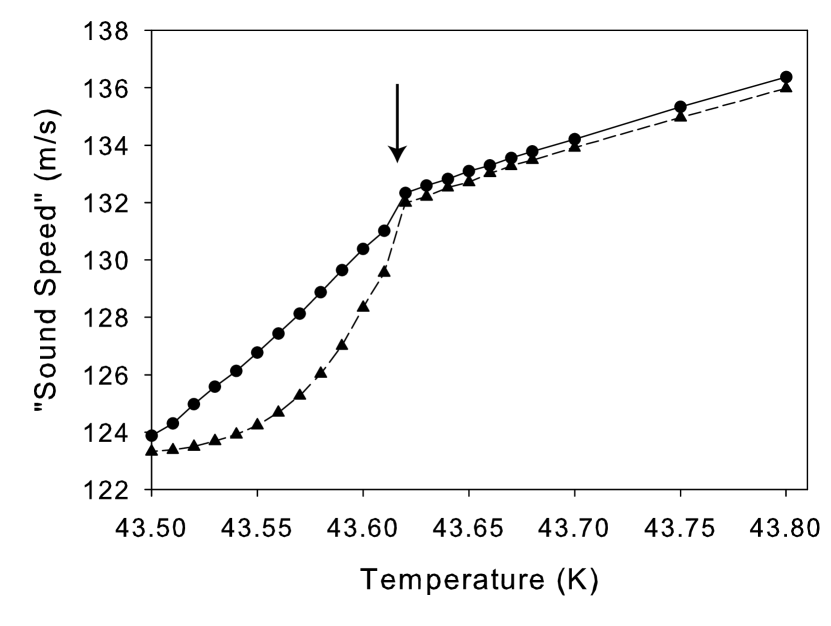
Figure 4 — below 43.620K the sound speeds changed dramatically, marking the entrance into two-phase coexistence. Even when the resonant frequency did not show a sharp feature at the transition, comparing apparent sound speeds calculated from the first two resonant frequencies allowed us to determine of the transition temperatures.
III.2 Fluids in Aerogels
Resonator results for the aerogel samples are of the same form as the bulk neon results discussed above, but with complications. The data points along an isochore were necessarily sparse because of long equilibration times. Aerogel is an excellent thermal insulator, which means experiments must use very small samples or very slow data collection. While some experiments Wong and Chan (1990); Herman et al. (2005a) work well with thin samples, our resonance experiments used large aerogels with their associated long equilibration times. At temperatures above the two-phase region, equilibration times of half an hour or less were sufficient to reach equilibrium. It was often impossible to reach equilibrium within the two-phase region on the laboratory time scale. This limited the temperature resolution — with only one or two dozen points along an isochore, the transition temperature could not be determined to better than mK.
The addition of aerogel to the system also affected the form of the resonance spectra. With the aerogel backbone to help support acoustic modes the transition did not appear as distinct as in the pure fluid system; at low fluid densities the transition was often undetectable. Another major complication added by the aerogel was the appearance of peak splitting in many of the spectra. There appeared to be frequency windows in which the resonator could not support a fluid resonance. In later experiments it was not uncommon to encounter many such windows, and the frequency windows shifted with fluid density. These are discussed in more detail in the section on helium in aerogel B51, where they were the most problematic.
III.3 Neon in Aerogel B110
Some of our preliminary dataHerman and Beamish (2002) have been published for neon in aerogel. However, that aerogel had a density of roughly , and was surrounded by a significant () bulk volume. The data presented here for neon in aerogel B110 supersede those earlier data and represent our highest precision resonator results. Some representative isochores are included as Figures 5-7.
Each figure includes the frequency and amplitude of the acoustic resonance as read from the lock-in amplifier. Absolute values of the amplitude have little meaning, but relative amplitudes along a single isochore give information on attenuation of the acoustic signal. At the transition one expects a sudden change in attenuation. The highest fluid density used in this experiment corresponded to the highest filling pressure that we were certain the cell could withstand without damage. The lower bound for the density was set by our ability to distinguish a transition along the isochores.
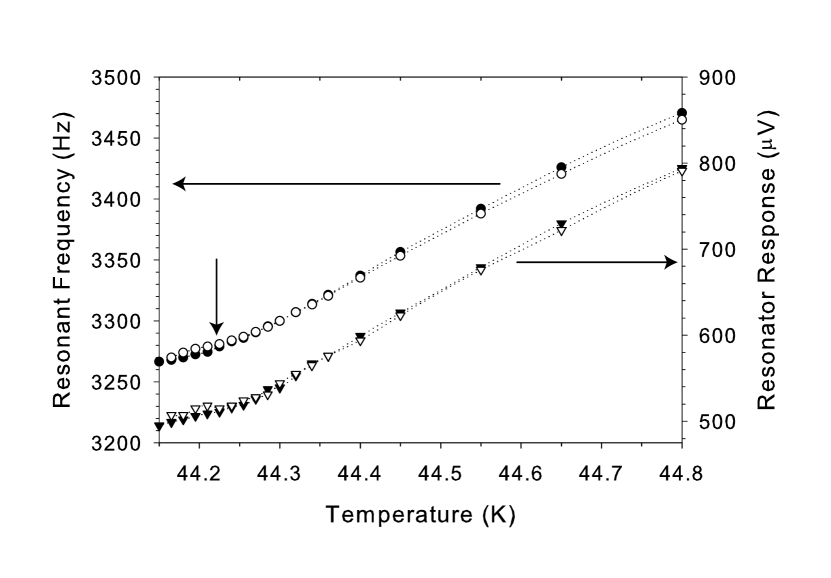
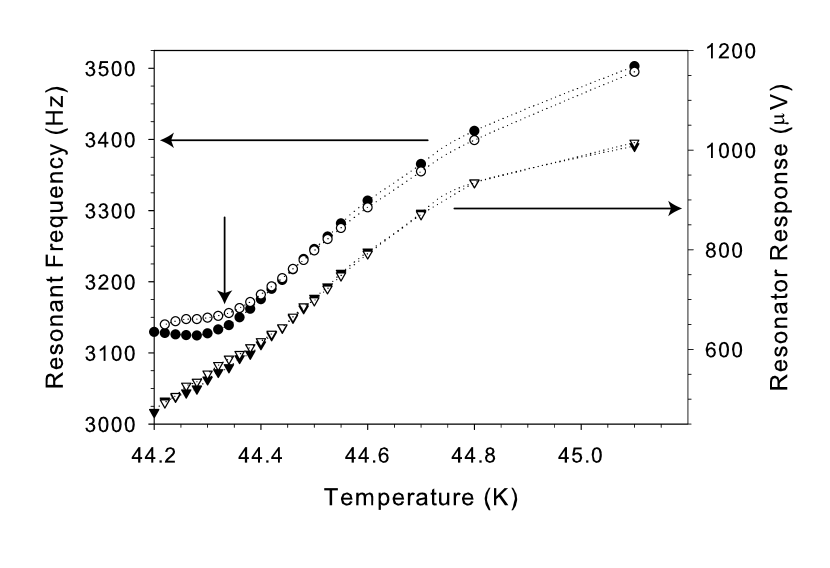
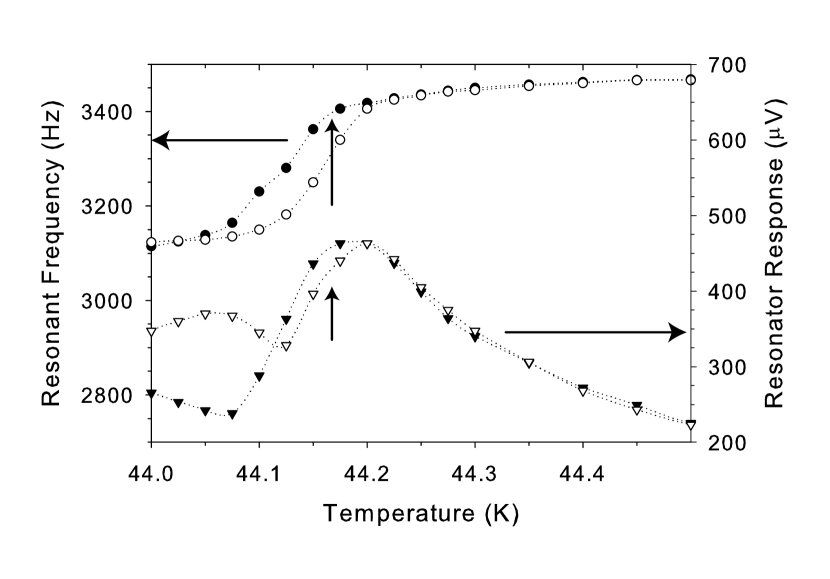
From these three representative curves one can see that no universal distinctive feature marks the liquid-vapor transition, but that signs of a transition, indicated in Figures 5-7 by vertical arrows, become more obvious as the density increases. At low neon densities (for example, Fig. 5) it is difficult to discern a feature which represents a phase transition since even hysteresis between cooling and warming runs falls below the resolution of the acoustic resonator, although the slope in frequency does change at some point. By increasing the density (shown in Fig. 6) the change of slope is more obvious, and hysteresis becomes visible. Finally, at high densities (e.g. Fig. 7) there is a significant, and sharp, change in resonant frequency at the transition. Hysteresis in these isochores indicates non-equilibrium behavior — below the liquid-vapor transition equilibration times stretched into hours so it is unclear whether this hysteresis would disappear given enough time or if it represents rate-independent behavior.
For each feature in the resonant frequency there should be a corresponding feature in the peak amplitude. At the transition one expects a sharp increase in attenuation, and consequently a sharp decrease in amplitude. In the lower density curves (Fig. 5 and Fig. 6), such a sharp decrease is not seen, although in both cases the amplitude curves reveal slight indications of a transition at the same temperature as seen in the frequency curves (i.e. change of slope or appearance of hysteresis in the peak amplitude). In the high density curve (Fig. 7) however, there is a sharp decrease in amplitude at the same temperature as the sharp drop in resonant frequency, although it is somewhat obscured because the resonance is split between the peak near 3450Hz and another at 3600Hz (not shown). This peak splitting behavior is described in more detail later, for helium in B51.
Both cooling and warming runs are plotted in the figures, and both show the liquid-vapor transition, but often at slightly different temperatures. Since the warming runs started in the two phase region where latent heat may have been released or absorbed as the temperature was changed, thermal equilibrium was not established as quickly as in the single phase system. When picking the transition temperature for each isochore the precise choice was always made using the cooling data.
The final “coexistence curve” for neon in aerogel B110 is shown in Figure 8; the three points corresponding to the isochores shown in Figures 5-7 are indicated by vertical arrows.
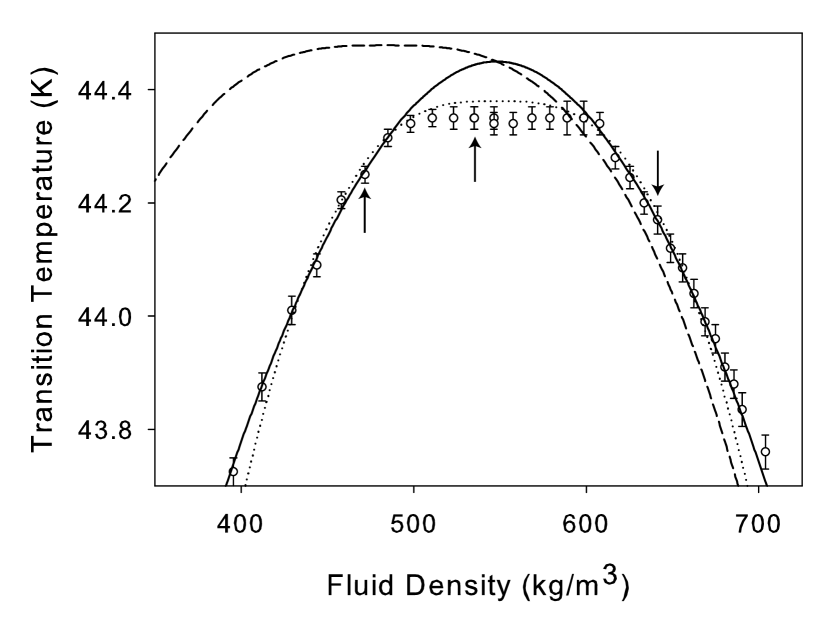
There are three important differences between the bulk neon coexistence curve (shown by the dashed line) and the data for neon in aerogel. The first is that the curve has been narrowed, the second is that the center of the curve has been shifted to higher density, and the third is that the shape of the the coexistence region seems to include a flat region in the center.
There is also a shift in transition temperature, although with the uncertainty about the calibration of the thermometer it difficult to say much about that shift other than observing that it is small. Figure 8 includes the raw data, with no adjustments made to the thermometer calibration. Our calibration appeared to be off by more than 100mK, so if the adjusted temperatures are used then the coexistence curve has only been depressed by 0.02K, or 0.05%. This very small shift is an order of magnitude smaller than the shift seen for nitrogen (0.6%) in Ref. yeung Apollo Wong (1992); Wong et al. (1993).
Without a fit to the coexistence curve a quantitative analysis of its width is not possible, however, a cursory examination of the curve indicates only slight narrowing with respect to bulk (). This narrowing is significantly less than that reported in helium but only slightly less than nitrogenyeung Apollo Wong (1992); Wong et al. (1993). The plateau seen at the top of the curve is also a new feature, but may reflect the changing nature of the transition marker rather than a fundamental change in behavior. If we do not include the data along the plateau for now, and just focus on the low and high density sides of the coexistence curve for neon in aerogel, we can evaluate the critical exponent . This would be equal to for a bulk system close to its critical point or 0.5 for a mean field transition; fits with and are included in the figure.
The fit assuming Ising behavior (i.e. ) intersects most of the data within error, but not all. The second fit, with , accommodates the data along the low and high density sides of the curve much better but does not intersect data near the center of the curve. Since the existence of a true equilibrium liquid-vapor transition for fluids in aerogel is still an open question, the power-law fits in Figure 8 are only shown to help describe the shape of the curve, not to imply a certain type of critical behavior.
III.4 Helium in Aerogel B110
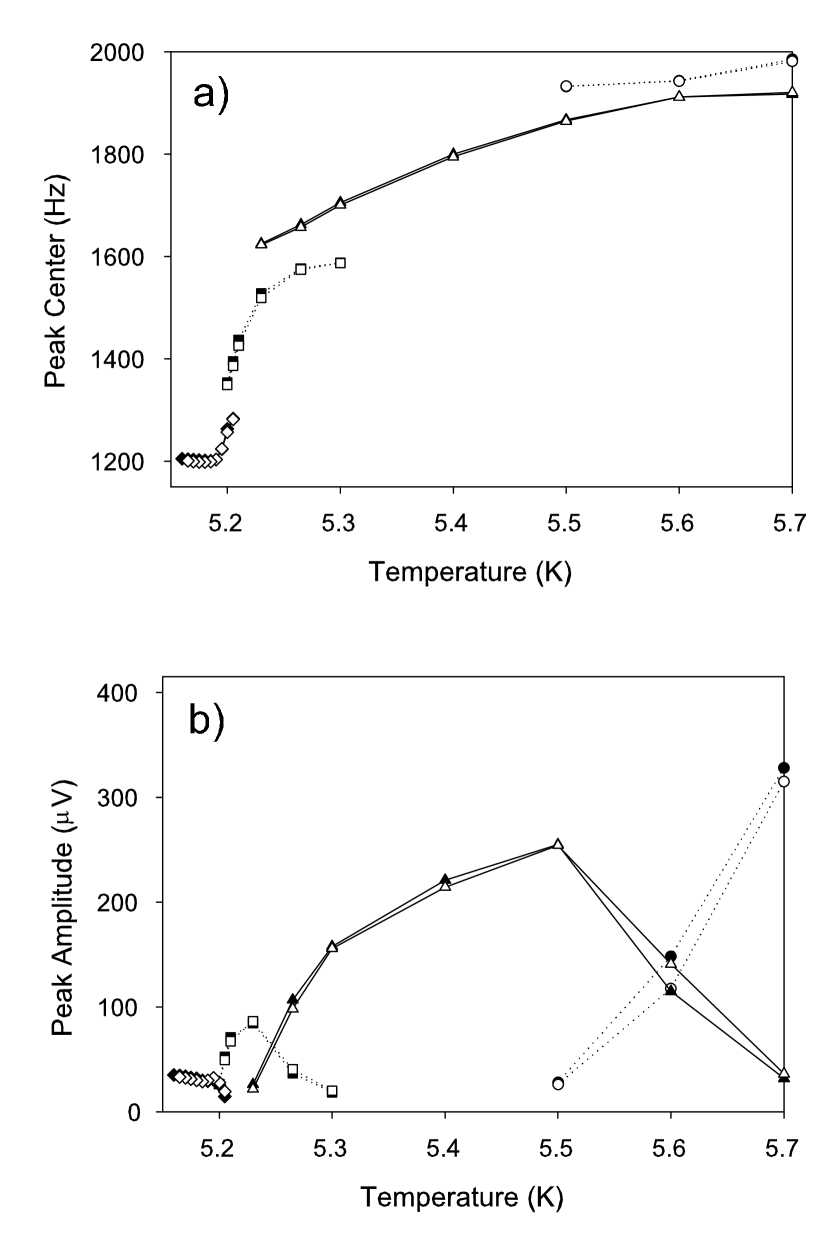
Isochores were taken with helium in a resonator filled with a second sample of aerogel B110; a typical isochore is included as Figure 9.
Again arrows link data to the corresponding axis and vertical arrows indicate the transition. Whenever the first two resonances were observable, both were analyzed; by taking advantage of this redundancy it was possible to pick out transition temperatures even if the transition was obscured along one of the resonances. Most points within this data set were collected after a 15 minute equilibration time — that was sufficient time for points above the transition to equilibrate; points below the transition did not always have time to equilibrate, leading to hysteresis at lower temperatures.
Isochores were used to construct the coexistence curve shown in Figure 10. The error bars reflect both the uncertainty in picking a transition temperature from a rounded feature and any differences in the transition temperature determined from the first and second resonant peaks.
The curve is narrowed by about a factor of about two from bulk and it is shifted toward the higher density side of the bulk helium coexistence curve. The data are too uncertain to make meaningful fits to critical exponents, but are not inconsistent with an Ising-like fit. They are also not precise enough to state confidently whether there is a plateau at the center of the curve as seen in the neon data.
III.5 Helium in Aerogel B51
The results for the resonator experiments on helium in aerogel B51 resemble those for helium in aerogel B110. However, the resonant peaks were more difficult to track, with more interference; Fig. 11 shows an example of a single spectrum. While there is a single large peak at Hz, there are also peaks at higher frequencies that are a result of interference with very low frequency modes. Rather than a single resonant frequency that moved to lower frequencies as the sample was cooled, there would usually be a number of peaks and the relative amplitudes of these peaks would vary with temperature. The resonant frequencies were generally lower than in B110, because of the lower elastic constants of the less dense aerogel, and any signal above about 5kHz was obscured by interference between lower frequency resonances.
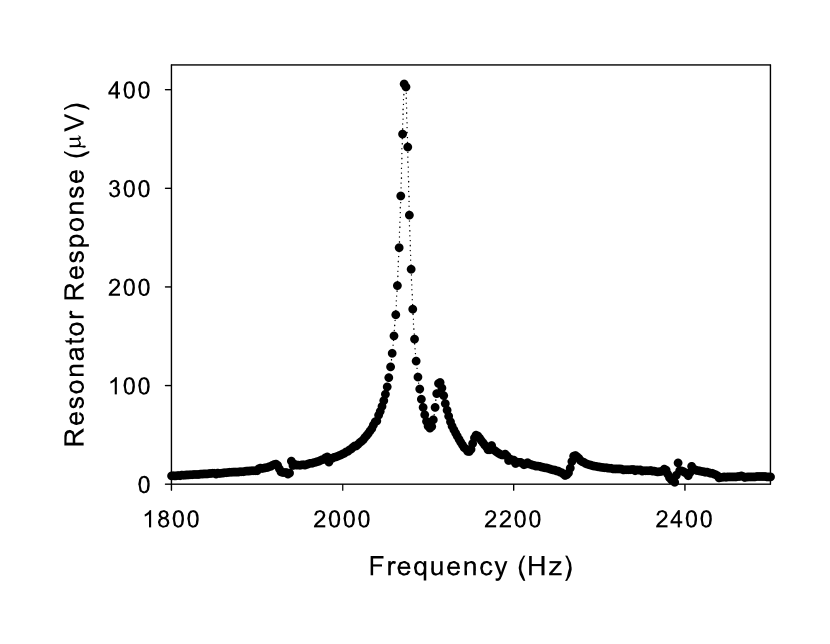
The ubiquity of the interference in this data set provides an excellent opportunity to analyze that behavior and its possible origin. There were often frequency windows in which the B51 resonator could not support a longitudinal resonance, consistent with mode crossing. There were problems with interference in both the neon and helium data sets in B110, however in neither case was the problem as severe.
The interfering modes were probably not external resonances (such as membrane resonances) since they shifted monotonically with fluid density, but exactly what internal modes were interfering is not clear.
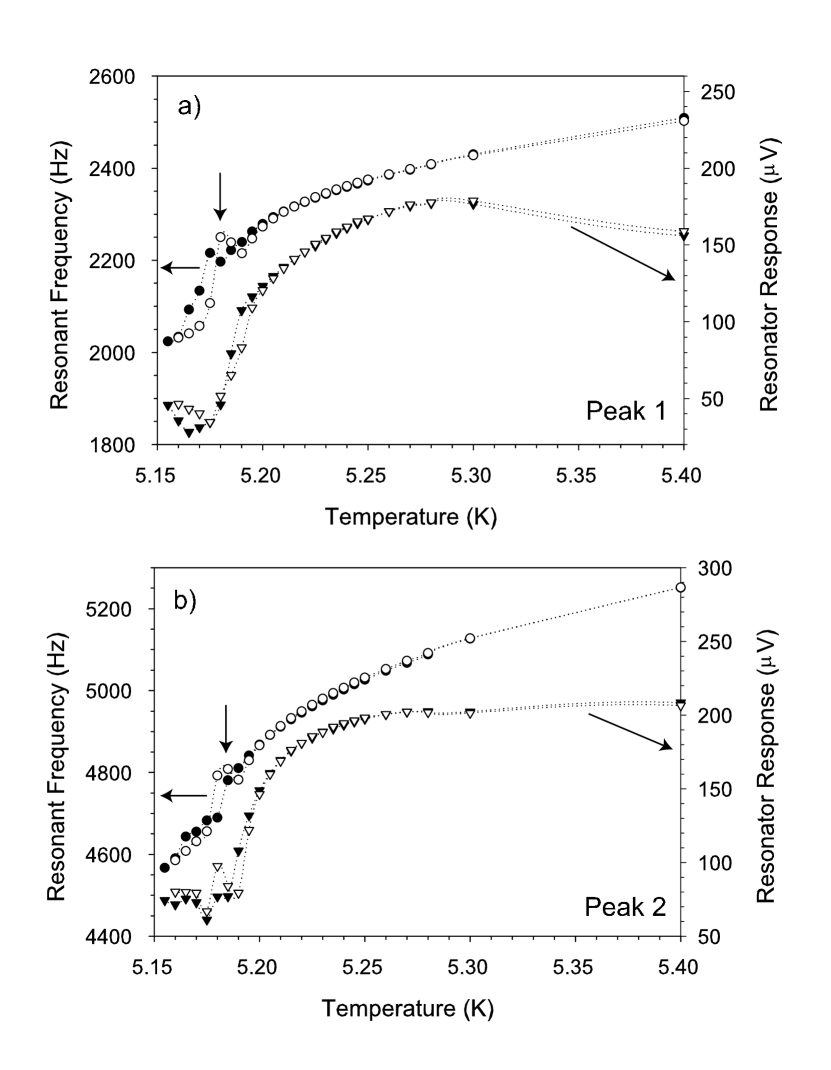
In Figure 12 a complete isochore of helium in aerogel B51 is shown to emphasize the effects of these interfering resonances. In Fig. 12a there are four distinct peak regions; as the longitudinal acoustic resonance shifts to lower frequencies (because the compressibility of the fluid is increasing as temperature falls) it encounters three frequency regions in which no peak exists. These regions, near 1300Hz, 1600Hz, and 1925Hz respectively, probably represent frequencies at which mode crossing occurred. If so, the dependence of these “forbidden” frequencies on density should give a hint as to the form of the other resonance present in the cell.
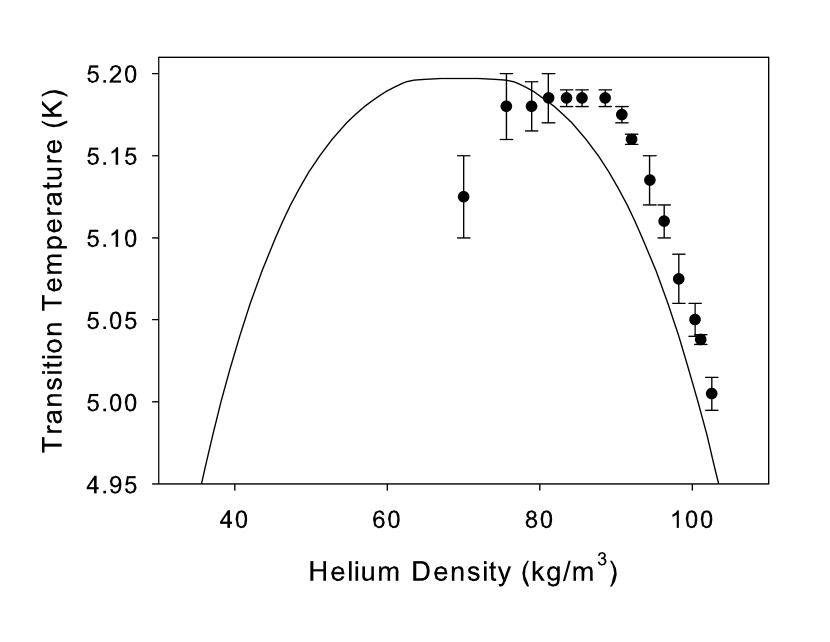
The spacing between modes () implies that they are governed by very low elastic constants; since we are already probing the lowest longitudinal acoustic mode of the aerogel-filled cavity the obvious candidates are shear modes. Using values of the shear modulus of aerogelDaughton et al. (2003), a simple torsional oscillation of a solid cylinder with dimensions similar to our aerogels should have a resonance near 1000Hz, larger than we saw but of the same order of magnitude. If we assume that the modes responsible are mostly shear in nature, then the restoring force is unaffected by the density of fluid in the cell and the frequency should be inversely proportional to the root of the system density (). In Figure 13 the frequencies of mode crossings are plotted as a function of system density (i.e. the sum of the densities of the fluid and the aerogel).
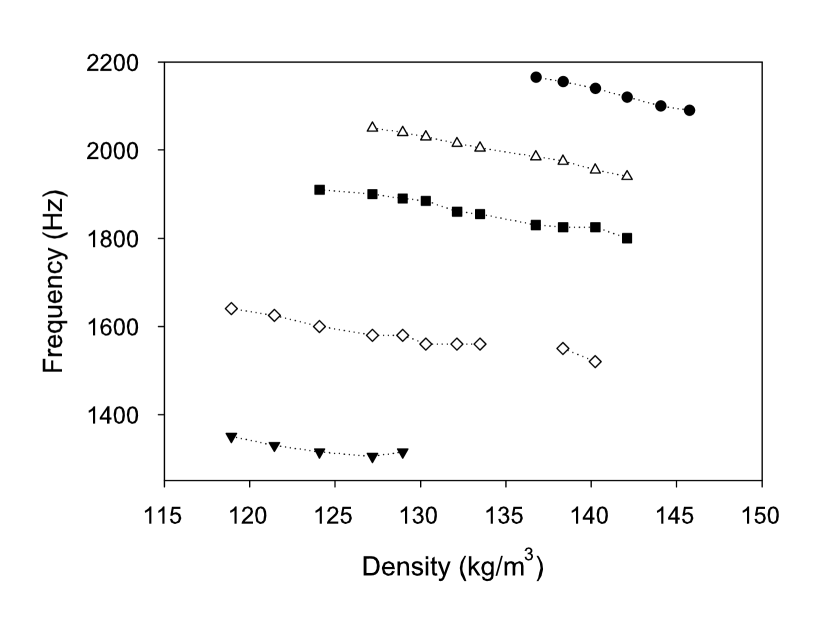
The density dependence of the interfering modes is consistent with them being mostly shear in character, although with the current data set there is no way to state with confidence what the form of these resonances actually was. The large number of modes wreaks havoc with choosing transition temperatures from the isochores; while in the isochores in aerogel B110 there were a couple of regions of density where the transition was obscured, in aerogel B51 every isochore shows at least some evidence of mode crossing near the transition.
Other than the increased interference, the form of the isochores was the same as in aerogel B110 and no single feature presented itself as an obvious marker of a transition. Some isochores showed obvious hysteresis, due in part to slow equilibration below the transition — in such cases the cooling data were taken as being closest to equilibrium near the transition. Since the form of the isochores has already been shown, no additional isochores are shown for this sample, but the “coexistence curve” for helium in aerogel B51 extracted from the resonator isochores is shown in Figure 14.
The lack of low density points along the curve is due to the lack of distinct markers for any sort of transition along the low density isochores. Subtle changes in slope of the isochore which could be used in the B110 resonator isochores were swamped by interference or mode crossing in the B51 resonator. The curve is only well defined on the high density side, although the lowest density point may indicate that the transition temperature is starting to move to lower values. This would imply that the low density branch of the curve was shifted significantly from the bulk curve, but not as much as in helium in aerogel B110; certainly the curve is wider than in B110. The lack of a clear marker for the transition on the low density side is consistent with results from the other resonators, and with the gradual transition seen on the low density side of adsorption isothermsHerman et al. (2005a). No attempts to fit the curve to critical exponents have been made.
IV Conclusions/Discussion
In this study a set of low frequency acoustic experiments were undertaken to study the liquid-vapor transition of fluids near their critical points in silica aerogel. This technique is capable of pinpointing the onset of liquid-vapor coexistence along isochores in bulk fluids but the presence of an aerogel complicated the resonance modes and made the transition less obvious. The transitions were not as sharp as for bulk fluids, particularly on the low density “vapor” branch. Phase separation was accompanied by hysteresis and long time constants, behavior consistent with that seen in adsorption isotherm studies of fluids in aerogels. Nonetheless, by following isochores and looking at the dissipation and the frequencies of fundamental and higher resonance modes, we were able to find markers of phase separation and map out “coexistence curves” for neon and for helium in two different aerogels. Ambiguities about which features to include in a “coexistence curve” are common to most studies of liquid-vapor behavior in porous media but such curves allow a quick comparison to other experiments and to bulk fluid behavior. However, it is important to remember that curves based on the appearance of hysteresis or other transition markers may not represent a macroscopic phase transition with equilibrium coexistence between liquid and vapor-like phases. We will therefore only make qualitative comparisons to the results of other experiments.
Previous measurementsWong and Chan (1990); Wong et al. (1993); Gabay et al. (2000a) of liquid-vapor behavior have been made using aerogels with similar density to our sample B110 (, 95% porosity). Gabay et al. Gabay (2001); Gabay et al. (2000a) used a mechanical oscillator to measure the helium density while isothermally flowing helium at different rates into or out of their aerogel. They observed hysteresis even quite close to the LVCP and found no evidence for an equilibrium liquid-vapor transition. Wong and Chan, on the other hand, saw qualitatively different behavior Wong and Chan (1990). They measured heat capacity along isochores, following similar thermodynamic paths to the resonance measurements in this paper, and found an extremely narrow coexistence curve near the LVCP, with the liquid branch shifted to lower density than bulk liquid. They supplemented these measurements with several adsorption isotherms which were consistent with liquid-vapor coexistence, and reported no hysteresis.
Our measurements in aerogel B110 are consistent with the behavior seen by Gabay et al. and with our own isotherm measurementsHerman et al. (2005a). We see hysteresis below the liquid-vapor transition and a coexistence curve which is somewhat narrower than for bulk fluids and shifted to higher densities. As one might expect, the higher porosity aerogel B51 has a less pronounced effect, with a high density liquid branch which is quite close to that in bulk helium. Since the transition markers were very subtle at low densities, it was not possible to map out the vapor branch over a sufficiently wide range to make quantitative statements about the widths of the coexistence regions for helium. However, we do not see any evidence for the extremely narrow coexistence curve reported in Ref. Wong and Chan (1990), even though we used similar samples and thermodynamic paths. It is possible that the long thermal time constants we observed in these and our earlier isotherm studies affected the heat capacity results. In AC heat capacity measurements only a thin layer of helium near the surface of the sample would respond, even at a heater frequency as low as 0.1 Hz, in contrast to acoustic resonances where adiabatic compression probes the entire sample.
Mean field simulations of liquid-vapor behavior in porous media show a “hysteresis phase diagram” (analogous to a coexistence curve) with a width that depends on the “wettability” , the ratio between the strengths of the adsorbate-substrate (fluid-solid) and adsorbate-adsorbate (fluid-fluid) attractive interactions, and . As y increases, the coexistence region becomes narrower. Although the simulations are coarse-grained, so y cannot be computed directly from van der Waals interactions, it can still be varied by choosing different fluids. One measure of the adsorbate-substrate attraction is the coefficient of the long-range d-3 van der Waals potential between a fluid atom and a glass surface (1100 and 1640 KÅ3 for helium and neon respectivelyCheng and Cole (1988)). The fluid-fluid interaction is reflected in properties such as surface tension (0.3 and 6 for helium and neon respectively at low temperatureLemmon et al. (2003)) and the latent heat of vaporization, (2.6 and 103 for helium and neon respectively). If we characterize fluids by the ratio , we expect helium to have a much larger wettability than neon ( about 27 times larger). Nitrogen, for comparison, has a ratio close to that of neon. Our neon coexistence curve in Fig. 8 does have a width similar to that seen by Wong et al. in their light scattering experimentsWong et al. (1993) with nitrogen. However, although the helium coexistence curve in Fig. 10 appears to be narrower than that for neon, the difference is not as large as would be expected from the simulations given the large difference between the wettability of neon and helium.
The neon measurements presented in this paper are the most detailed and precise that we have made. However, it is not clear that the transitions we saw correspond to true liquid-vapor equilibrium, so we have not attempted to extract critical exponents from the data near the LVCP. As Fig. 8 shows, the shape of the curve is roughly consistent with an Ising-like fit over the entire density range, but could also be fit with a mean-field exponent except for the flat plateau region near the critical density.
Our acoustic resonance experiments provide information about liquid-vapor behavior in aerogels, to complement that available from recent adsorption isotherm measurements. The behavior is consistent with the isotherm results, with a relatively sharp transition on the high density side of the “coexistence curves” but more gradual changes on the low density side. This, together with the hysteresis we usually observed below the transitions, makes it impossible to unambiguously define a coexistence curve or even to be sure we can access the equilibrium states that would be required for a true equilibrium phase transition. The observed behavior was similar for helium and neon, despite their different interaction strengths. The lower density aerogel had a smaller effect on helium’s coexistence curve, but the general features of the transition were the same. Despite their tenuous nature, it does not appear that aerogels behave as a simple dilute impurity which can be used to study the equilibrium liquid-vapor critical behavior in the presence of disorder. The observed hysteresis indicates the importance of metastable states and suggests that a description in terms of capillary condensation is more appropriate.
References
- Zassenhaus and Reppy (1999) G. M. Zassenhaus and J. D. Reppy, Physical Review Letters 83, 4800 (1999).
- Murphy and Reppy (1990) S. Q. Murphy and J. D. Reppy, Physica B 165, 547 (1990).
- Crowell et al. (1997) P. A. Crowell, F. W. V. Keuls, and J. D. Reppy, Physical Review B 55, 12620 (1997).
- Yoon et al. (1998) J. Yoon, D. Sergatskov, J. Ma, N. Mulders, and M. H. W. Chan, Physical Review Letters 80, 1461 (1998).
- Chan et al. (1988) M. H. W. Chan, K. I. Blum, S. Q. Murphy, G. K. S. Wong, and J. D. Reppy, Physical Review Letters 61, 1950 (1988).
- Porto and Parpia (1999) J. V. Porto and J. M. Parpia, Physical Review B 59, 14583 (1999).
- Matsumoto et al. (1997) K. Matsumoto, J. V. Porto, L. Pollack, E. N. Smith, T. L. Ho, and J. M. Parpia, Physical Review Letters 79, 253 (1997).
- Chan et al. (1996) M. H. W. Chan, N. Mulders, and J. D. Reppy, Physics Today 49, 30 (1996).
- Mulders and Chan (1995) N. Mulders and M. H. W. Chan, Physical Review Letters 75, 3705 (1995).
- Kim et al. (1993) S. B. Kim, J. Ma, and M. H. W. Chan, Physical Review Letters 71, 2268 (1993).
- de Gennes (1984) P. G. de Gennes, Journal of Physical Chemistry 88, 6469 (1984).
- Brochard and de Gennes (1983) F. Brochard and P. G. de Gennes, Journal de Physique - Lettres 44, L785 (1983).
- Goh et al. (1987) M. C. Goh, W. I. Goldburg, and C. M. Knobler, Physical Review Letters 58, 1008 (1987).
- Monette et al. (1992) L. Monette, A. J. Liu, and G. S. Grest, Physical Review A 46, 7664 (1992).
- Lin et al. (1994) M. Y. Lin, S. K. Sinha, J. M. Drake, X. I. Wu, P. Thiyagarajan, and H. B. Stanley, Physical Review Letters 72, 2207 (1994).
- Frisken et al. (1995) B. J. Frisken, D. S. Cannell, M. Y. Lin, and S. K. Sinha, Physical Review E 51, 5866 (1995).
- Valiullin and Furo (2002) R. Valiullin and I. Furo, Journal of Chemical Physics 116, 1072 (2002).
- Machin (1999) W. D. Machin, Langmuir 15, 169 (1999).
- Thommes and Findenegg (1994) M. Thommes and G. Findenegg, Langmuir 10, 4270 (1994).
- Thommes et al. (1995) M. Thommes, G. H. Findenegg, and M. Schoen, Langmuir 11, 2137 (1995).
- Wong and Chan (1990) A. P. Y. Wong and M. H. W. Chan, Physical Review Letters 65, 2567 (1990).
- Wong et al. (1993) A. P. Y. Wong, S. B. Kim, W. I. Goldburg, and M. H. W. Chan, Physical Review Letters 70, 954 (1993).
- Gabay et al. (2000a) C. Gabay, F. Despetis, P. E. Wolf, and L. Puech, Journal of Low Temperature Physics 121, 585 (2000a).
- Gabay et al. (2000b) C. Gabay, P. E. Wolf, and L. Puech, Physica B 284, 99 (2000b).
- Herman and Beamish (2002) T. Herman and J. Beamish, Journal of Low Temperature Physics 126, 661 (2002).
- Herman and Beamish (2003) T. Herman and J. Beamish, Physica B 329, 431 (2003).
- Tan and Beamish (2000) H. W. Tan and J. Beamish, Physica B 284, 389 (2000).
- Melnichenko et al. (2004) Y. B. Melnichenko, G. D. Wignall, D. R. Cole, and H. Frielinghaus, Physical Review E 69, 057102 (2004).
- Beamish and Herman (2003) J. Beamish and T. Herman, Physica B 329, 340 (2003).
- Beamish and Herman (2004) J. R. Beamish and T. Herman, Journal of Low Temperature Physics 134, 339 (2004).
- Herman (2005) T. Herman, Ph.D. thesis, University of Alberta (2005).
- Herman et al. (2005a) T. Herman, J. Day, and J. Beamish, arXiv:physics.cond-mat/0505430 (2005a).
- Krakoviack et al. (2001) V. Krakoviack, E. Kierlik, M. Rosinberg, and G. Tarjus, Journal of Chemical Physics 115, 11289 (2001).
- Golov et al. (1999) A. Golov, D. A. Geller, J. M. Parpia, and N. Mulders, Physical Review Letters 82, 3492 (1999).
- Lawes et al. (2003) G. Lawes, A. Golov, E. Nazaretski, N. Mulders, and J. Parpia, Physical Review Letters 90, 195301 (2003).
- Thoen and Garland (1974) J. Thoen and C. W. Garland, Physical Review A 10, 1311 (1974).
- Colgate et al. (1990) S. O. Colgate, A. Sivaraman, C. Dejsupa, and K. C. McGill, Review of Scientific Instruments 62, 198 (1990).
- Biot (1956a) M. A. Biot, The Journal of the Acoustical Society of America 28, 168 (1956a).
- Biot (1956b) M. A. Biot, The Journal of the Acoustical Society of America 28, 179 (1956b).
- Forest et al. (1998) L. Forest, V. Gibiat, and T. Woignier, Journal of Non-Crystalline Solids 225, 287 (1998).
- Poelz and Riethmüller (1982) G. Poelz and R. Riethmüller, Nuclear Instruments and Methods 195, 491 (1982).
- Herman et al. (2005b) T. Herman, J. Day, and J. Beamish, To be published (2005b).
- Pestak and Chan (1984) M. W. Pestak and M. H. W. Chan, Physical Review B 30, 274 (1984).
- yeung Apollo Wong (1992) P. yeung Apollo Wong, Ph.D. thesis, The Pennsylvania State University (1992).
- Lemmon et al. (2003) E. W. Lemmon, M. O. McLinden, and D. G. Friend, in NIST Chemistry WebBook, NIST Standard Reference Database Number 69, edited by P. J. Linstrom and W. G. Mallard (National Institute of Standards and Technology, Gaithersburg MD, 20899 (http://webbook.nist.gov), 2003).
- Daughton et al. (2003) D. R. Daughton, J. MacDonald, and N. Mulders, Physica B 329-333, 1233 (2003).
- Gabay (2001) C. Gabay, Ph.D. thesis, CNRS - Grenoble (2001).
- Cheng and Cole (1988) E. Cheng and M. W. Cole, Physical Review B 38, 987 (1988).