Magnetic field-induced quantum critical point in YbPtIn and YbPt0.98In single crystals
Abstract
Detailed anisotropic (Hab and Hc) resistivity and specific heat measurements were performed on online-grown YbPtIn and solution-grown YbPt0.98In single crystals for temperatures down to 0.4 K, and fields up to 140 kG; Hab Hall resistivity was also measured on the YbPt0.98In system for the same temperature and field ranges. All these measurements indicate that the small change in stoichiometry between the two compounds drastically affects their ordering temperatures (T K in YbPtIn, and K in YbPt0.98In). Furthermore, a field-induced quantum critical point is apparent in each of these heavy fermion systems, with the corresponding critical field values of YbPt0.98In (H around 35-45 kG and H kG) also reduced compared to the analogous values for YbPtIn (H kG and H kG).
pacs:
75.20.Hr; 75.30.-m; 75.30.Mb; 75.47.-mI Introduction
In recent years, stoichiometric Yb-based heavy fermion compounds have raised a lot of interest, particularly due to the limited number of such systems known to date. YbPtIn is one of the few examples of such heavy fermion systemstro09 ; kac10 ; yos11 , as indicated by measurements performed on single crystal samples extracted from on-line melts of the polycrystalline material. Based on the existing datatro09 ; kac10 , YbPtIn has a relatively low magnetic ordering temperature (T K) and an enhanced electronic specific heat coefficient ( mJmol K2), whereas the magnetic entropy at Tord amounts to only about 60 of the value expected for a doublet ground state. In light of these observations, this system appears to be qualitatively similar to the other recently studied Yb-based heavy fermion antiferromagnets, YbRh2Si2tro05 ; geg06 ; ish07 ; pas08 ; pas09 , and YbAgGebey27 ; kat28 ; mor05 ; bud11 ; bud12 , the latter compound being isostructural to YbPtIn. In YbRh2Si2, magnetic order occurring at very low temperature (below 70 mK)tro05 was associated with a low entropy release (around 0.01 )geg06 . For the YbAgGemor05 ; bud11 compound, the temperature associated with the magnetically ordered state, whereas still fairly low ( K), is enhanced compared to that of YbRh2Si2; also, the magnetic entropy at the ordering temperature is larger than in YbRh2Si2, but still less than 10 of . Thus these two compounds can be regarded as systems with small moment ordering. Having an even higher ordering temperature and magnetic entropy at Tord, YbPtIn seemed a good candidate to further study a progression from small moment to reduced moment ordering, in stoichiometric Yb-based heavy fermion compounds, with field-induced quantum critical point.
In contrast to a classical phase transition at finite temperatures, driven by temperature as a control parameter with thermal fluctuations, a quantum phase transition is driven by a control parameter C other than temperature (e.g., C = pressure, doping or magnetic field) at T = 0, with quantum mechanical fluctuations. Such a control parameter tunes the system from a magnetically ordered state towards a state without magnetic order, at zero temperature, crossing a quantum critical point. Due to the hybridization of the 4f electrons and the conduction electrons in heavy fermion (HF) systems, which can be modified by any one of the aforementioned C control parameters, the (HF) compounds are very suitable to study quantum critical behavior. Moreover, close to the critical value Ccrit which drives the ordering temperature close to zero, pronounced deviations from the Fermi liquid-like FL behavior can occur. This has been observed in a large number of HF systems where C = doping or pressure, and only a few doped systems have been field-tuned through a QCPste2001 . To date, YbRh2Si2tro05 ; geg06 ; ish07 ; pas09 and YbAgGekat28 ; bud11 ; bud12 are the only stoichiometric Yb-based HF compounds in which a field-induced quantum critical point QCP has been observed. The heavy fermion character of the YbPtIn system has already been reportedtro09 ; kac10 ; in this paper we will discuss the existence of a field-induced QCP in YbPtIn which renders it very similar to the other two stoichiometric, Yb-based heavy fermions.
Recently we presented anisotropic low-field susceptibility measurements, as well as specific heat data in zero applied field, on solution-grown single crystals of the RPtIn series, including YbPtInmor10 . No features indicative of magnetic order could be identified in our magnetization measurements on single crystals of the R = Yb compound, down to T 2 K. However, a well-defined peak at K in the zero-field specific heat data suggests that this compound orders magnetically below 2.1 K, just above the low temperature limit of our magnetization measurements. As we will present in this paper, detailed transport and thermodynamic measurements down to 0.4 K not only confirm the magnetic ordering in this compound below 2.1 K, but also suggest that another phase transition might exist in this system around 1 K.
However, our measurements were in part inconsistent with previous reports on YbPtIn single crystals: whereas Kaczorowski et al.kac10 have also presented magnetization data showing no features associated with magnetic ordering above 1.7 K, in their specific heat measurements three anomalies can be observed (at 3.1, 2.3, and 1.2 K), all at slightly different temperatures than in our data. Furthermore, the low-field susceptibility data presented by Trovarelli et al.tro09 are consistent with an ordering temperature around 3.4 K, also confirmed by their resistivity and specific heat measurements.
In order to address these apparent discrepancies between our data on solution grown single crystals and the two previous reports on on-line grown single crystalstro09 ; kac10 , we reproduced the growth as described by Trovarelli et al.tro09 . The anisotropic specific heat and transport measurements on our single crystals extracted from the melt confirmed the existence of magnetic phase transitions at 3.4 K and 1.4 K, as observed previously.
In this paper we will try to examine the differences between solution and on-line grown single crystals, given that a small Pt-deficiency occurred in the former types of crystals, leading to a stoichiometry closest to YbPt0.98In, and no disorder could be detected in the on-line grown crystals. Also, given that heavy fermion compounds with small moment ordering are likely to be driven to a quantum critical point QCP by disorder or applied field, we will study the evolution of both YbPt0.98In and YbPtIn towards a field-induced QCP. Detailed anisotropic measurements of specific heat and resistivity on the two types of crystals, for fields up to 140 kG and temperatures down to 0.4 K, will be used for the comparison between the two types of crystals. Additional Hall effect measurements were performed on the solution grown single crystals for the same temperature and field ranges, allowing us to further explore the effects of the QCP in this compound.
After briefly describing the methods used for synthesizing the two types of YbPtIn single crystals, and the measurement techniques used for the sample characterization, we will present the results of single crystal x-ray diffraction. Next we will compare the low field data for the two types of compounds, pointing out the similarities, as well as the significant differences in their physical properties. Next we will present the higher field data for both types of crystals, for and . This will allow us to follow, in both systems, the progression from reduced magnetic moment order to the quantum critical point QCP, as driven by the application of increasing magnetic field. Also, we will extend the zero-field comparison between the two YbPtIn systems to their field- dependent properties, and will try to identify common features as well as possible effects of the site deficiency.
II Experimental methods
YbPtIn is one of the RPtIn compounds, reported to crystallize in ZrNiAl hexagonal structurekac10 ; mor10 , space group P. Single crystals of this compound were obtained by two methods: from high-temperature ternary solution, as described in Ref. [15], and from stoichiometric on-line melttro09 . The initial concentration used for the solution growth was Yb0.4Pt0.1In0.5, and the ternary solution, sealed in a 3-cap Ta cruciblecan17 under partial argon pressure, was slow-cooled from 12000 C to 10000 C over approximately 100 hours. Subsequently, the excess liquid solution was decanted, and the resulting hexagonal rods were briefly etched in HCl to remove residual flux from the surface. For the on-line melt, 1:1:1 atomic ratios of Yb, Pt and In were sealed in a Ta crucible under partial argon atmosphere. After briefly heating the sealed crucible up to approximately 16500 C in an induction furnace, the crucible was sealed in a quartz ampoulle and annealed at 7000 C for 120 hours. Small rods were subsequently extracted from the resulting crystalline conglomerate.
Anisotropic magnetization measurements as a function of temperature and applied field M(H,T) were performed in a Quantum Design MPMS SQUID magnetometer (T K, H kG). Temperature- and field-dependent specific heat CP(H,T), resistivity (H,T) and Hall resistivity (H,T) measurements were taken in a Quantum Design PPMS-14 instrument with He-3 option, for temperatures down to 0.4 K, and applied magnetic fields between 0 and 140 kG. For the anisotropic (i.e., or ) specific heat measurements a relaxation technique with fitting of the whole calorimeter (sample with sample platform and puck) was used. The sample platform and grease background, measured separately for all necessary (H,T) values, was subtracted from the sample response. Also, the non-magnetic contribution to the total specific heat was estimated based on measurements on flux-grown LuPtIn, used as the non-magnetic analogue of YbPtIn. The single crystals of LuPtIn were grown using similar initial composition (R0.05Pt0.05In0.90) and temperature profile (slow cooling from 11900C to 8000C over 100 hours) that yielded fully-occupied RPtIn single crystals for the lighter members of the seriesmor10 . We therefore anticipate that the LuPtIn crystals are also fully-occupied, and we used this system as the non-magnetic analogue for our both Yb compounds. It should be noted that we made the assumption that the non-magnetic background is insensitive to the 2 Pt-deficiency in the solution-grown compound. The specific heat for LuPtIn was measured in the same temperature range as for YbPtIn and YbPt0.98In, for 0 and 140 kG applied field, and was found to be virtually field-independent over the measured temperature range.
A standard AC four-probe resistance technique ( Hz, mA) was used for the field- and temperature-dependent resistivity measurements. Given the rod-like geometry of the samples, the current was always flowing along the crystallographic c-axis, whereas the field was either parallel (for longitudinal magnetoresistance), or perpendicular (for transverse magnetoresistance) to the direction of current flow. The Hall resistivity measurements were performed on a sample that was polished down to a plate-like shape. This sample geometry restricted the Hall resistivity measurements to the field applied within the hexagonal crystallographic plane (). The Hall resistivity (H,T) was measured for field perpendicular to both the current and the Hall voltage directions. In order to minimize the inherent (small) misalignment of the voltage contacts, these measurements were taken for two opposite directions of the applied field, H and -H, and the odd component, ((H) - (-H)) was taken as the Hall resistivity.
For each of the two systems (YbPtIn and YbPt0.98In), we will compare the similar data for the the two orientations of the applied field (i.e., for and ), as well as the resulting T - H phase diagrams. The criteria used for determining the points on all presented phase diagrams will be discussed in more detail in the appropriate sections, but in general they were maxima in the CP(H,T) data, and derivative maxima or onset values for the transport data. For , the maximum temperature for which the could be fit to a straight line was the criterium used in determining the upper limit of this Fermi liquid-like region. Additional Hall resistivity measurements were performed for the field applied within the basal plane, for the YbPt0.98In (flux-grown) compound. Various criteria were used for determining critical points similar to the Hall line for the YbRh2Si2pas09 and YbAgGebud12 systems.
III Results
III.1 Crystal structure
For both solution and on-line grown crystals, the crystal structure was confirmed by powder x-ray diffraction, with no detectable impurity peaks. However, additional single crystal x-ray measurements were performed on the two types of YbPtIn compounds. Crystals with dimensions and were extracted from the flux and on-line grown samples respectively. Room-temperature X-ray diffraction data were collected on a STOE IPDSII image plate diffractometer with Mo K radiation, and were recorded by taking scans in in the full reciprocal sphere. The range of 2 extended from to . Numerical absorption corrections for both crystals were based on crystal face indexing, followed by a crystal shape optimization. Structure solution and refinement were done using the SHELXTL program. The crystallographic and structural data are summarized in Tables 1 - 2.
| Occupancy | x | y | z | U(eq) | |
| Yb | 1.00 | 0.5940(1) | 0 | 0 | 0.0088(3) |
| Pt(1) | 0.94(1) | 0 | 0 | 0 | 0.0099(5) |
| Pt(2) | 1.00 | 1/3 | 2/3 | 1/2 | 0.0075(3) |
| In | 1.00 | 0.2604(2) | 0 | 1/2 | 0.0093(4) |
| Occupancy | x | y | z | U(eq) | |
| Yb | 1.00 | 0.4052(1) | 0 | 0 | 0.0076(2) |
| Pt(1) | 0.986(9) | 0 | 0 | 0 | 0.0082(4) |
| Pt(2) | 1.00 | 1/3 | 2/3 | 1/2 | 0.0071(2) |
| In | 1.00 | 0.7378(2) | 0 | 1/2 | 0.0071(2) |
A high temperature factor was inferred for Pt(1) of the flux-grown crystal during final stages of the refinement, which is usually indicative of possible atomic deficiencies, symmetry reduction or superstructure formation. No superstructure reflections were observed, and symmetry reduction did not resolve the issue. However, relaxing Pt(1) site occupancy resulted in a statistically significant deficiency (0.06(1), Table 1), and led to improvements in the Pt(1) temperature factor and overall residual R value. We also tested for possible deficiencies on the other atomic sites in this crystal, but refined occupancies for Yb (1.00(6)), Pt(2) (1.00(6)) and In (1.02(2)) did not suggest presence of atomic deficiencies. Thus the composition of the flux-grown crystal can be written as YbPt0.98In, noting that the Pt0.98 value reflects the Pt stoichiometry of the whole unit cell, not just of the Pt(1) site. In contrast to the flux-grown sample, the Pt(1) temperature factor of the on-line grown crystal had a reasonable value. Relaxing the Pt(1) occupancy yielded only a slight and statistically insignificant deficiency of 0.014(9) (Table 2). Occupancy refinement for other atomic sites showed no deviations from unity. Although small deficiencies on the Pt(1) site could not be excluded, the YbPtIn formula is a good presentation of the composition of the on-line crystal in terms of sensitivity of our X-ray diffraction experiments. This difference in the stoichiometry of the solution and on-line grown samples is consistent with YbPtIn having a small width of formation extending towards the Pt-deficient side; given that the initial melt composition is very Pt-poor (i.e., Yb0.4Pt0.1In0.5), it is expected to be sensitive to such a small width of formation.
A closer look at the atoms’ positions given in Tables 1-2 suggests that two compounds might be mirror images of each other; whereas racemic twinning could not be excluded for either the solution or the on-line grown compounds, no evidence of the existence of both ”left” and ”right” structures in each system could be found.
The lattice parameters and unit cell volume for the solution-grown, YbPt0.98In crystals were Å, Å and Å3. The analogous unit cell dimensions on the on-line grown crystals were slightly smaller: Å, Å and Å3.
III.2 Low magnetic field comparison
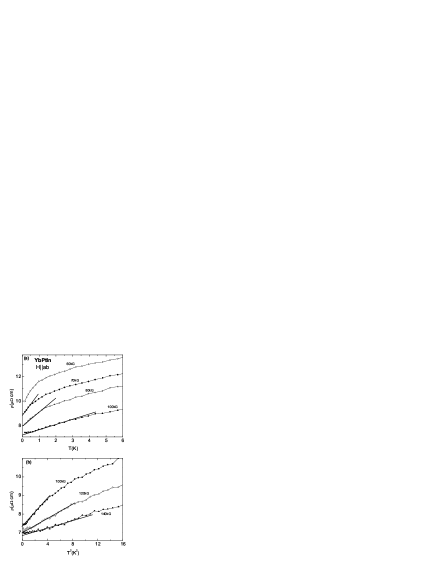
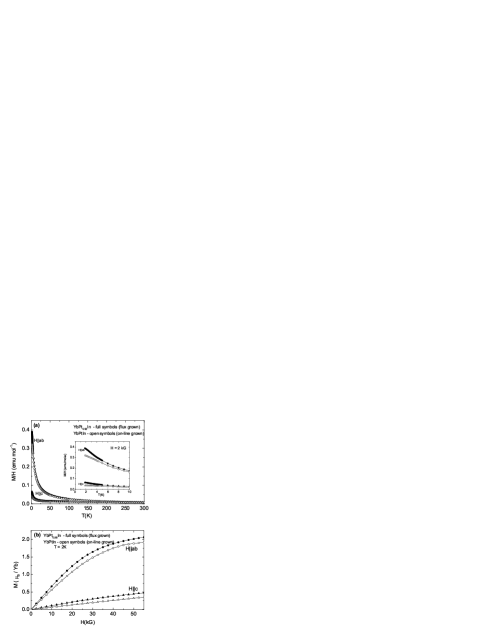
Anisotropic magnetization measurements are presented in Fig.1 for both the YbPt0.98In (full symbols) and the YbPtIn (open symbols) compounds. As can be observed in Fig.1a, the paramagnetic susceptibility indicates moderate anisotropy for both systems (with at the lowest temperature), and no clear sign of magnetic ordering down to K. The anisotropic M(H) isotherms show a continuous increase of the magnetization, with a trend towards saturation above 40 kG (Fig.1b) for H applied within the ab-plane; the axial magnetization remains linear and significantly smaller than Mab up to our maximum field available for these measurements (55 kG). Whereas qualitatively there is an overall similarity between the corresponding data of the two compounds, the absolute values of both susceptibility and field-dependent magnetization are slightly larger for YbPt0.98In than for YbPtIn. We believe the 10 to 20 difference to be too large to have been caused by weighing errors alone, and thus we conclude that it may reflect the different Kondo temperatures and exchange coupling due to the change of stoichiometry in the two compounds.
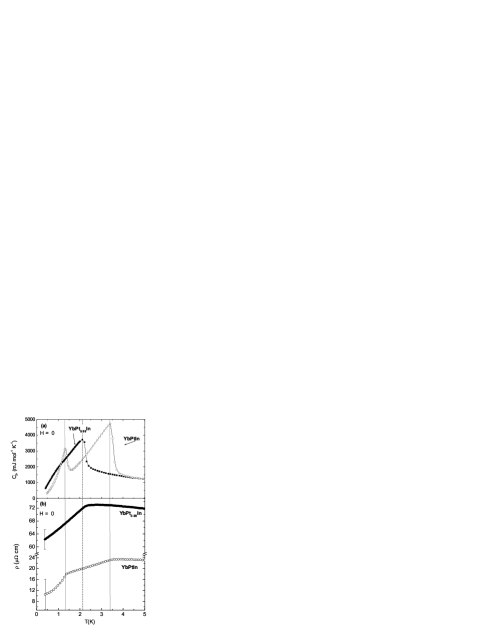
The zero-field specific heat and resistivity data shown in Fig.2 are consistent with magnetic ordering in both compounds, however at different temperatures: two well defined peaks at T K and 1.4 K are visible in the YbPtIn CP(T) data (open symbols, Fig.2a), whereas only one peak can be distinguished, around 2 K, in the YbPt0.98In data (full symbols). These transition temperatures are marked by the vertical dotted lines for the former compound, and by one dashed line for the latter. It can be seen that the corresponding resistivity measurements (Fig.2b) show changes in slope around the respective transition temperatures. Another noticeable difference between YbPtIn and YbPt0.98In manifests in the resistivity values (Fig.2b and 3) with the ones for the former compound being approximately three times smaller in the latter one. The error bars shown for the lowest temperature values give a caliper of the uncertainty in estimating the resistivity values for the two compounds, further confirming the aforementioned difference. The larger residual resistivity in YbPt0.98In is consistent with the additional disorder (i.e., site disorder) or presence of additional vacancies in this type of crystals.
Thus the zero-field measurements indicate a dramatic effect of the small Pt-deficiency on the ordered state in YbPtIn: the upper transition is shifted down in temperature in the Pt-deficient compound, whereas a second one is clearly identifiable only in YbPtIn. In order to explore the differences between these two samples more thoroughly, a systematic study of the field-dependence of and C was undertaken.
III.3 High magnetic field measurements: YbPtIn
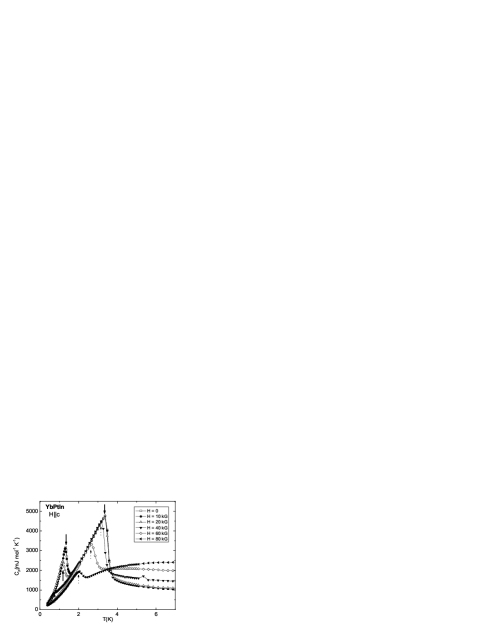
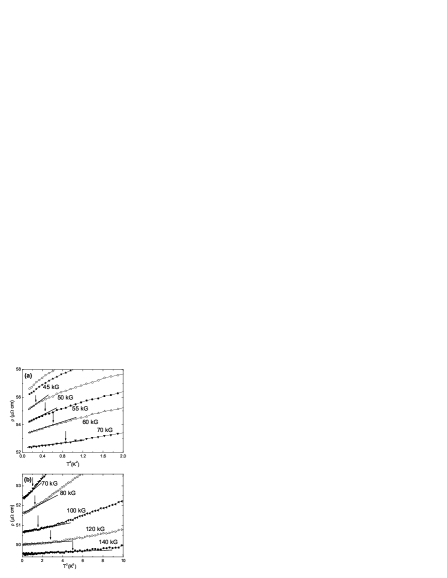
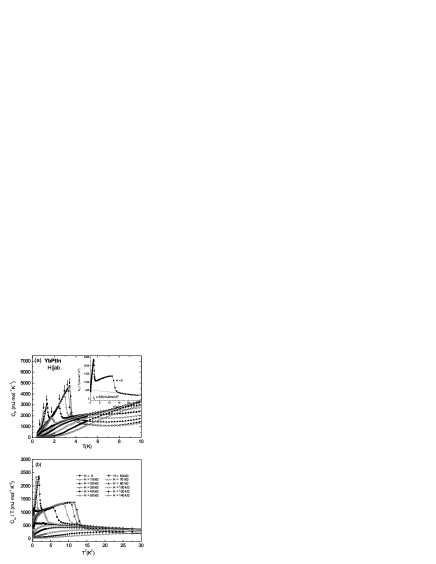
The low-temperature specific heat data for the on-line grown compound YbPtIn is shown in Fig.4a, for various values of the applied field. As already seen, two sharp peaks present in the H = 0 data can be associated with magnetic phase transitions at T K and 1.4 K. As the applied field is increased, these transitions (indicated by small arrows in Fig.4a) move to lower temperatures, and eventually drop below 0.4 K around 20 kG, and 60 kG respectively. Trovarelli et al.tro09 have reported similar measurements up to 80 kG, which are consistent with our data; however, their study did not include a systematic analysis of the H - T phase diagram or the potential quantum critical behavior in this compound. From the linear extrapolation of the zero-field C vs. T2 data from T 5 K down to T = 0 (dotted line in the inset, Fig.4a), the electronic specific heat coefficient can be roughly estimated as mJ / mol K2. The magnetic component of the specific heat is defined as (YbPtIn)(LuPtIn), and is shown in Fig.4b as vs. T2, for the same field values as before.
When the magnetic specific heat is plotted in C vs. T coordinates (Fig.5), a reduced region of logarithmic divergency (non-Fermi liquid NFL behavior) is apparent; however this linear region in C is more ambiguous than in other heavy fermion compounds displaying NFL behavior (e.g., YbRh2Si2tro05 and YbAgGebud11 ). Because of a downturn in the high field data (H 50 kG [Fig.5b]) around 5 K for H = 50 kG, the largest logarithmic divergency which occurs for H 60 kG, is limited to only a fraction of a decade in temperature (1.5 K T 6.5 K). The above observations suggests that a QCP may exist around a critical field value H just above 60 kG, but the presence of a NFL region at intermediate field values is less clearly defined than in the previously studied Yb-based heavy fermion compounds.
One of the expressions considered in the scaling analysis at a QCPtsv18 is the cross-over function vs. . In the case of YbRh2Si2pas09 and YbAgGebud12 , the range over which universal scaling was observed in high fields corresponded to 1T 3 K-1, and 1.2 K-1 respectively (with ). Due to the slightly enhanced magnetic ordering temperature K in YbPtIn, the analogous T range is drastically reduced (1T 0.3 K-1), making the unambiguous determination of the critical exponent essentially impossible.
Low-temperature resistivity curves for different values of the applied magnetic field are shown in Fig.6. The data are consistent with the presence of two magnetic phase transitions at low fields; the small arrows indicate these transition temperature values, as determined from maxima in the d. Both these transitions are suppressed by increasing applied field. Whereas the upper transition can still be detected for H kG, a field of about 20 kG is sufficient to drive the lower one below our base temperature of 0.4 K. It is worth noting that the critical field H kG, determined from the (T,H) data as the field required to suppress the magnetic ordering, is close to the position of the QCP as inferred based on the CP data (Fig.4-5).
As Fig.7 indicates, when the magnetic field is increased beyond H, the temperature dependence of the resistivity is ambiguous; particularly at fields just above H (H 100 kG), it is difficult to distinguish between linear or quadratic behavior of the resistivity as a function of temperature. Consequently we leave the complete analysis of the temperature-dependent resistivity outside the ordered state for the discussion section.
When magnetoresistance measurements () are performed (Fig.8) three features are apparent at very low temperatures, as indicated for T = 0.4 K by the small arrows. The inset shows (H) at T = 0.8 K, to exemplify how these transition temperatures were inferred from these data. For T 1 K, the two lower transitions merge and the resulting one is still distinguishable up to approximately 1.4 K. The upper transition moves down towards zero field as the temperature approaches T K.
Based on the above field- and temperature-dependent thermodynamic
and transport measurements, a phase diagram for
can be constructed (Fig.9): in zero magnetic
field, two magnetic phase transitions can be observed, around
T K and T K. Increasing magnetic field splits
the lower transition into two separate ones around H kG;
one of these phase lines drops towards our lowest temperature at
almost constant field, whereas the second one has a slower decrease
with field, such that it approaches T = 0.4 K around H = 20 kG. In a
similar manner, the upper transition is
driven down towards 0 around kG.
Fig.10 presents specific heat data for YbPtIn, , for fields up to 80 kG. High torques on this sample for this orientation of the field prevented us from completing these measurements up to 140 kG. Moreover, as will be shown below, there are significant discrepancies between the transition temperatures determined even from the intermediate-field specific heat data and transport measurements (i.e., for H 40 kG). This observation prompts us to suspect that significant torques may have changed the sample orientation for the specific heat measurements, even for fields significantly lower than 80 kG.
In zero field, we can confirm the two magnetic transitions observed before, at T K, and T K respectively; as the small arrows indicate, the lower-T transition is driven down in field, and falls below 0.4 K for H kG, whereas the upper transition persists above 80 kG.
The temperature and field dependent resistivity data (Fig.11-12) indicate a much slower suppression of the magnetic order with the applied field. In Fig.11a, curves are shown, with the arrows indicating the transition temperatures as determined from . Fig.11b presents a subset of these derivatives, to illustrate the criteria for determining the temperatures: for the lower transition, a peak in broadens as field is increased, and disappears for H 80 kG; the upper transition is marked by a step in these derivatives, which also broadens as H increases. At the highest measured field (i.e., 140 kG) we are unable to distinguish between a very broad step (with a possible transition temperature marked by the small arrow) or a cross-over in corresponding . The field-dependent resistivity data (Fig.12) are indicative of a low temperature transition consistent with that seen in , with the critical fields determined from onsets.
Given the above CP(T,H) and (T,H) data, we suspect that magnetic fields H 20 kG deform the four wires supporting the He-3 specific heat platform used for the CP(T,H) measurements, whereas the resistivity sample appears to be well held in place by grease on the rigid platform. Consequently, at high fields, the two sets of data (CP(T,H) and (T,H)) may not correspond to the same orientation of the field (), yielding different transition temperature values for the corresponding applied fields.
As a result, in constructing the T - H phase diagram for H (Fig.13), we will consider the Tc values as determined from the (T,H) data up to H = 140 kG, and only the H 20 kG ones based on specific heat measurements. Also shown are error bars for points determined from (T) data at several field values (i.e., for H = 20, 80, 100, 120 and 140 kG), and for the point obtained from (H) at our minimum temperature (T = 0.4 K); these give a caliper of the errors bars in determining the points on this phase diagram for the whole field and temperature range. Two transitions can be observed in Fig.13, at low fields, around 3.4 K, and 1.4 K respectively. As H is being increased, the low temperature line slowly approaches T = 0 around H kG. The step in associated with the upper transition (Fig.11b) broadens as the field increases, resulting in increasingly large error bars in determining these transition temperatures. As already mentioned, it is uncertain if the transition persists up to H = 140 kG, or if cross-over occurs between 120 and 140 kG.
III.4 High magnetic field measurements: YbPt0.98In
Given the differences between YbPtIn and YbPt0.98In evidenced by both thermodynamic and transport data (Figs.1-3), it is desirable to compare similar measurements on the two compounds, and to study the effect of the small stoichiometry change on the field-induced QCP.
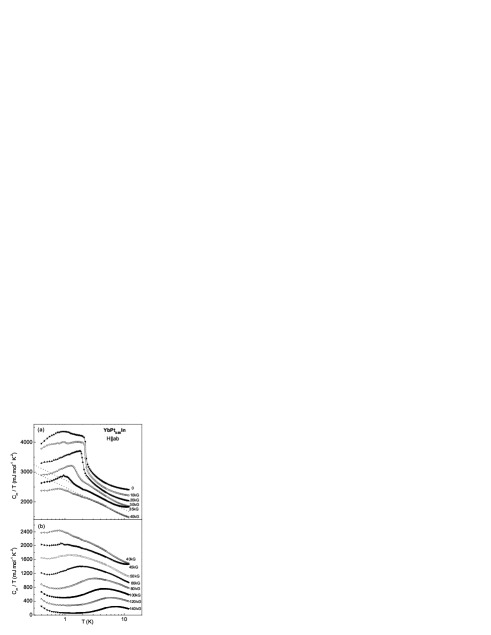
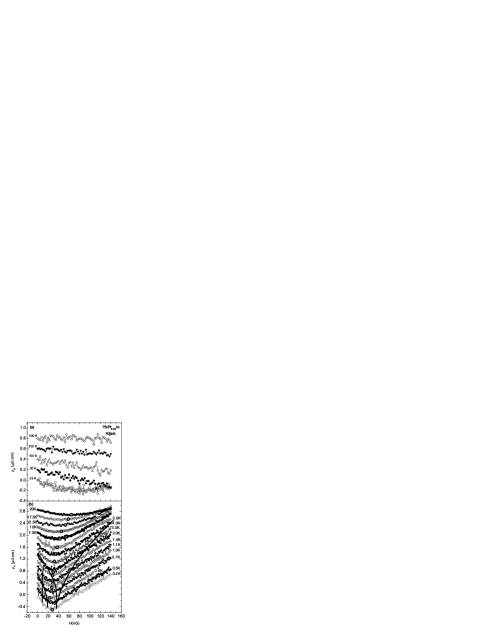
Consequently, in Fig.14 we present the low-temperature specific heat data of YbPt0.98In, for various values of the applied field H . A well-defined peak at T K in the H data may be associated with the magnetic ordering of this compound. As the applied magnetic field is increased, this transition (indicated by small arrows) moves to lower temperatures, and eventually drops below 0.4 K around 35 kG. From the linear extrapolation of the H = 0 data from T K down to T = 0 (inset, Fig.14a), we can estimate the electronic specific heat coefficient as mJ / mol K2. Fig.14b the magnetic specific heat data for the same field values, (YbPt0.98In)(LuPtIn), plotted as C vs. T2.
Fig.15 shows the magnetic specific heat as vs. , for the same field values as before. A logarithmic divergence can be observed in these data, with the largest temperature region where occurring around H = 35 kG (dotted line). However, on the next measured curve (i. e., for H = 40 kG) the linear region extends over a comparable temperature interval, at slightly higher temperatures than in the H = 35 kG case. It thus appears that the largest temperature region (close to a decade) for the logarithmic divergency of the C data may occur for some intermediate field value (35 kG H 40 kG). These data could be described as , with the ranges for and T0 determined from the linear fits on the H = 35 and 40 kG curves: 420 mJmol K 430 mJmol K2, and 14.7 K T 13.5 K. The above observations seem consistent with a QCP in this compound with critical field just above 35 kG.
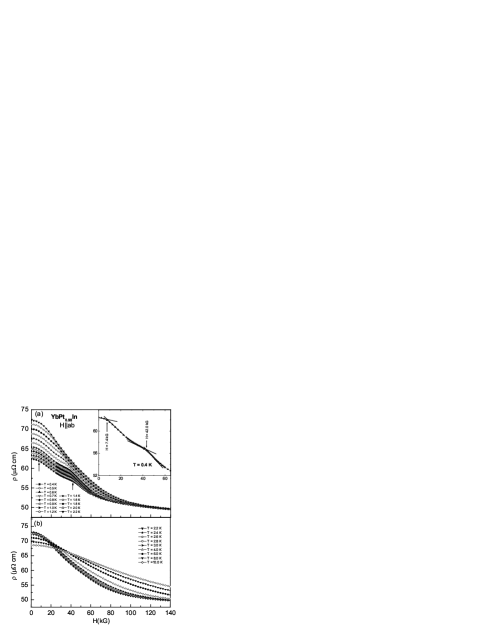
Fig.16 shows the low-temperature resistivity data for various values of the applied magnetic field. A maximum in d, associated with the magnetic ordering can be identified at T K in the H = 0 data, and is marked by small arrow in Fig.16a; as the field is increased above 35 kG, small arrows indicate that this transition temperature drops below 0.4 K , consistent with the specific heat data.
As was the case of YbPtIn, in YbPt0.98In the temperature dependence of the resistivity outside the ordered state is ambiguous. From figs.16b-17 it is unclear whether the resistivity is linear or quadratic in field for H , particularly for intermediate field values (H 55 kG). A detailed analysis of the resistivity data above the critical field will be performed in the discussion section, for both compounds. This should allow us to better clarify the position of the QCP and the existence of a Fermi liquid-like (FL) regime in these systems.
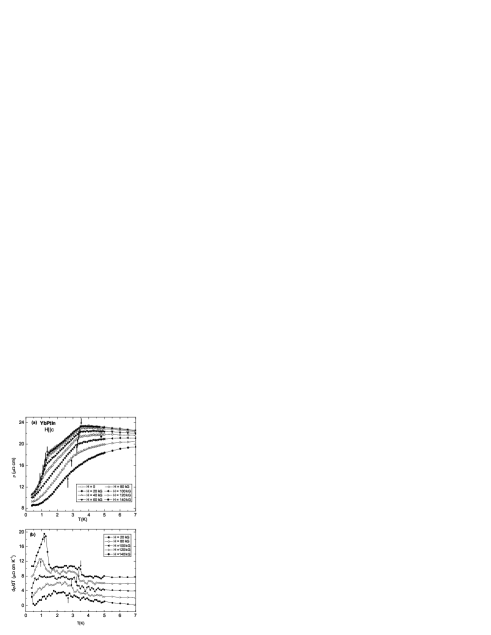
Transverse magnetoresistance measurements were taken at constant temperatures ranging from 0.4 K to 10 K. As shown in Fig.18, two different temperature regimes can be identified in these data: for T K (Fig.18a), two transitions can be distinguished. The small arrows mark the positions for these two transitions for T = 0.4 K, whereas the inset illustrates how these critical field values were determined. As the temperature increases up to about 1.8 K, the upper transition moves down in field and broadens, whereas the position of the lower one seems almost unaffected by the change in temperature. For temperatures higher than 2 K (Fig.18b), the magnetoresistance isotherms display only a broad feature that looks more like a cross-over rather than a transition.
Using the detailed CP(T,H) and (T,H) measurements discussed
above, the YbPt0.98In T - H phase diagram for H
can be constructed. As can be seen in Fig.19, it is
qualitatively similar to the corresponding T - H phase diagram for
the stoichiometric compound (Fig.9): in YbPt0.98In
magnetic ordering occurs at around 2.2 K. An almost field
independent phase line is apparent in the data
around 8 kG, and it appears to persist close to the magnetic
ordering temperature. Increasing applied field drives the higher
transition towards T = 0 at a critical field values around 35 kG.
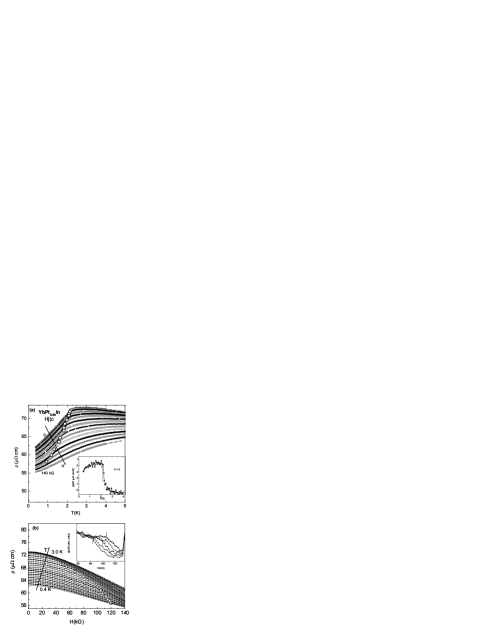
The similarities observed previously between YbPtIn and YbPt0.98In are also present for the direction, as the CP(T,H) and (T,H) measurements indicate. As in the case of the stoichiometric compound, significant torques on the specific heat platform and sample for H 50 kG may be the cause of the different transition temperature values, as determined by the two data sets mentioned above. Therefore we will only take into consideration CP(T,H) data for H 50 kG (Fig.20). Similar to the measurements (Fig.14), the CP curves reveal a magnetic transition around 2.1 K for H = 0 (Fig.20), which drops to 2 K for H = 40 kG, before the sample torques significantly; small arrows indicate the position of the transition temperature for the three curves shown in Fig.20.
The temperature and field dependent resistivity data (Fig.21) indicate a slow suppression of the magnetic order with the applied field. Fig.21a shows the (T) curves in various applied fields, with the large circles marking the phase transition as determined from d; the inset illustrates how the transition temperature was determined for H = 0. The critical field required to suppress this transition below our base temperature appears to be around 120 kG. Given the limited temperature range at these high fields, for H = 130 and 140 kG we were unable to distinguish a linear or quadratic temperature dependence of the resistivity. The magnetoresistance isotherms are presented in Fig.21b, and the large squares on this plot also indicate the high-T magnetic phase transition; in the inset, a few d curves are shown to illustrate how the critical field values for the transition were determined.
Based on the CP(T,H) and (T,H) presented above, the T - H phase diagram for YbPt0.98In can be obtained, as shown in Fig.22. At low fields, this T - H phase diagram is consistent with the in-plane one for this compound: a magnetic transition is apparent around 2.2 K, but the possible second one around 1.0 K is not visible in the Hc measurements; the T 2.2 K transition is driven down in temperature by increasing applied fields, and it approaches our base temperature (i.e., 0.4 K) around 120 kG. Lack of measurements below 0.4 K or above 140 kG limits our ability to probe the existence of a QCP in this orientation, similar to the one at H kG for .
IV discussion
For both the YbPtIn and YbPt0.98In compounds a number of similar properties, as well as systematic differences, could be distinguished. First, the small stoichiometry difference was apparent from single crystal x-ray measurements, which also resulted in slightly reduced lattice parameters and unit cell volumes in the YbPtIn system. Furthermore, the resistivity values were shifted towards higher values in the Pt-deficient compound (Figs.2b-3) for the whole temperature (T = 0.4-300 K) and field ranges (H = 0-140 kG) of our measurements. High enough fields suppressed the magnetic order in both systems, at least for field applied within the basal plane; in a similar manner to the T-scale in these compounds, the critical field value was reduced in YbPt0.98In by comparison to the analogous one in YbPtIn. For , the field values required to suppress the magnetic order in YbPt0.98In and YbPtIn were close to, or respectively higher than our maximum available field (i.e., 140 kG); this precluded us from studying the low temperature properties of the two compounds outside the ordered state, for this orientation of the field.
For NFL-like behavior seems to occur in YbPt0.98In for intermediate field values above the ordering temperatures, as indicated by the logarithmic divergence of the C data (Fig.15a). In YbPtIn the NFL region is less clearly defined in the specific heat, as its logarithmic divergence was limited to a small temperature range by a downturn in the C data (Fig.5) towards high T. Even more ambiguous was the temperature dependence of the resistivity data in both compounds, for H . Below we are presenting a detailed analysis of these data, aimed at distinguishing between, if existent, the NFL and FL regimes, and providing a more accurate estimate of the QCP position in each of the two compounds.
IV.1 Hab resistivity data above the magnetically ordered state
Given the ambiguity already mentioned in the power law that best describes data above the ordered state, we attempt to determine the exponent when the temperature dependence of the resistivity is given by: , where . This is best done by determining the slope of the data on log-log plots at various field values. However, the accuracy of the resulting values is highly dependent on accurate estimates of the residual resistivity values . In turn, the estimates of the values are made difficult by their enhanced values compared to the over-all resistivity values (fig.3).
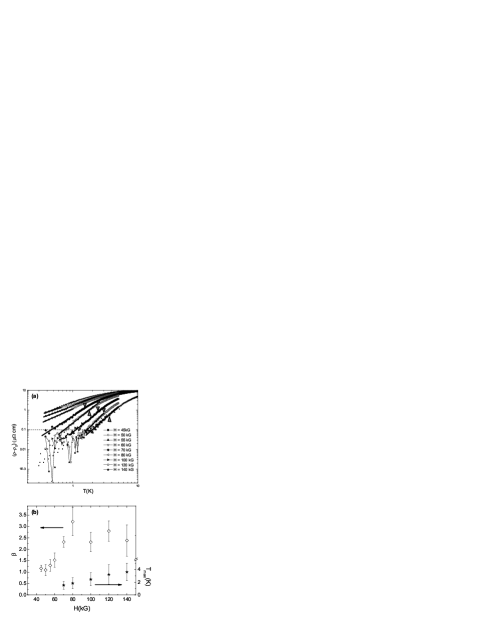
Consequently, we determine the residual resistivity values using two criteria: firstly, from fits of the low-T resistivity data to a function; secondly, given that figs.16b-17 (for YbPt0.98In), or fig.7 (for YbPtIn) suggests that low-T data are close to being either linear or quadratic in T, we also choose (for mathematical rather than physical reasons) a second-order polynomial function to determine as a function of field: . For each field value, the average resulting from the two aforementioned criteria is used to calculate plotted in Fig.23a and 24a respectively, on a log-log scale. The large data scattering towards the lowest temperatures, particularly at high fields, is due to the fact that is calculated as the difference between two comparably large values, and . As a consequence, the values of the exponent are being determined from (i) linear fits shown as solid lines, for larger than 0.1 (marked by the dashed horizontal line), and (ii) from similar linear fits down to the lowest measured temperature (dotted lines). Together with the exponent values originally determined from fitting the low-T data to functions, we can now determine the values shown in Fig.23b and 24b, as full symbols, with their corresponding error bars.
In the case of YbPt0.98In (Fig.23a), the resistivity is linear on the log-log scale, up to some maximum temperatures Tmax marked with large triangles, with a large change in slope for 60 kG H 70 kG. This is equivalent to the exponent having a discontinuous change from below 60 kG (i.e., for H H), to in higher fields (H H), as can be seen in Fig.23b. Also shown in Fig.23b are the temperatures Tmax below which the low-temperature manifests a Fermi liquid-like exponent of 2, analogous to the cross-over previously reported for YbRh2Si2tro05 and YbAgGebud11 . The departure from linearity on the resistivity plots can be determined up to a temperature range, and not a unique temperature value, which results in finite error bars on these cross-over temperatures. However, a monotonic increase of the cross-over temperatures with field is observed, with the corresponding error bars also increasing. When adding this cross-over line to the H-T phase diagram (see below Fig.25, full triangles), it appears to converge with the magnetic order upper boundary (solid line) around the QCP between 45 and 70 kG.
When we describe the YbPtIn low-T resistivity data as for H H, we encounter a situation very similar to that seen in YbPt0.98In: the logarithmic plot in Fig.24a, linear at low T, is indicative of a jump in slope for an applied field between 70 kG and 80 kG, where the slope gives the values of the exponent . It appears that the exponent has a discontinuous variation with field (Fig.24b (left)) from for H H, to when H H. This suggests a NFL-like regime just above the magnetically ordered state, with a cross-over to a FL state above 100 kG, making this compound fairly similar to the Pt-deficient one, but also to the previously reported YbRh2Si2tro05 and YbAgGebud11 .
As observed before for YbPt0.98In, due to the data scattering, the departure of the low temperature resistivity plots from the FL-like 2 behavior at the highest field allows us to determine a cross-over temperature range, rather than a temperature value. This results in finite error bars on the cross-over temperatures, as seen in Fig.24b (right). However, an increase of the cross-over temperatures with field is observed, both in Fig.24b, and also in the revised H-T phase diagram (Fig.26) (full symbols).
IV.2 Hall resistivity measurements in YbPt0.98In: Hab
Based on the low temperature thermodynamic and transport measurements, YbPtIn and YbPt0.98In can be regarded as Yb-based heavy fermion compounds with long range, possibly reduced moment ordering that can be driven through a field-induced quantum critical point, similar to the previously studied Yb-based HF systems, YbRh2Si2pas09 and YbAgGebud12 . In the latter two compounds, the Hall effect served as an additional tool for characterizing the QCP and its effects on the finite-temperature properties of these materials.
In order to further explore the field-induced QCP our Yb-based compounds, field-dependent Hall resistivity measurements were performed for temperatures up to 300 K. However, the data on the stoichiometric compound was noisy, given the limited (small) crystal size, and meaningful Hall resistivity data could only be collected for the solution-grown compound for H . These measurements are shown in Fig.27.
We determined the Hall coefficient RH for YbPt0.98In as , in the low-field (H kG) and high-field (H kG) regimes, shown in Fig.27 for various T. (This alternative definition for the R was preferred to due to the scattering of the data at low fields as seen later in Fig.29b). The results are shown in Fig.28 on a semi-log scale. The high-H points (squares) show the expected leveling off of R as , whereas the low-H data appear to have a stronger temperature dependence. At temperatures higher than 25 K, the two data sets merge (as the data become roughly linear for the whole field range [Fig.27a]). These data indicate that the field-dependent Hall resistivity will be non-trivial and potentially of interest at low temperatures.
In the field-dependent Hall resistivity measurements shown in Fig.27, two possible regimes can be distinguished: a high-T regime (T K), where a monotonic decrease with field can be observed, despite the scattering of the data (Fig.27a), and a low-T regime (T K), for which a minimum in the H) data appears and sharpens as the temperature decreases (Fig.27b). For 5 K T 25 K, the Hall resistivity curves show a fairly broad minimum (Fig.27b), marked by the large gray dots, which moves down in field with decreasing temperature. Below 5 K, this minimum is more and more pronounced, and is almost unaffected by the change in temperature.
Coleman et al.col20 have indicated that RH(C) data (where C is a control parameter, i.e., H in our case) can be used to distinguish between two possible QCP scenarios: diffraction off of a critical spin density wave SDW (manifesting as a change in the slope of RH(C) at Ccrit) or a breakdown of the composite nature of the heavy electron (signaled by the divergence of the slope of RH(C) at Ccrit). In our case, it is not clear what definition of the Hall coefficient should be used for comparison with the theory (i.e., either R or R) since the magnetic field H is itself the control parameter C. Therefore in Fig.29 we are presenting the RH(H) curves determined using both of the aforementioned definitions. When RH(H) (Fig.29a), the Hall coefficient is linear up to a field value which varies non-monotonically with T, as indicated by the dashed line. This line is shifted to higher field values with respect to the Hall resistivity line (Fig.29a), and is marked here by the large diamonds. When using the RH(H) definition for the Hall coefficient (Fig.29b), the maximum-H points on the low-field linear fits could be used as the criterium for defining the Hall line (indicated by the dotted line).
Regardless of what criterium is being used, the Hall measurements define a new phase line, distinct from any of the ones inferred from either the CP(T,H) or the (H,T) data. Fig.30 shows the phase diagram with the phase lines determined from the (H,T) (H ) or the CP(T,H) data (lines), together with the cross-over line and the Hall line inferred from the various definitions (symbols). The line resulting from the Hall resistivity data (diamonds) seems to persist even below Tord, down to our lowest T. However, the other two criteria used for the definition of the Hall line (R or Hmax for the linear fit of R) delineate lines, which more closely resembles the Hall line observed for either YbRh2Si2pas09 and YbAgGebud12 as it appears to converge with the ”coherence” line (i.e., the line defining the cross-over between the non-Fermi liquid and Fermi-liquid like regimes), and the high-T magnetic ordering phase boundary, at the QCP, around H. It should be noted, though that, unlike YbAgGe, for which the Hall line is clearly not associated with the saturation of the Yb momentstak05 , for YbPt0.98In the Hall line appears to be close to the saturation fields, at least at the lowest temperatures.
IV.3 Summary
Based on the presented data, we can conclude that, in both YbPt0.98In and YbPtIn, when magnetic field is increased above , the system first enters a NFL state, followed, at higher fields, by a FL-like state: the specific heat has a logarithmic divergence (Figs.15 and 5) and the resistivity shows a functional dependence (Fig.23a,b and 24a,b), with having a discontinuous change at intermediate field values, from to 2. Moreover, from Hall resistivity measurements on the Pt-deficient compound, we were able to determine another totally distinct line in the T - H phase diagram (Fig.25), convergent, towards the lowest temperature, with the cross-over line and the high-T magnetic order line. All these observations lead us to believe that a QCP exists in both compounds, around kG for YbPt0.98In, and 60 kG for YbPtIn.
To further study the nature of the field-induced QCP in the two systems, we analyze the field dependence of the electronic specific heat coefficient . Also, in order to extend the comparison of the disordered state in our systems and in previously studied compounds (YbRh2Si2pas09 and YbAgGebud12 ), we analyze the field-dependence of the coefficients A in the ( = 2) resistivity, even though in both YbPtIn and YbPt0.98In the resistivity was not exactly quadratic for H H, but 2.
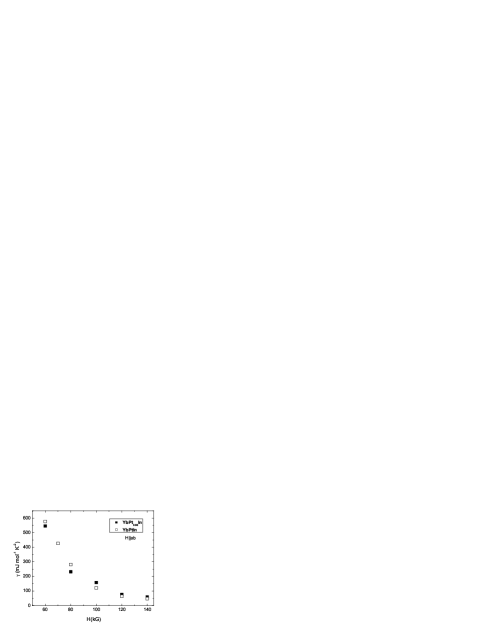
The field-dependent electronic specific heat coefficient could be estimated at low T, outside the ordered state, and these values are shown in Fig.31. For both compounds, was taken as the corresponding C value at T K, such as to avoid the low-T upturn in the highest field data. A drastic decrease of (almost an order of magnitude) can be observed in Fig.31 for both compounds, for fields above their respective .
The field dependence of the coefficient A of the quadratic resistivity is shown in Fig.32a,b for YbPtIn and YbPt0.98In respectively. A divergence can be observed for both compounds, with estimated from the fit as 64.4 kG for YbPtIn, and 56.0 kG for YbPt0.98In. This critical field value for the former system is consistent with the specific heat and resistivity data (Figs.4-9), which suggested that 60 kG. In the case of YbPt0.98In, where NFL behavior was observed between 35 kG and 55 kG, the critical field value can only be determined to a range within the above two field values; the kG determined from the A vs. fit (Fig.32b) is close to the above field range, thus consistent with the specific heat and resistivity data (Figs.14-19,23-25).
The proportionality between the resistance coefficient A and the electronic specific heat coefficient is emphasized by the logarithmic plots in the insets in Fig.32. In the case of the YbPtIn compound (Fig.32a, inset), the solid line represents the Kadowaki-Woods ratio cm (mJ / mol K)2. Such a value is close to that observed for many heavy fermion systemskad21 , but slightly higher than the ratio reported for YbRh2Si2geg06 ; this, in turn, was larger than the values observed for most Yb-based intermetallic compoundstsu22 . The corresponding value was larger still in YbAgGebud11 , and it would appear that this is a common feature of Yb-based materials with field-induced NFL-like behavior.
When we turn to the Pt-deficient compound (Fig.32b, inset), a smaller ratio is indicated by the solid line: cm (mJ / mol K)2. This value is again one order of magnitude larger than that expected for many Yb-based compoundstsu22 , and several times smaller than the ratio observed for the stoichiometric YbPtIn compound (Fig.32a). In light of observations of suppression of the A coefficient due to site disordertsu22 ; law23 , we may have to consider the ratio for YbPt0.98In as a reduced value from the enhanced ratio observed for the stoichiometric compound.
V conclusions
The detailed field- and temperature-dependent measurements presented here allowed us to confirm that YbPtIn is a heavy fermion compound, as has been presented by Trovarelli et al.tro09 . In addition, we showed that a field-induced QCP exists in this material, at least for , with kG. In addition to the magnetic field used as a control parameter, we showed that a small Pt-deficiency introduced in this system had effects consistent with positive pressure applied to Yb-based heavy fermion compounds. Thus, in the YbPt0.98In compound we also see a suppression of the magnetic ordering by applied magnetic field; in addition, the small disorder also suppresses the ordered state (both Tord and Hc have smaller values in this compound than the similar ones in YbPtIn).
NFL regions can be observed in both our compounds for H H, characterized by linear ( 1) and logarithmic divergency of the specific heat. For H H, the exponent approaches 2, suggesting a cross-over to a low-T FL state at these field values, similar to YbRh2Si2geg06 and YbAgGebud11 .
As the critical field required to suppress the magnetic order in YbPt0.98In and YbPtIn in the c direction appeared to exceed our maximum field, experiments to higher fields would be desirable in order to extend the comparison with YbRh2Si2 and YbAgGe to the effects of anisotropy on the field-induced QCP.
VI acknowledgments
Ames Laboratory is operated for the U.S. Department of Energy by Iowa State University under Contract No. W-7405-Eng.-82. This work was supported by the Director for Energy Research, Office of Basic Energy Sciences.
References
- (1) O. Trovarelli, C. Geibel, R. Cardoso, S. Mederle, R. Borth, B. Buschinger, F. M. Grosche, Y. Grin, G. Sparn, F. Steglich, Phys. Rev. B 61 (2000), 9467.
- (2) D. Kaczorowski, B. Andraka, R. Pietri, T. Cichorek, V. I. Zaremba, Phys. Rev. B 61 (2000), 15255.
- (3) S. Yoshii, K. Kindo, K. Katoh, Y. Niide, A. Ochiai, J. Magn. Magn. Matter. 272-276 (2004), e99.
- (4) O. Trovarelli, C. Geibel, S. Mederle, C. Langhammer, F. M. Grosche, P.Gegenwart, M. Lang, G. Sparn and F. Steglich, Phys. Rev. Lett 85 (2000), 626.
- (5) P. Gegenwart, J. Custers, C. Geibel, K. Neumaier, T. Tayama, K. Tenya, O. Trovarelli, and F. Steglich, Phys. Rev. Lett 89 (2002), 056402.
- (6) K. Ishida, K. Okamoto, Y. Kawasaki, Y. Kitaoka, O. Trovarelli, C. Geibel and F. Steglich, Phys. Rev. Lett 89 (2002), 107202.
- (7) S. Paschen, T. Luehmann, C. Langhammer, O. Trovarelli, S. Wirth, C. Geibel and F. Steglich, Acta Phys. Pol. B 34 (2003), 359.
- (8) S. Paschen, T. Luehmann, S. Wirth, P.Gegenwart, O. Trovarelli, C. Geibel, F. Steglich, P. Coleman and Q. Si, Nature 432(2004), 881.
- (9) W.P.Beyermann, P.C.Canfield, S.L.Bud’ko, A.Lacerda, Bull. Am. Phys. Soc. 43 (1) (1998), C31-8, 115.
- (10) K.Katoh, Y.Mano, K.Nakano, G.Terui, Y.Niide and A.Ochiai, J. Magn. Magn. Mater. 268 (2004), 212.
- (11) E. Morosan, S. L. Bud’ko, P. C. Canfield, M. S. Torikachvili and A. H. Lacerda, J. Magn. Magn. Matter. 277 298 (2004)
- (12) S.L. Bud’ko, E. Morosan and P.C. Canfield, Phys. Rev B 69 (2004), 014415.
- (13) S.L. Bud’ko, E. Morosan and P.C. Canfield, Phys. Rev B 71 (2005), 054408.
- (14) G. R. Stewart, Rev. Mod. Phys. 73 (2001), 797.
- (15) E. Morosan, S. L. Bud’ko, and P. C. Canfield, Phys. Rev. B 72 (2005), 014425.
- (16) P. C. Canfield and I.R.Fisher, J. Cryst. Growth 225 (2001), 155.
- (17) A. M. Tsvelik and M. Reizer, Phys. Rev B 48 (1993), 9887.
- (18) M. A. Continentino, G. M. Japiassu and A. Troper, Phys. Rev. B 39 (1989), 9734.
- (19) P. Coleman, C. Pépin, Q. Si and R. Ramazashvili, J. Phys: Condens. Matter 13 (2001), R723.
- (20) K. Kadowaki and S. B. Woods, Solid State Commun., 58 (1986), 507.
- (21) N. Tsujii, K. Yoshimura and K. Kosuge, J. Phys: Condens. Matter 15 (2003), 1993.
- (22) J. M. Lawrence, J. D. Thompson and Y. Y. Chen, Phys. Rev. Lett 54 (1985), 2537.
- (23) Y. Tokiwa, A. Pikul, P. Gegenwart, F. Steglich, S.L. Bud’ko and P.C. Canfield, Phys. Rev B 73 (2006), 94435.


.