Nonequilibrium molecular dynamics of complex fluids near the gel point
Abstract
We have carried out nonequilibrium molecular dynamics simulations of a system of crosslinked particles under shear flow conditions. As the fraction of crosslinks is increased the system approaches a gel point at which the shear viscosity and the first and second normal stress coefficients and diverge. All three quantities seem to diverge with a power law form: , where and and in three dimensions and and in two dimensions.
pacs:
61.43.Hv,66.20.+d,83.10.Rs,83.60.BcI Introduction
There have been many studies, both experimental and theoretical, of the rheological properties of complex fluids in the vicinity of the gel point adam96 . There is general agreement in the literature that the transition from the sol to the gel phase, at least in the case of chemical gels, is continuous and accompanied by the divergence of the shear viscosity where characterizes the degree of crosslinking or condensation and is the critical point. However, the experimental and theoretical values of the exponent are rather widely distributed and there is continuing debate concerning the existence of a single universality class for these transitions. We mention, in passing, that we are excluding the case of vulcanization from this discussion. There is substantial evidence, in the form of a Ginzburg criterion degen77 , that the vulcanization transition which involves the crosslinking of very long chains is for practical purposes mean-field-like.
There has been much less theoretical and experimental work on the normal stress differences. In a non-Newtonian fluid under shear flow, e.g., in a Couette geometry with the flow in the -direction and velocity gradient in the -direction, the first and second normal stress differences and are both not zero and, in the low shear-rate limit, proportional to the square of the shear rate . It is conventional to define the normal stress coefficients , through . One of the purposes of this work is to investigate the critical behavior of the normal stress coefficients. These are most easily calculated directly, i.e., by shearing the computational cell and measuring the normal stresses via a virial formula. While there exists a Green-Kubo formula broderix02 that yields the zero shear-rate limit of , the integral involved presents significant computational problems close to the gel point: the decay of the relevant correlation function becomes extremely slow and truncation errors become unmanageable. For this reason, we have decided to utilize nonequilibrium molecular dynamics (NEMD) to calculate both the shear viscosity and the normal stress differences. We use the same model for which we have previously calculated the shear viscosity MP01 using the Green-Kubo formalism. Our NEMD results for the critical exponent are consistent with these earlier results. The NEMD simulations indicate that the first normal stress coefficient diverges at the critical point with , i.e., much more strongly than does the shear viscosity. The errors in are much larger than those in and an independent determination of an exponent for its divergence is not feasible. However, the data are consistent with the conjecture that both normal stress coefficients diverge in the same way. We note that the conclusion that diverges more strongly than has also been arrived at by Broderix et al.broderix02 in the context of a Rouse-type model. However, their exponent is significantly larger than ours.
The structure of this article is as follows. In section II we briefly describe the model that we have used and the computational techniques. Section III contains our results for the two-dimensional case and the results in three dimensions are presented in Section IV. We conclude in Section V with a brief discussion.
II Model and Computational Methods
Our model of the sol phase is identical to that in MP01 . All particles interact through the soft sphere potential for and, in the three-dimensional calculations, we have used a single volume fraction which is well below the liquid-solid coexistence density. All calculations were carried out at a temperature . In the absence of crosslinks, this system is a simple liquid that has been well characterized powles . We initially placed the particles on the vertices of a simple cubic lattice and instantaneously and randomly introduced a fraction of nearest-neighbor bonds. We used the bonding potential where and where so that there was no internal mechanical strain. This method of crosslinking ensures that the cluster size distribution is that of percolation in three dimensions and that a gel forms (in the thermodynamic limit ) at . Once the particles had been crosslinked they were free to move throughout the three-dimensional computational box. They were initially thermalized with periodic boundary conditions. Once equilibrium had been attained, the computational box was sheared at a rate and the boundary conditions were changed to the Lees-Edwards boundary conditions allen . The system was then reequilibrated using the so-called SLLOD algorithm allen subject to the constraint that the kinetic energy in the frame following the overall flow of the particles remain constant. This kinetic energy is proportional to the square of the “peculiar velocity” . Once a steady drift had been established, the diagonal elements of the stress tensor as well as were calculated from the appropriate virial formula. Calculations were performed for systems of particles with = 10, 15 and 20 over the entire range and for shear rates generally in the range in units of although for a few cases larger shear rates were also imposed. It should be noted that if atomistic values of , and are used, this range of shear rates corresponds to values of order , i.e., enormously large rates compared to experimental values. Even if one takes the point of view that the particles represent a colloidal suspension, the minimum shear rate is still of the order of . It was necessary to use such large shear rates in order to obtain reasonably well converged estimates for the normal stress coefficients, especially close to the gel point. For this range of shear rates, the equations of motion could be stably integrated with a time step but for larger values of the time step had to be decreased.
The values of the shear viscosity, and to an even larger extent the normal stress coefficients, varied considerably for different realizations of the crosslinks. Therefore, we averaged the results over several thousand realizations even for values of as small as 0.1.
The same repulsive pair potential was used in the two-dimensional case. Here the particles were initially placed on a triangular lattice and instantaneously crosslinked as in three dimensions. This sets the gel point at . The lattice constant of the initial configuration was , and so these simulations were done at a number density . The spring constant used was and the value of was chosen to eliminate mechanical strain due to the crosslinks at zero temperature, as was done in three dimensions.
III Results in Two Dimensions
The final results for the zero shear rate viscosity extrapolated from nonequilibrium molecular dynamics simulations are shown in Fig. 1. These data are from simulations of systems of size particles. No significant deviation from a scaling form is visible for at this system size for the range of studied here. The power law divergence of the viscosity thus directly gives an estimate for the exponent , without a finite size scaling analysis.
The inset to Fig. 1 shows the shear rate dependence of the viscosity as well as the zero shear rate values from the Green-Kubo formula, for an uncrosslinked and for a lightly crosslinked sample. The extrapolation of the finite shear rate values to zero shear-rates seems to be consistent with the Green-Kubo values. This fluid exhibits shear thinning, as is seen in some experiments on complex fluids. The determination of a zero-shear-rate viscosity requires fitting to some functional form for the shear-rate dependence of . However, this value is not sensitive to the form chosen. Many different functional forms have been suggested for the shear-rate dependence of the viscosity, mostly suggested as phenomenological fitting functions to experimental data bhw . The value for in the main figure was estimated from a fit to a Lorentzian plus a constant term, as suggested in ferrario92 , while the difference between different fits was used as an estimate of the error. The Lorentzian form has the advantage that it is automatically symmetric in and is analytic near .

There is only one normal stress difference, , in a two dimensional system. We have measured the associated coefficient close to . This quantity is expected to diverge as a power law as the gel transition is approached; the results of our simulation are shown in Fig. 2. We estimate an exponent from our data.
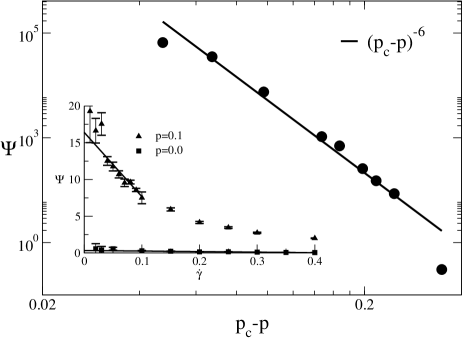
The estimation of the normal stress coefficient was more difficult than for the viscosity. The division by produces large statistical errors for small , thus making it difficult to determine the functional form of the shear-rate dependence. An example is shown in the inset to Fig. 2. Only a simple linear fit was used to estimate the zero-shear-rate normal stress coefficient.
IV Results in Three Dimensions
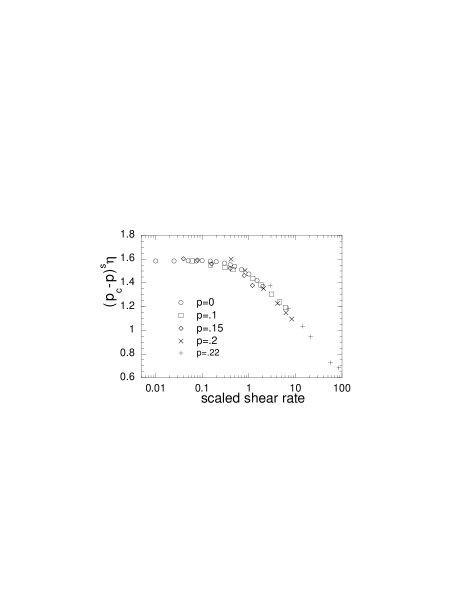
In the three-dimensional case, we have results for systems of particles with , , and . We first display, in Fig. 3, the shear-rate dependence of the viscosity for and five different values of the degree of crosslinking ranging from the simple fluid case, , to a system close to the gel point (). All systems show evidence of shear thinning, with this feature becoming much more prominent and setting in at lower shear rates as the gel point is approached. If we rescale the shear viscosity using the form with and where and are constants, we can achieve a respectable collapse of the data, as seen in Fig. 4. Since the data are noisy, we have not made a serious effort to optimize this collapse. Nevertheless, the “dynamical” exponent . The exponent used to rescale the viscosity is our best estimate of the exponent that governs the divergence of the zero shear-rate viscosity .
We note that dynamical scaling yields a connection between the exponent that controls the divergence of the longest relaxation time at the gel point and the exponents and , i.e., adam96 . Here is the exponent that describes how the shear modulus vanishes as the gel point is approached from the solid side: . For this model, we have determined mp99 that . This yields the prediction , a value not too far from the value used to rescale the shear rate.
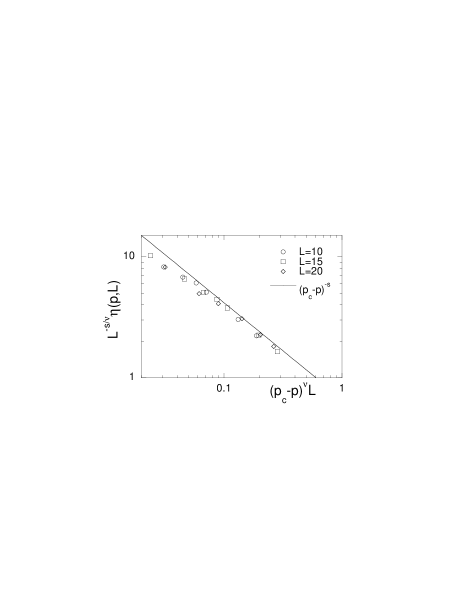
The zero-shear-rate viscosity is shown in Fig. 5 in finite-size scaled form, i.e., we plot as function of where is the correlation length exponent of the three dimensional percolation problem . As mentioned above, the value of the exponent is consistent with our previous result obtained from a Green-Kubo calculation MP01 .

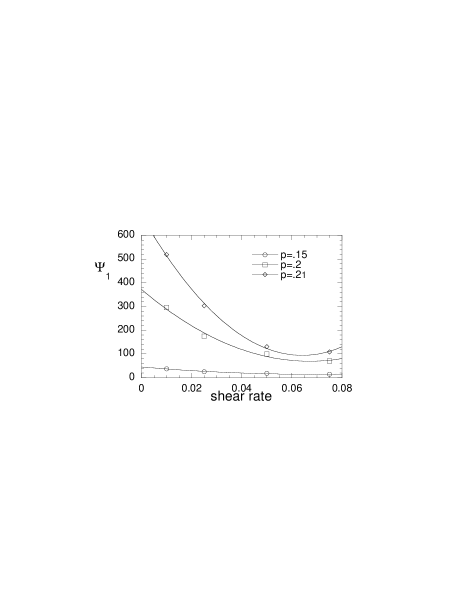
We turn now to the normal stress coefficients. In Fig. 6 we plot the first normal stress coefficient as function of the shear rate for and three values of . For larger values of , increases rapidly as the shear rate is decreased and an estimate of the zero shear-rate value is problematical. We have fit the data points to a second order polynomial and obtained our estimate of the zero shear-rate value in this way. A fit to an exponential decay works equally well and produces estimates of that differ by no more than 3% from those shown here. Similarly, the Lorentzian-plus-constant fit that was used to fit the viscosity in two dimensions also provides a reasonable fit to the data as long as there are enough values of the shear rate (more than five). The conclusions presented below are insensitive to the method of extrapolation.
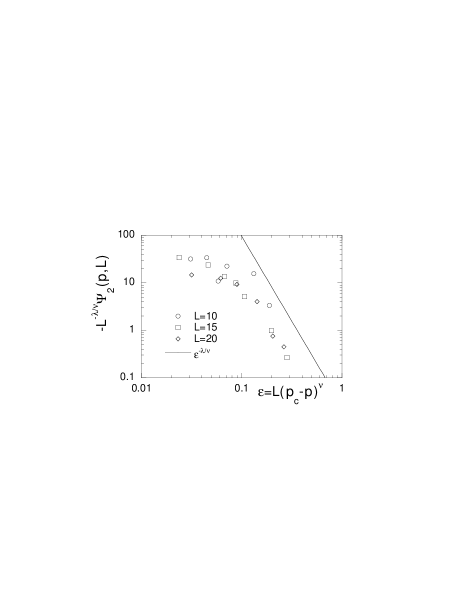
The unscaled data for are plotted in Fig. 7 for , and as function of along with a line representing the function with that captures the form of the data outside the critical region quite well. Closer to the critical point , the usual finite-size effects that appear when the geometric correlation length approaches the system size, , are evident. These finite-size effects can be hidden by plotting as a function of the scaled variable where is the correlation length exponent. This is done in Fig. 8 and the data do collapse reasonably well to a universal curve. A useful consistency check on this procedure is available far from the critical point: if the exponents and are correctly determined then the scaled normal stress coefficient should approach the power-law form at large . This line is also displayed in Fig. 8 and the data are consistent with the expected behavior.


We have also calculated the second normal stress coefficient . This coefficient is much smaller in magnitude than and negative, at least for our range of shear rates. The sample-to-sample fluctuations in are relatively much larger than those in and the data for are therefore much more noisy. Indeed, they are so poorly converged that a determination of a critical exponent from that dataset is not supportable. We have therefore carried out a rescaling of under the assumption that it diverges in the same way as , i.e., controlled by the same critical exponent . The results of this rescaling are shown in Fig. 9 and we see that the data for and that are somewhat better converged than the data for seem to support such an assumption.
The authors of reference broderix02 have proposed a scaling relation for the exponent : that seems to be rigorous for the Rouse model that they have used. In our case, using the two estimates of referred to above, namely and , we obtain and which bracket the measured value. It should however be noted that in the Rouse model of broderix02 , the second normal stress coefficient for all values of .
V Conclusions
Using nonequilibrium molecular dynamics simulations, we have measured the divergence of both the viscosity and the normal stress coefficient in a model gel as the gel transition is approached. Our results for the divergence of the zero shear-rate viscosity are consistent with our previous calculation using a Green-Kubo formula to extract the viscosity from an equilibrium simulation. In addition, this model exhibits shear thinning as the shear rate is increased, as is observed in experiments on gelling systems. We found that the exponent governing the divergence of the shear viscosity to be in three dimensions. This value is consistent with some experiments devreux93 ; durand87 , as well as several analytical calculations muller03 . We also find in two dimensions.
We have also presented evidence that, in this model, the shear-rate-dependent viscosity can be rescaled onto a single universal curve. This indicates that the physics of the shear-thinning that we observe for all is the same close to the gel point as it is in the simple liquid ().
The divergence of the normal stress close to the gel transition has not been measured in a experiment. As suggested in broderix02 , it should be possible to observe the very strong divergence of this quantity experimentally. Measuring both the viscosity and the normal stress close to the gel point would give the ratio of two dynamical exponents without determining the critical point, which is often difficult to determine accurately in an experiment. The ratio of to would then provide a dynamical exponent which would characterize the universality class of a given material. Comparing this value to the values predicted by different models could then give some insight into which features of a microscopic model are important to the dynamical properties of an incipient gel.
ACKNOWLEDGMENTS
We thank Béla Joós for helpful discussions. This research was supported by the NSERC of Canada, and by the National Science Foundation through MRSEC grant No. DMR 0079909.
References
- (1) For a review, see M. Adam and D. Lairez in The Physical Properties of Polymeric Gels, edited by J.P. Cohen Addad (John Wiley and Sons, New York, 1996) p. 87.
- (2) P.G. de Gennes, J. Phys. (Paris) 38, L355 (1977).
- (3) K. Broderix, P. Müller and A. Zippelius, Phys. Rev E 65, 041505 (2002).
- (4) D. Vernon, M. Plischke and B. Joós, Phys. Rev E 64, 03105 (2001).
- (5) K. Broderix, T. Aspelmeier, A. K. Hartmann and A. Zippelius, Phys. Rev. E 64, 021404 (2001).
- (6) J.P. Powles and D.M. Heyes, Mol. Phys. 98, 917 (2000). These authors have studied the properties of systems with a pair potential of the form , for , including our case .
- (7) M.P. Allen and D.J. Tildesley, Computer Simulation of Liquids (Oxford University Press, New York, 1987).
- (8) H. A. Barnes, J. F. Hutton and K. Walters, An Introduction to Rheology (Elsevier, Amsterdam, 1989).
- (9) M. Ferrario, G. Ciccotti, B.L. Holian and J. P. Ryckaert, Phys. Rev. A 45, 3706 (1992).
- (10) M. Plischke, D.C. Vernon, B. Joós and Z. Zhou, Phys. Rev. E 60, 3129 (1999).
- (11) F. Devreux, J. P. Boilot, F. Chaput and L. Mailier, Phys. Rev. E 47, 2689 (1993).
- (12) D. Durand, M. Delsanti, M. Adam and J. M. Luck, Europhys. Lett. 3, 297 (1987) and refs. therein.
- (13) P. Müller, J. Phys. A 36, 10443 (2003).