Magnetic and Transport Properties of Fe-Ag granular multilayers
Abstract
Results of magnetization, magnetotransport and Mössbauer spectroscopy measurements of sequentially evaporated Fe-Ag granular composites are presented. The strong magnetic scattering of the conduction electrons is reflected in the sublinear temperature dependence of the resistance and in the large negative magnetoresistance. The simultaneous analysis of the magnetic properties and the transport behavior suggests a bimodal grain size distribution. A detailed quantitative description of the unusual features observed in the transport properties is given.
pacs:
75.47.De; 75.70.Cn; 75.20.En; 73.43.QtI INTRODUCTION
As promising candidates for magnetic recording and sensor applications heterogeneous magnetic materials, i. e. multilayer structures Baibich1988 ; Valet1993 of alternating ferromagnetic and nonmagnetic layers and granular composites Berkowitz1992 ; Xiao1992 ; Zhang1993 ; Milner1999 have been studied widely in the last two decades. The giant magnetoresistance (GMR) in these systems have been explained by elastic scattering of the conduction electrons on magnetic moments of differently aligned magnetic entities. Gittleman et al. have shown that in superparamagnetic granular alloys this consideration leads to a magnetoresistance proportional to the square of the magnetization.Gittleman1972 Deviations from this relation has been attributed to the size distribution of the magnetic scatterers.Hickey1995 ; Ferrari1997 and interactions between these scatterers Gregg ; Kechrakos ; Allia2003 Various assumptions on the form of the size distribution have been made in order to obtain a phenomenological description of the GMR phenomena in different granular systems.
In this paper we present a systematical study of the magnetic and magnetotransport properties of vacuum evaporated granular Fe-Ag structures. The observed large, negative non-saturating magnetic field dependence and the unusual sublinear temperature dependence () of the resistivity have been analyzed simultaneously. This allowed the separation of the various scattering processes and the identification of two characteristic grain size determining the macroscopic magnetic and transport properties without making any assumption on the grain size distribution.
II EXPERIMENTAL
The Fe-Ag multilayer samples were prepared by sequential vacuum
evaporation in a base pressure of Pa onto Si(1 1 1)
single crystal substrates at room temperature. The mass of the
deposited material was measured by a quartz oscillator and the
nominal layer thickness was calculated using the bulk density of
Fe and Ag. In this paper
specimens prepared with the following sequences are discussed:
(A) [Ag(2.6nm)/Fe(0.2nm)]75/Ag(2.6nm)
(B) [Ag(1.3nm)/Fe(0.2nm)]75/Ag(1.3nm)
(C) [Ag(0.8nm)/Fe(0.2nm)]75/Ag(0.8nm)
Structural characterization of the samples by X-ray diffraction indicated a nanometer scale grain size of the constituents [for details see Ref. 13], however, due to the strong overlap between the diffraction lines of bcc-Fe and fcc-Ag, a quantitative evaluation of the size of the magnetic Fe grains was not possible. The absence of peaks of the X-ray reflectivityBalogh2002 when the Fe layer thickness is less than nm is attributed to discontinuities of the Fe layers. This limit of the continuous layer regime is quite similar to that observed in other multilayer systems Rubinstein1994 ; Alphen1995 ; Babenneau2000 composed of transition metals with immiscible nonmagnetic elements and these kind of discontinuous multilayers are often referred to as granular multilayers Hylton1993 . The relation between the size of the grains in granular multilayers and the nominal layer thickness is generally determined by a three-dimensional growth process Daruka1997 and the average diameter of the grains can be much larger than the nominal layer thickness. It depends on the material parameters (e.g. lattice parameter mismatch, surface energy, etc.), as well as various parameters (deposition rate, substrate temperature, etc.) of the deposition technique. The decrease of the spacer layer thickness was found Balogh2005 to increase the magnetic grain size in an other series of Fe/Ag granular multilayer samples.
The magnetic structure of the samples was examined by a superconducting quantum interference device (SQUID) and by transmission Mössbauer spectroscopy. For the latter purpose the samples have been removed from the substrate and folded up to achieve an appropriate thickness for transmission measurements.
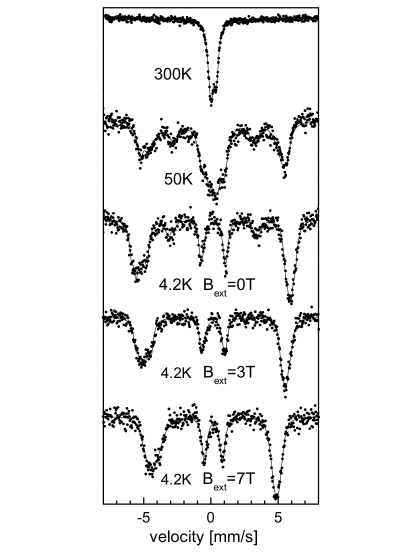
The largest GMR and the strongest magnetic scattering of the conduction electrons were observed in sample A, as it will be shown later. The 57Fe Mössbauer spectra of this sample taken at several temperatures are shown in Fig. 1. The room temperature spectrum contains a paramagnetic doublet with a large isomer shift relative to -Fe (0.18 mm/s) and a quadrupole splitting (0.45 mm/s) characteristic to a system of small Fe clusters embedded in an Ag matrix Sumiyama . The low temperature spectra show that the sample is superparamagnetic (SPM) and as the magnetic clusters gradually freeze below the blocking temperature (around 50K), the six-line pattern characteristic to the Zeeman splitting of the nuclear levels of 57Fe appears. At K the paramagnetic fraction is absent, but the spectral lines are much broader and the hyperfine parameters are different than those of bulk bcc-Fe. The 4.2 K spectrum could be fitted with a distribution of hyperfine fieldsVincze with an average value, T and standard deviation 2.4 T.
It is worth noting that the intensity ratios of the six lines indicate a significant spontaneous alignment of the magnetic moments. The intensity of the six lines of a sextet is distributed as , where is the intensity of the transitions, and is the angle between the direction of the gamma-ray (perpendicular to the sample plane) and the magnetic moment. In case of a random distribution of the magnetization directions . The observed small intensity, , indicates a close-to-perpendicular alignment of the magnetic moments with respect to the sample plane. Applying a magnetic field perpendicular to the sample plane could fully align the moments parallel to the field, as it is indicated by the intensity.
The spectra measured in external magnetic field were also fitted with a distribution of the hyperfine fields and the parameters obtained are: and 27.8 and and 2.4 T for and 7 T. The external magnetic field does not affect the width of the distribution indicating that it is not due to relaxation of the magnetic moments. The broad spectral lines of the observed sextet result from a distribution of the Fe neighborhoods, which can be due both to the large number of surface atoms in small grains and to non-equilibrium mixing of the elements Burgler during the growth process. The field-independent width and the decrease of the observed average hyperfine field in external field indicate the ferromagnetic alignment of the magnetic grains. The hyperfine field of a ferromagnet is decreased by the applied field, since it is oriented antiparallel to the magnetic moment. We note that at 4.2 K the statistical errors allow an SPM fraction containing less than 2 atomic % of the Fe atoms.
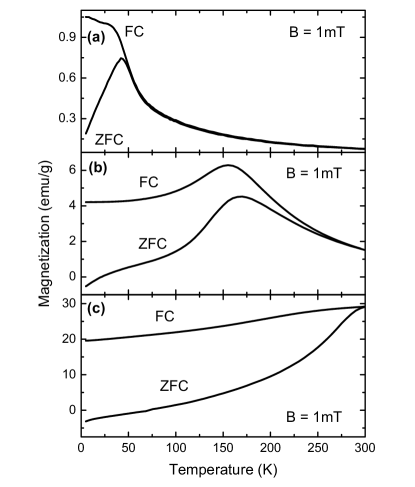
The freezing of the superparamagnetic moments – seen in the Mössbauer spectra – also appears in the temperature dependence of the low field susceptibility measured by the SQUID. Figure 2 shows the results for the 3 samples, after cooling them either in zero or in 1 mT permanent magnetic field. The blocking temperatures of about 40, 150 and 300 K for samples A, B and C, respectively can be deduced from this experiment. Sample A ( K) exhibits a textbook example for the superparamagnetic behavior. The maximum of the ZFC curve is more smeared out for samples B and C and in case of sample B the irreversibility temperature, where the FC curve starts to deviate from the ZFC one, is much larger than the defined by the ZFC maximum. Such features are generally explainedChantrell ; Binns as the effect of a grain size distribution and interaction among the magnetic particles, which obviously play a role as the average grain size and the concentration of the magnetic component increase.
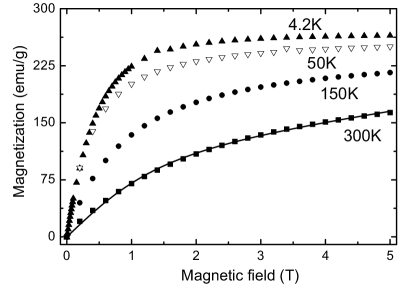
The magnetization versus applied magnetic field curves of sample A are shown in Fig. 3 up to T at four different temperatures. Above the blocking temperature the magnetization can quite well be describedKiss2001 by a single Langevin function, as expected for a superparamegnetic system of uniform grains. The average magnetic moment of the SPM grains deduced from the fit is 500 . It indicates that the bulk magnetic properties are mainly determined by the average size grains (about 1.8 nm) and the effect of the size distribution is negligible.


The magnetotransport measurements have been performed in the current in plane arrangement by four contact method. The coincidence of the parallel () and transversal () magnetoresistance and the absence of any anisotropic component is characteristic to the GMR phenomenon in granular systemsXiao1992 . The temperature dependence of the resistivity of samples A – C in zero and 12 T magnetic field normalized to their K values are displayed in Fig. 4. Contrary to ordinary metallic systems, the resistivity is sublinear above 40 K for each sample. Similar observation was reported by Milner et al. for granular systems,Milner1999 but only in presence of a high magnetic field. As discussed later in detail, the above qualitative feature of the zero field temperature dependencies signifies the presence of an extremely strong magnetic scattering in our samples.
The anomalous character of the curves is the most dominant in case of sample A. Simultaneously, this sample exhibits the largest magnetoresistance at low temperature, as shown in the bottom panel of Fig. 5. The magnitude of the GMR measured at K in a field of T is 26 %, 18 % and 16 %, for samples A, B and C, respectively. Note that at room temperature this order is reversed.
The magnetoresistance curves of the three samples have a common feature, they do not saturate even in high magnetic fields and at low temperatures, where the magnetization seems already to be saturated. This indicates that significant magnetic scattering takes place at magnetic entities much smaller than the typical grain size which determines the macroscopic magnetization. It is well known that the scattering amplitude of ferromagnetic grains embedded in a nonmagnetic metallic matrix is size dependent and the contribution of the smaller clusters is strongly enhanced.Zhang1993 The magnetic moments of these smaller clusters are harder to rotate by an applied magnetic field thus the saturation of the magnetoresistance is slower than that of the net magnetization arising dominantly from the larger grains. Note that similar behavior was found found in Fe-Ag co-deposited granular films Makhlouf as well as in many other systems (for a review see Batlle ). In the next section we give a more detailed analysis of the above qualitative picture.
III ANALYSIS
In order to identify the resistivity contribution of the magnetic scattering process we assume that the Matthiessen-rule can be applied, i.e the resistivity is composed of 3 terms:
| (1) |
Here denotes the residual resistivity, is the contribution arising from the phonon scattering, and the remaining part is attributed to the magnetic scattering. The separation of the latter term requires further assumptions.
Instead of making assumption on the shape of the grain size distribution functionHickey1995 ; Ferrari1997 we use physical considerations to get insight into the size distribution of the grains determining the magnetic scattering. It is based on the analysis of the temperature dependence of the resistivity measured in zero and high magnetic field, as shown in Figs. 6 and 7. In these limits the large grains – which dominate the bulk magnetic properties – do not give temperature dependent contribution to the magnetic scattering, as the system is either nonmagnetic (zero field limit, above the blocking temperature) or fully polarized ferromagnetically (high field limit). We will see that the small clusters can also be characterized by a single average size, and in high fields the temperature dependence of the magnetic scattering is determined solely by this characteristic size: the magnetic moment of these small clusters is the only fitting parameter for the calculated curves describing the shapes of shown in Fig. 8. Finally, the consistency of our analysis will also be demonstrated by evaluating the magnetic field dependence of the resistivity in the whole magnetic field range (Fig. 9) using the characteristic sizes determined independently from the magnetization data and the temperature dependence of the resistivity in the zero and high field limits.


In a granular system the magnetic scattering depends on the correlation between the localized magnetic moments of the grains, , while a conduction electron is scattered from to within its spin-diffusion lengthGittleman1972 . In zero magnetic field, well above the blocking temperature the magnetic moments of the grains (including the large grains) are fully disordered. In these circumstances no temperature dependence is expected from the magnetic scattering, at least until the spin diffusion length is large enough. We assume that at high temperatures the temperature dependence of the resistivity arise solely from the phonon contribution,
| (2) |
As the the phonon term is linear above the Debye temperature ( K)Milner1999 , the strength of phonon scattering, , can be determined from the high temperature slope of the zero field resistivity curves. The calculated curves are shown in Fig. 6 by dashed lines for the 3 samples. The difference of the total resistivity and its phonon related part is attributed to the magnetic scattering, and is displayed in Fig. 6 by dotted lines for each sample. As it was expected, the magnetic scattering is temperature independent at high temperatures and the lower the blocking temperature the wider is the flat part of the separated magnetic contribution curve. It is also seen that the magnetic scattering gradually decreases as the blocking temperature is approached from above. Note, however, that at K there is still a considerable contribution from it, i.e. as it can be seen from Fig. 4.
Since the phonon term is magnetic field independent, the curves determined from the zero field temperature dependencies can be used to separate the magnetic scattering contribution in the high field measurements. This is shown in Fig. 7 for the T measurements. A comparison of the related panels of Fig. 6 and Fig. 7 reveals that sample A has the strongest negative curvature of the resistivity and the biggest change in . In this sample magnetic scattering at T dominates over even the phonon term in a very broad temperature range.
In order to describe the evaluated curves we assume that in the high field limit the magnetic scattering of the spin-polarized electrons is proportional to the spin disorder of the small clusters. The magnetic moments of the large grains are fully aligned by the applied magnetic field, as it could be deduced from the Mössbauer spectra of Fig. 1. The spin disorder for a characteristic moment is described by the Brillouin-function:
| (3) | |||||
Here, and are the total spin and its -component of the scatterers, respectively.
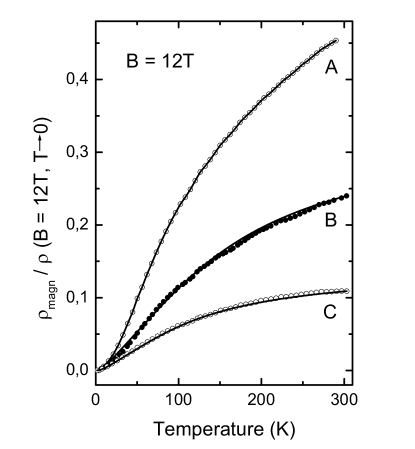
The fitted curves are shown in Fig. 8 by solid lines. Apart from a normalization factor, the only fitting parameter is the magnetic moment characteristic to the small Fe clusters. The good agreement of the experimental and the calculated curves indicates that the size distribution of these clusters is negligible. The fitted values are in the same order of magnitude for all the samples; , 17 and 12.5 for samples A – C respectively.
Next we discuss the magnetic field dependence of the resistivity of sample A, which exhibits the strongest magnetic scattering in the superparamagnetic state, where the process of magnetic saturation is well understood. For a numerical analysis we use the two characteristic sizes determined from the previous experiments. The Langevin fit to the magnetization experiments performed in the superparamagnetic temperature range has shown the presence of large grains with (Fig. 3), while the temperature dependence of the resistivity in high magnetic field indicated the presence of small clusters with . Following Gittleman’s model Gittleman1972 we describe the magnetoresistance by the field dependence of the correlation between the localized magnetic moments responsible for an initial and a final magnetic scattering process:
| (4) |
In case of the observed two largely different grain sizes this can be expressed as
| (5) | |||||
where is the Brillouin-function defined under Eq. 3 for the small iron clusters and is the Langevin-function, i.e. the classical limit of for the large Fe grains. The parameters , and represent the relative weights of scattering from grain to grain, between a grain and a cluster and from cluster to cluster.
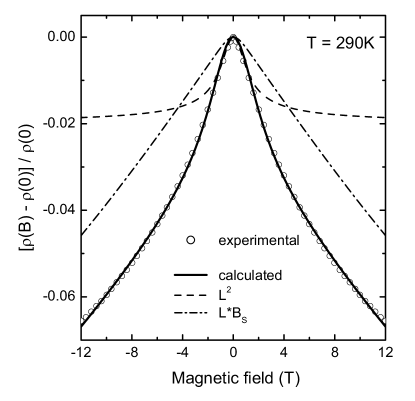
Figure 9 shows magnetoresistance for sample A in the superparamagnetic phase and the expected variation calculated by Eq. 5. The two characteristic magnetic moments ( 500 and 17 ) are determined in the previous analysis from independent experiments: the field and temperature dependence of the bulk magnetization, and the temperature dependence of the resistivity. The relative weights of the various processes were used as fitting parameters: , and . The value of , i.e the relatively weight for the graingrain scattering process is larger than , even though the amplitude of the grain scattering is small.Zhang1993 It reflects the large probability of scattering from grain to grain due to the large volume fraction of this type of magnetic scatterer. The direct interplay between the clusters is negligible, as expected for a small fraction (less than 2 %).
In Fig. 9 the dashed and the dashed-dotted lines represents the contribution of the two dominant scattering processes. The graingrain scattering process is the leading term in Eq. 5 up to 4 T magnetic field. The dashed line corresponds to the square of the magnetization, and if this would be the only scattering process the simple relationGittleman1972 of would hold. Above T, however, the second term of Eq. 5 dominates and the observed behavior can be attributed to the effect of the small clusters, not seen in the magnetization curves. The good description of the measured magnetization and resistance curves by two characteristic sizes is the consequence of the narrow size distributions of the grains and the clusters.
Bimodal distribution of the grain size has already been observed in granular systems prepared by co-deposition Gregg ; Franco ; Pogorelov , rapid quenching from the melt, Hickey , or layered growth Nouvertne ; Venus of the constituents. Since for our samples a non-saturating magnetoresistance indicates the presence of small clusters even in case of 25 nm thick continuous Fe layers Balogh2002SSC , we associate the large grains and the small culsters to Fe rich grains of the granular layers and small Fe clusters trapped inside the Ag layers, respectively. Intermixing of the layers can occur during the sample growth even when the heat of mixing is positive Burgler , like in the case of Fe and Ag. On the other hand, the tendency for non-equilibrium mixing does not seem to depend on the sample preparation method, since the magnetoresistance and the magnetic properties of our granular multilayers are very similar to those observed in co-depositied Makhlouf ; Wang1994 samples.
In our case for sample A the magnetic moments of the large grains and the small clusters differ more than an order of magnitude; 500 , and 17 . According to the Mössbauer spectroscopy measurements the small clusters contain only a small fraction (below 2 %) of the magnetic atoms. This explains why the bulk magnetization is determined by the properties of the large grains at all temperatures, while in the transport properties the magnetic scattering of small clusters also play an important role.
In case of sample B and C a broader grain size distribution is
indicated by the smeared out ZFC curves and to describe the
magnetic field dependence of the resistance would require further
parameters. Interactions between the grains are also likely to
play a role Kechrakos as the Fe concentration increases.
However, the temperature dependence of the resistivity measured in
12 T magnetic field is quite similar to that observed in sample A
(see Fig. 4) and the analysis of the magnetic scattering
contribution (Fig. 8) undoubtedly indicates that there is a
significant contribution from small clusters in these samples, as
well.
IV SUMMARY
In conclusion, we investigated the magnetic scattering processes in sequentially evaporated granular Fe-Ag films. Unusual magnetotransport features – like sublinear temperature dependence of the resistivity over a wide temperature range both in zero and 12 T magnetic fields and large, non saturating GMR – were found experimentally. The contribution of the magnetic scattering was separated and analyzed. The quantitative description suggests a granular system with bimodal size distribution of the magnetic components: coexisting large grains and small clusters. A detailed numerical analysis was given to determine characteristic grain- and cluster-moments, and their influence on both the scattering processes and on the macroscopic magnetization. The analysis reveals that scattering on the small clusters plays a dominant role in high magnetic fields over a wide temperature range.
ACKNOWLEDGEMENTS
Financial support of the Hungarian Research Founds OTKA TS049881, T034602 and T038383 are acknowledged.
References
- (1) M. N. Baibich, J. M. Broto, A. Fert, F. Nguyen Van Dau, F. Petroff, P. Etienne, G. Creuzet, A. Friederich, and J. Chazelas, Phys. Rev. Lett. 61, 2472 (1988).
- (2) T. Valet and A. Fert, Phys. Rev. B 48, 7099 (1993).
- (3) A. E. Berkowitz, J. R. Mitchell, M. J. Carey, A. P. Young, S. Zhang, F. E. Spada, F. T. Parker, A. Hutten, and G. Thomas, Phys. Rev. Lett. 68, 3745 (1992).
- (4) J. Q. Xiao, J. S. Jiang, and C. L. Chien, Phys. Rev. Lett. 68, 3749 (1992).
- (5) S. Zhang and P. M. Levy, J. Appl. Phys. 73, 5315 (1993).
- (6) A. Milner, I. Ya. Korenblit, and A. Gerber, Phys. Rev. B 60, 14821 (1999).
- (7) J. I. Gittleman, Y. Goldstein, and S. Bozowski, Phys. Rev. B 5, 3609 (1972).
- (8) B. J. Hickey, M. A. Howson, S. O. Musa, and N. Wiser, Phys. Rev B 51, R667 (1995).
- (9) E. F. Ferrari, F. C. S. da Silva, and M. Knobel, Phys. Rev. B 56, 6086 (1997).
- (10) J. F. Gregg, S. M. Thompson, S. J. Dawson, K. Ounadjela, C. R. Staddon, J. Hamman, C. Fermon, G. Saux, and K. O’Grady, Phys. Rev. B 49, 1064 (1994).
- (11) D. Kechrakos and K. N. Trohidou, Phys. Rev. B 62, 3941 (2000).
- (12) P. Allia, M. Coisson, J. Moya, V. Selvaggini, P. Tiberto, and F. Vinai, Phys. Rev. B. 67, 174412 (2003).
- (13) J. Balogh, D. Kaptás, T. Kemény, L. F. Kiss, T. Pusztai, and I. Vincze, Hyperfine Interact. 13, 141 (2002).
- (14) M. Rubinstein, J. Tejada, and X. Zhang, J. Appl. Phys. 75, 6557 (1994).
- (15) E. A. M. van Alphen, and W. J. M. de Jonge, Phys. Rev. B 51, 8182 (1995).
- (16) D. Babonneau, F. Petroff, J. L. Maurice, F. Fettar, and A. Vaures, Appl. Phys. Lett. 76, 2892 (2000).
- (17) T. L. Hylton, K. R. Coeffy, M. A. Parker, and J. K. Howard, Science. 261, 1021 (1993).
- (18) I. Daruka, and A. L. Barabási, Phys. Rev. Lett. 79, 3708 (1997).
- (19) J. Balogh, D. Kaptás, L. F. Kiss, T. Pusztai, E. Szilágyi, Á. Tunyogi, J. Swerts, S. Vandezande, K. Temst, and C. Van Haesendonck, cond-mat/0502578.
- (20) K. Sumiyama, Vacuum 41, 1211 (1990).
- (21) I. Vincze, Solid State Communications 25, 689 (1978).
- (22) D. E. Bürgler, C. M. Schmidt, D. M. Schaller, F. Meisinger, R. Hofer, and H. J. Güntherodt, Phys. Rev. B 56, 4149 (1997).
- (23) R. W. Chantrell, N. Walmsley, J. Gore, and M. Maylin Phys. Rev. B 63, 024410 (2001).
- (24) C. Binns, M. J. Maher, Q. A. Pankhurst, D. Kechrakos, and K. N. Trohidou, Phys. Rev. B66, 184413 (2002).
- (25) L. F. Kiss, J. Balogh, L. Bujdosó, D. Kaptás, T. Kemény, T. Pusztai, and I. Vincze, Materials Science Forum 360-362, 505 (2001).
- (26) S. A. Makhlouf, K. Sumiyama, and K. Suzuki, Jpn. J. Appl. Phys. 33, 4913 (1994).
- (27) X. Batlle, and A. Labarta, J. Phys. D: Appl. Phys. 35, R15 (2002).
- (28) V. Franco, X. Batlle, and A. Labarta, J. Appl. Phys. 85, 7328 (1999).
- (29) Yu. G. Pogorelov, G. N. Kakazei, J. B. Sousa, A. F. Kravets, N. A. Lesnik, M. M. Pereira de Azevedo, M. Malinowska, and P. Panissod, Phys. Rev B 60, 12200 (1999).
- (30) B. J. Hickey, M. A. Howson, S. O. Musa, G. J. Tomka, B. D. Rainford, and N. Wiser, J. Magn. Magn. Mater. 147, 253 (1995).
- (31) F. Nouvertné, U. May, M. Bamming, A. Rampe, U. Korte, G. Güntherodt, R. Pentcheva, and M. Scheffler, Phys. Rev. B 60, 14382 (1999).
- (32) D. Venus, F. Hunte, I. N. Krivorotov, T. Gredig, and E. Dan Dahlberg, J. Appl. Phys. 93, 8609 (2003).
- (33) J. Balogh, L.F. Kiss, A. Halbritter, I. K zsmárki, and G. Mihály, Solid State Communications 122, 59 (2002).
- (34) J-Q. Wang and G. Xiao, Phys. Rev. B 49, 3982 (1994).