Phonon anomalies and charge dynamics in Fe1-xCuxCr2S4 single crystals
Abstract
A detailed investigation of phonon excitations and charge carrier dynamics in single crystals of Fe1-xCuxCr2S4 () has been performed by using infrared spectroscopy. In FeCr2S4 the phonon eigenmodes are strongly affected by the onset of magnetic order. Despite enhanced screening effects, a continuous evolution of the phonon excitations can be observed in the doped compounds with (metallic) and (bad metals), but the effect of magnetic ordering on the phonons is strongly reduced compared to . The Drude-like charge-carrier contribution to the optical conductivity in the doped samples indicates that the colossal magneto-resistance effect results from the suppression of spin-disorder scattering.
pacs:
72.15.-v, 72.20.-i, 78.30.-j, 75.30.VnI Introduction
The discovery of colossal magnetoresistance (CMR) in perovskite-type manganites has attracted considerable attention.Kusters378 ; Jirak374 ; Von360 ; Chahara371 ; Jin373 Double-exchange (DE) mechanism, Zener365 ; Millis362 strong electron-phonon coupling, Millis362 phase separation scenarios Mayr387 or a Griffiths singularity Salamon were suggested to clarify the origin of the CMR effect, but a conclusive microscopic model has not yet been established. Ever since, the occurrence of CMR effects has been reported for various other classes of materials, such as pyrochlores,Shimakawa96 rare-earths based compounds like GdI2,Felser99 and ternary chalcogenide spinels Cr2S4.Ramirez255 These CMR materials have been classified in terms of spin-disorder scattering and a universal dependence of the magnetoresistence vs. carrier density has been suggested on theoretical grounds.Majumdar98 ; Gomez-Santos04
Ramirez et al. drew attention to the spinel system Fe1-xCuxCr2S4 in 1997.Ramirez255 In polycrystalline FeCr2S4 with K, the CMR effect reaches values comparable to those observed in perovskite oxides. The substitution of Fe by Cu increases to temperatures above room temperature, and the CMR effect remains relatively strong (7 %).Ramirez255 In addition, solid solutions of the ferrimagnetic semiconductor FeCr2S4 and the metallic ferromagnet CuCr2S4 show a number of puzzling properties: From the very beginning, a controversial discussion has been arising whether the Cu ions are mono- or divalent for .Lotgering380 ; Goodenough110 ; Kurmaev379 For it was established that only monovalent and hence diamagnetic () Cu exists in the mixed crystals.Tsurkan32 Moreover, Fe1-xCuxCr2S4 shows two metal-to-insulator transitions as a function of , as the room-temperature resistivity reveals two minima at and and concomitantly the Seebeck coefficient changes sign two times.Lotgering380 ; Haacke Additionally, band-structure calculations predicted that the Fe1-xCuxCr2S4 system should exhibit a half-metallic nature.Pickett01 ; Park213 ; Kurmaev379
Recent experimental investigations of Fe1-xCuxCr2S4 single crystals indicated a strong dependence of their magnetic and magneto-transport properties on hydrostatic pressure suggesting a strong magneto-elastic coupling.Tsurkan347 ; Fritsch395 Measurements on the ac susceptibility in pure FeCr2S4 exhibited a cusp in the low-field magnetization and the onset of magnetic irreversibilities at 60 K was explained by domain-reorientation processes.Tsurkan346 Later on, ultrasonic studies indicated an anomaly in the temperature dependence of the shear modulus close to 60 K, and it was suggested that the onset of orbital order induces a structural distortion at this temperature.Maurer396 This result, however, is hardly compatible with the observation that orbital order is established in polycrystals close to 10 K, while an orbital glass state is found in single crystals.Fichtl04
Optical spectroscopy simultaneously probes the lattice and electronic degrees of freedom and is, therefore, ideally suited to investigate structural phase transitions and to clarify the importance of electron-phonon coupling for the CMR effect.Hartinger04 Earlier infrared (IR) studies in polycrystalline FeCr2S4 reported, in accordance with the crystal-lattice symmetry , the existence of four IR-active phonons, which strongly depend on temperature near and below .Lutz375 ; Wakamura351 We performed measurements of the optical properties of single crystals of Fe1-xCuxCr2S4 ( and 0.5) to shed light on the interplay of structural and electronic properties in these compounds. Since the optical properties of the samples with and were found to be very similar, we only show and discuss the corresponding data for in the following.
II Experimental details
Single crystals of Fe1-xCuxCr2S4 were grown using a chemical transport-reaction method with chlorine as transport agent and the ternary polycrystals as starting material. Details of the sample preparation are described elsewhere.Kurmaev379 No indication for the existence of secondary phases was found by x-ray diffraction analysis of powdered single crystals. X-ray single-crystal analysis confirmed the high structural homogeneity of the samples. The composition and homogeneity of the samples were examined by electron-probe microanalysis. The samples were optically polished platelets with dimensions of about mm3. Structural, magnetic and electrical transport data are given in Ref. Fritsch395, .
Two Fourier-transform-infrared spectrometers with a full bandwidth of 10 to 8000 cm-1 (Bruker IFS 113v) and 500 to 42000 cm-1 (Bruker IFS 66v/S) together with a 4He cryostat (Oxford Optistat) were used for measurements of the optical reflectivity in the energy range from 70 to 30000 cm-1 due to small sample dimensions and for temperatures of . In order to investigate small fractions of the sample surface in the range of 0.1 mm2 we utilized an IR microscope (Bruker IRscope II), which works in the far- (FIR) and mid-infrared (MIR) range.
III Experimental results and discussion
III.1 Phonon excitations
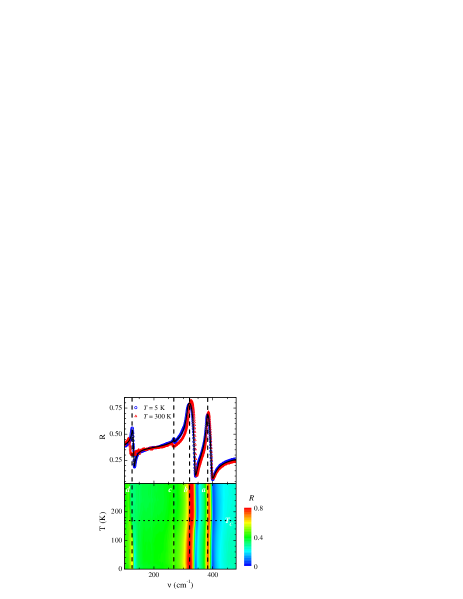
Figure 1 shows the temperature dependence of the FIR reflectivity vs. wave number of pure FeCr2S4. In the upper panel is plotted for 5 and 300 K. The four visible phonon peaks are attributed to the four IR-active modes (symmetry group , #227).Lutz375 To analyze the spectra, we used a 4-parameter fit assuming frequency-dependent damping constants to account for the asymmetry of the phonon peaks. This fitting procedure infers a splitting of the longitudinal and transverse eigenfrequencies, and , and the corresponding damping constants, and . Berreman392 The resulting curves describe the measured reflectivity down to 100 cm-1 very well, without assuming an additional contribution of free charge carriers. A representative result of these fits is shown by the solid line in the upper panel of Fig. 1 for K. The detailed temperature dependence of the reflectivity is visualized in the two-dimensional (2D) contour plot in the lower panel of Fig. 1. To enable a comparison of the phonon shift, the peak positions (maxima in ) for K are indicated as vertical lines. Around K a shift of the phonon frequencies can be observed, especially for the mode close to 100 cm-1. The intensity of this mode strongly depends on temperature, too (see upper frame of Fig. 1).
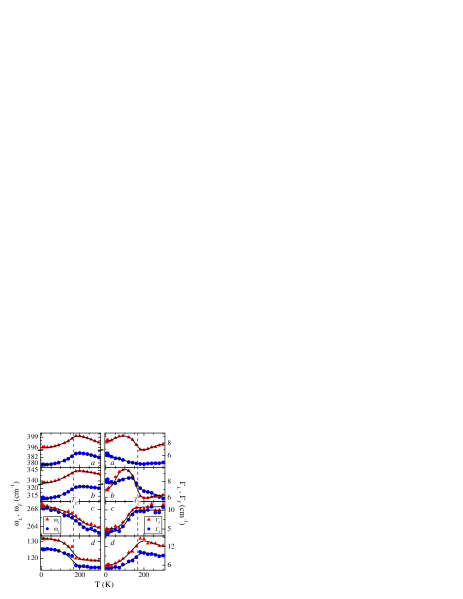
The resonance frequencies and (left frames) and the corresponding damping rates and (right frames) are shown in Fig. 2 as a function of temperature. Above the Curie temperature K, the resonance frequencies and of all modes reveal a similar quasi-linear increase with decreasing temperature, which can be fully ascribed to anharmonic contributions to the lattice potential.Wakamura383 In contrast to the rather usual behavior in the paramagnetic regime, modes and soften for temperatures below , while and increase towards lower temperatures in the case of modes and . These anomalous changes of the eigenfrequencies in the vicinity of suggest a correlation with the onset of magnetic order. However, it has to be stated that the size of the effect is different for the observed modes: KK is of the order of % for the internal mode , % for the bending mode , approximately % for the bending mode , and % for the stretching mode . Longitudinal and transverse eigenfrequencies behave rather similar.
The influence of magnetic order on phonons in magnetic semiconductors has been proposed by Baltensperger and HelmanBaltensperger26 and BaltenspergerBaltensperger27 more than 30 years ago, and has recently been used by Sushkov et al. to describe the phonon spectra in ZnCr2O4.Sushkov04 Based on a model calculation, where superexchange interaction between the magnetic ions infers a spin-phonon coupling, relative frequency shifts up to 10-2 have been predicted. The order of magnitude of this effect corresponds nicely to the experimentally observed values in FeCr2S4 and, therefore, WakamuraWakamura351 considered this mechanism to dominate the phonons’ behavior for . Subsequently, Wakamura and coworkersWakamura383 ; Wakamura discussed the sign of the relative frequency shift in terms of nearest-neighbor FM exchange and next-nearest-neighbor AFM exchange for CdCr2S4, which exhibits phonon modes with a similar temperature dependence as FeCr2S4. Moreover, they could show that these anomalous changes in the phonon frequencies are absent in non-magnetic CdIn2S4, further corroborating their approach.Wakamura Thus, the positive shift of modes and would indicate that FM exchange (Cr-S-Cr) dominates in accordance with a strong influence of the (Cr-S) force constants on these modes, and, correspondingly, the negative shift of modes and favors AFM exchange (Cr-S-Cd-S-Cr) with a strong influence of the (Cd-S) force constants. Note that a more rigorous theoretical treatment of anharmonic spin-phonon and phonon-phonon interactions in cubic spinels by Wesselinova and ApostolovWesselinova96 confirms the above interpretation. In FeCr2S4 the interpretation of the effect of magnetic ordering on the IR active phonon modes becomes even more complicated, because there exist, besides FM nearest-neighbor Cr-S-Cr bonds, additional exchange paths via AFM Fe-S-Fe and Fe-S-Cr-S-Fe bonds. Nevertheless, the overall temperature behavior of the phonon frequencies in FeCr2S4 is similar to CdCr2S4 and may be well interpreted, accordingly. Note, however, that a critical discussion of the above approach is given by Bruesch and d’Ambrogio.Bruesch
A straightforward interpretation of the temperature dependence of the damping constants (right panel of Fig. 2) is not obvious at all. Again, considering only the anharmonicity of ionic non-magnetic crystals, the damping is expected to show some residual low-temperature value and a quasi-linear increase in the high-temperature limit, just as observed for the longitudinal damping constants of modes and for .Wakamura351 However, the temperature dependence of and in general deviates from such a behavior: In the case of mode both damping constants show a broad maximum just above and a steep decrease towards lower temperature for . Mode follows a similar temperature dependence for , but the reduction of the damping constants is slightly smaller, and in the paramagnetic regime and remain almost constant in contrast to the results of Wakamura.Wakamura351 The behavior of modes and for appears even more complex, but one can identify the onset of enhancement damping close to K followed by broad cusp-like maxima close to 100 K, except for of mode that increases linearly with decreasing temperatures.
WakamuraWakamura351 argues that the maxima of mode (and ) are due to spin fluctuations of the Fe spins, in agreement with the strong influence of the corresponding force constant on this mode according to Bruesch and d’Ambrogio. Bruesch Furthermore, long range spin order assumingly leads to the anomalous changes of the damping constants for all modes below . In comparison to the temperature dependences of the damping constants in CdCr2S4, one finds that modes and behave similar to the case of FeCr2S4.Wakamura383 On the other hand, modes and in FeCr2S4 clearly reveal a more complex behavior than in CdCr2S4, indicating a significant influence of the iron sublattice and the additional effective exchange coupling between Fe-Fe and Fe-Cr ions on these modes.
Additionally, we want to mention the large increase in intensity (about 20 %) for mode (close to 120 cm-1) when cooling from room temperature to 5 K (see Fig. 1). The intensity remains almost constant above 200 K, while a linear increase with decreasing temperature is observed below 200 K. At this temperature, maxima appear in the temperature dependence of the damping constants, suggesting a correlation of the two phenomena with regard to the spin-fluctuation scenario discussed above.
When adopting the overall interpretation of the data in terms of spin-phonon coupling, one has to consider, however, that e.g. the appearance of the cusps in the damping constants may be connected to domain reorientation processes visible in the ac susceptibilityTsurkan346 and anomalies detected by ultrasonic investigations.Maurer396 Although the absence of significant changes of the phonon frequencies contradicts the scenario of a structural phase transition at 60 K driven by orbital ordering as suggested in Ref. Maurer396, , it becomes clear that the complex mechanisms dominating the damping effects demand further theoretical studies to single out the important contributions in detail.
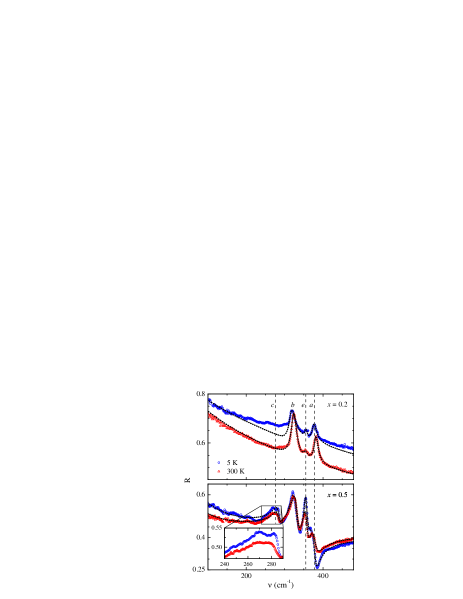
Having discussed the phonon properties of pure FeCr2S4 we now turn to the temperature dependence of the phonon modes for Fe1-xCuxCr2S4. Figure 3 shows the FIR reflectivity for (upper panel) and (lower panel) for temperatures 5 K and 300 K each. The results for are very similar to those obtained for and, hence, only the data for is shown and discussed. The reflectivity of both samples, and 0.5, shows a Drude-like contribution due to the presence of free charge carriers, while FeCr2S4 can be described as an insulator. The highest Drude-like conductivity is found for and the phonon modes are on the verge of being fully screened. For both compounds the internal mode at cm-1 (see Fig. 1 for the pure compound) can hardly be detected. Focusing on the group of external modes, a new mode appears close to cm-1, while on increasing Cu concentration mode at cm-1 becomes considerably reduced in intensity. Without an accompanying lattice dynamical calculation one cannot decide, if this new mode represents an impurity mode due to the doping with Cu or a symmetry change. There are reports in literatureLotgering380 ; Palmer384 claiming the reduction of symmetry to because of the ordering of Fe and Cu ions on the A sublattice.
In this case seven IR-active phonon modes are predicted. Assuming that the peak close to 275 cm-1 (mode ) is generated by two single phonon modes (see inset in Fig. 3), five modes are visible, only, while the internal mode close to cm-1 remains screened. However, our results rather point toward a continuous evolution of the phonon modes on increasing and favor a statistical A-site distribution of Cu and Fe ions throughout the lattice instead of a symmetry reduction resulting from a superstructure due to an ordered A sublattice.
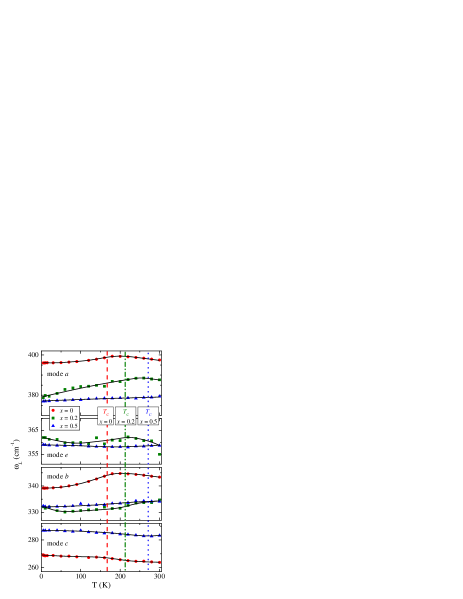
We tried to fit the complete spectra taking into account the reflectivity up to 10000 cm-1, using a 4-parameter fit for the phonon modes and a Lorentz oscillator for the mid-infrared excitation at about cm-1 (see next section). Representative results of these fits at low wave numbers are shown in Fig. 3 as dashed lines. The temperature dependences of the longitudinal modes as derived from these fits are shown in Fig. 4 together with corresponding data for . The transverse eigenfrequencies behave rather similar (not shown). Compared to the sample with , the temperature dependence of the damping constants in the doped compounds is weak and therefore not shown here either. Regarding the sample with similar anomalies as in pure FeCr2S4 can be seen in the vicinity of for the observable modes , and . Obviously, the temperature dependence of all phonon frequencies for is very weak and no clear anomalies around are visible. Within the experimental uncertainties one can detect a slight decrease of towards lower temperatures except for mode , which behaves similarly to the case of FeCr2S4 (compare Fig. 2).
Keeping in mind the influence of spin fluctuations and spin-phonon coupling on the phonon properties in FeCr2S4, Cu-doping seems to reduce these features significantly. This observation is in agreement with reduced spin-orbit coupling due to the substitution of Jahn-Teller active Fe2+ by non Jahn-Teller active Fe3+. Therefore, for only Fe3+ with a half-filled -shell is present in the systemLang00 ; Kurmaev379 and the system becomes almost magnetically isotropic as it was confirmed by ferromagnetic resonance experiments.Fritsch395
III.2 Dynamic conductivity and electronic excitations
When the reflectivities of the doped compounds with Cu concentrations and 0.5 (Fig. 3) are compared with that of pure FeCr2S4 it becomes clear that contributions from free charge carriers have to be taken into consideration. The metallic-like behavior is most significant for , but it becomes reduced again on further doping. For a consistent description of the Drude-type behavior of the doped compounds, it is important to measure the reflectivity spectra to higher energies. The room-temperature reflectivities of Fe1-xCuxCr2S4 for and 0.5 are plotted in the upper panel of Fig. 5 up to 3104 cm-1, corresponding to almost 4 eV, and are compared to the reflectivity of insulating FeCr2S4. For the Kramers-Kronig analysis of the smoothed reflectivity data we used a low-frequency Hagen-Rubens extrapolation and a high-frequency extrapolation with a power law up to 106 cm-1 and a subsequent high-frequency tail. The resulting dynamic conductivities are shown in the lower panel of Fig. 5. We carefully checked the high-frequency extrapolation, also trying smoother extrapolations, but found that the results are not influenced in the relevant energy range below 20000 cm-1. The use of a Hagen-Rubens extrapolation is justified by the fact that we have the complete information on the absolute values of the dc conductivities and the corresponding temperature dependences for all compounds, although we are aware of the additional uncertainties originating from the Hagens-Rubens extrapolation, specifically for the sample with . However, the best fits of the reflectivity at room temperature, even in the limited spectral range, yielded dc conductivities of 150 (cm)-1 for and 35 (cm)-1 for , close to the dc values derived from the 4-probe measurements on single crystals by Fritsch et al. Fritsch395
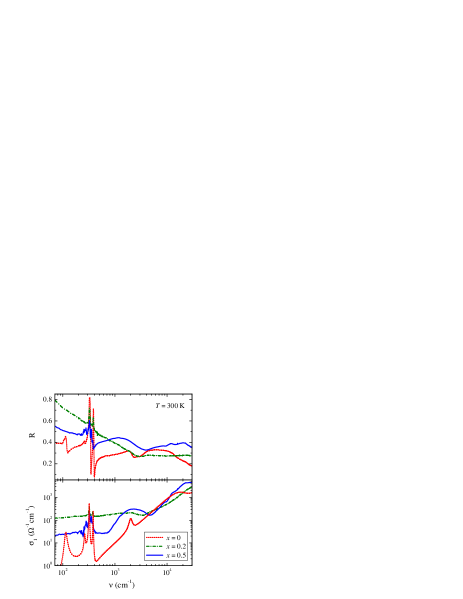
For a weak but well defined electronic transition is observed close to cm-1 and a further transition appears close to 20000 cm eV). On substituting iron by copper, metallic behavior shows up and for Fe0.8Cu0.2Cr2S4 the dc conductivity is of the order 150 (cm)-1. The transition at cm-1, becomes almost fully suppressed for . Obviously, the -electrons become strongly delocalized. It is generally accepted that in an ionic picture monovalent Cu is substituted inducing trivalent Fe. Our results suggest that the system behaves as if holes are doped into an insulator driving the compound into a metallic regime. Unexpectedly, a broad peak appears again close to 2500 cm-1 for .
The observed doping dependence of the conductivity spectra as documented in Fig. 5 can be compared with band-structure calculations of these compounds. Lang00 ; Park213 ; Kurmaev379 Local spin-density approximation (LSDA) band-structure calculations predict a half-metallic ground state of FeCr2S4, with a partly filled band at the Fermi level. Correlation effects via LSDA+U yield a splitting of the Fe band into a lower and upper Hubbard band characterizing FeCr2S4 as a Mott-Hubbard insulator.Park213 The splitting of the band is of the order of about 0.5 eV, and, hence, the peak close to 2000 cm-1 may be interpreted as a transition between the lower and upper Hubbard band. Accordingly, the high-energy excitation can be attributed to a Cr(3d) to Fe(3d) transition.
Using an ionic picture with localized Fe states, alternatively, the transition at 2000 cm-1 may correspond to a transition between the lower doublet and the triplet of the Fe -states split in a tetrahedral crystal-field. The expected crystal-field splitting for Fe2+ located in the tetrahedral site of the spinel structure is rather weakAbragam70 and a splitting of the order cm-1 seems reasonable. Further support for this interpretation comes from the observation of crystal-field transitions as measured for diluted Fe2+ in CdIn2S4. Here a crystal-field splitting of approximately 2500 cm-1 has been reported by Wittekoek et al.Wittekoek397
The appearance of the broad excitation for in the mid-infrared region at about 2500 cm-1, however, cannot be explained easily. In an ionic picture only trivalent iron and monovalent copper are expected for ,Lotgering380 ; Goodenough110 and recent x-ray photoelectron spectroscopy Tsurkan32 strongly favors the existence of only monovalent Cu for . Therefore, one can exclude the possibility that the broad excitation may be attributed to Fe2+ similarly to the well-defined electronic excitation for . Nevertheless, it has been concluded from Mössbauer experiments in Fe1-xCuxCr2S4, that an ionic picture is not applicable at all. Haacke2 For and the complicated Mössbauer spectra indicate two different Fe sites corresponding to Fe2+ and Fe3+, while for a single line pointed towards a fast electron exchange between these two sites. For the line pattern for evidenced the existence of Fe3+ and a strong delocalization of the Cu -derived electrons. Hence, further studies beyond the scope of this paper are needed to clarify the nature of this mid-infrared excitation.
In the following we will discuss the optical conductivity results in the low frequency range in comparison with the dc conductivity data reported in Ref. Fritsch395, . The room-temperature spectra for the concentrations and 0.5, shown in Fig. 5 have been used to estimate the Drude-like conductivity. For all temperatures, the spectra could satisfactorily be described using a plasma frequency cm-1 and a dielectric constant for , which is close to the value for . For we used cm-1 and an enhanced dielectric constant . The enhanced indicates strong changes in the electronic excitation spectrum at higher frequencies, but due to the complexity of the spectrum in this energy region there is also a larger uncertainty in for . The decrease of the plasma frequency by a factor of 2.4 can be explained by a decrease of the charge carrier density, as Fe1-xCuxCr2S4 approaches a metal-to-insulator transition close to . With these values, the conductivity below 500 cm-1 could reasonably be fitted for all temperatures as indicated by the dashed lines in Fig. 3 for the spectra at 5 K and 300 K.
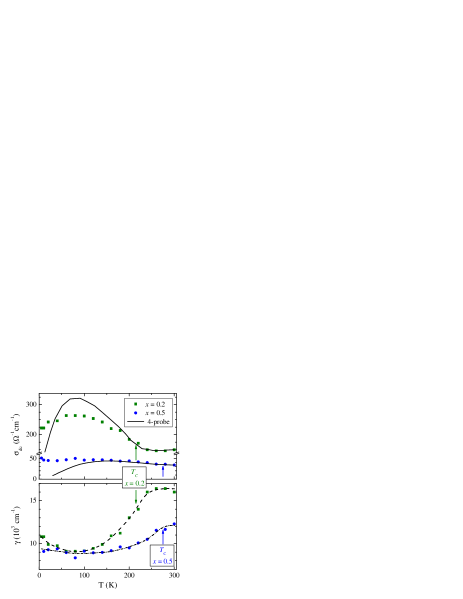
The resulting temperature dependences of the dc conductivity (upper panel) and relaxation rates (lower panel) are shown in Fig. 6. The dc conductivities as derived from 4-probe measurementsFritsch395 are indicated by solid lines. The dc conductivities were scaled at room temperature, utilizing a factor of 1.6 for and a factor of 1.05 for . Above 100 K the 4-probe dc results and the dc values as derived from the optical measurements follow a similar temperature dependence. However, at low temperatures the dc measurements are dominated by localization effects, which appear much weaker in the high-frequency (cm-1) derived optical data. That localization effects are most significant in the low-frequency (”dc”) transport measurements becomes clear from the fact that in doped semiconductors the conductivity below the FIR regime increases almost linearly with frequency. Lunkenheimer In the sample with , which exhibits the lower conductivity, localization effects dominate already at higher temperatures. This may be attributed to a significant decrease of the charge-carrier density and concomitant increase of disorder due to the statistical distribution of the Cu ions in the lattice,Lang00 further discarding the possibility of -site order of Fe and Cu for Fe1-xCuxCr2S4.
Finally, we want to draw attention to the temperature dependence of the relaxation rate (lower panel of Fig. 6). In the magnetically ordered state below , the relaxation rates become significantly reduced, e.g. the reduction amounts to almost 50% for . We recall that the plasma frequency has been kept constant for each compound as a function of temperature. This indicates that the increase of the conductivity just below the magnetic ordering temperature results from the freezing-out of disorder scattering and not from a change of the carrier density via band-structure changes at the onset of ferrimagnetic order. Taking into account the classification of chalcogenide spinels Cr2S4 as systems where CMR originates from spin-disorder scattering,Majumdar98 the observed reduction of the relaxation rate below has to be regarded as direct evidence of such a scenario: In external fields the onset of ferrimagnetic order shifts to higher temperatures. Concomitantly, a reduction of the scattering rate and the anomalous increase of the conductivity arise. As a consequence, maximal CMR effects will show up just below as a function of an external magnetic field. A similar scenario has been reported for GdI2, where the magnetic and magneto-transport properties have been described successfully in terms of spin-fluctuations and their suppression by external magnetic fields in the vicinity of .Eremin01 ; Deisenhofer04 We would like to point out, that at low temperatures the relaxation rates for and are of the same order of magnitude cm-1, indicating a similar level of disorder for the Cu doped compounds.
IV Summary
In summary, we investigated the optical properties of Fe1-xCuxCr2S4 single crystals for Cu concentrations , 0.2, 0.4 and 0.5. Phonon excitations and dynamic conductivity for are very similar to the results for Fe0.5Cu0.5Cr2S4 and were not discussed separately. The phonon excitations were measured as a function of temperature between 5 K and room temperature. Pure FeCr2S4 shows clear anomalies in the eigenfrequencies at the transition from the paramagnetic to the ferromagnetic state, which can be explained by spin-phonon coupling. Concerning the complex behavior of the damping constants, spin fluctuations in the vicinity of may describe many of the anomalous changes, but further theoretical studies are necessary to corroborate this interpretation. The influence of magnetic order on the eigenmodes is reduced with increasing , and the appearance of a new phonon mode close to 350 cm-1 is attributed to an impurity mode rather than to a symmetry reduction due to A-site order.
Morover, the charge dynamics of Fe1-xCuxCr2S4 were investigated. FeCr2S4 is an insulator, but becomes metallic when slightly doped with Cu. The conductivity of the free charge carriers can be described by a normal Drude-type behavior. The dc conductivity for is enhanced by a factor of four in comparison to . The temperature dependence of the optically derived dc conductivity for both doped compounds is is in good agreement with resistivity measurements, but localization effects at lowest temperatures appear weaker in the optical measurements. The corresponding behavior of the scattering rate, which shows a strong decrease below the ferrimagnetic phase transition, evidences the freezing-out of disorder scattering below . In accordance with the proposed classification of the ternary chalcogenide spinels as spin-disorder magnetoresistive materials, the reduction of the relaxation rate corroborates such a scenario and makes clear that spin-disorder has to be considered a necessary ingredient towards a theoretical description of this fascinating class of materials.
Acknowledgements.
It is a pleasure to thank H.-A. Krug von Nidda, J. Hemberger, and Ch. Hartinger for fruitful discussions. This work was partly supported by the DFG via the Sonderforschungsbereich 484 (Augsburg), by the BMBF/VDI via the Contract No. EKM/13N6917/0, by the U.S. Civilian Research & Development Foundation (CRDF) and by the Moldavian Research & Development Association (MRDA) via Grant No. MP2-3047.References
- (1) R. M. Kusters, J. Singleton, D. A. Keen, R. McGreevy, and W. Hayes, Physica B 155, 362 (1989).
- (2) Z. Jirák, S. Krupička, Z. Šimša, M. Dlouhá, and S. Vratislav, J. Magn. Magn. Mater. 53, 153 (1985).
- (3) R. von Helmolt, J. Wecker, B. Holzapfel, L. Schultz, and K. Samwer, Phys. Rev. Lett. 71, 2331 (1993).
- (4) K. Chahara, T. Ohno, M. Kasai, and Y. Kozono, Appl. Phys. Lett. 63, 1990 (1993).
- (5) S. Jin, T. H. Tiefel, M. McCormack, R. A. Fastnacht, R. Ramesh, and L. H. Chen, Science 264, 413 (1994).
- (6) C. Zener, Phys. Rev. 82, 403 (1951).
- (7) A. J. Millis, P. B. Littlewood, and B. I. Shraiman, Phys. Rev. Lett. 74, 5144 (1995).
- (8) M. Mayr, A. Moreo, J. A. Vergés, J. Arispe, A. Feiguin, and E. Dagotto, Phys. Rev. Lett. 86, 135 (2001).
- (9) M. B. Salamon, P. Lin, and S. H. Chun, Phys. Rev. Lett. 88, 197203 (2002).
- (10) Y. Shimakawa, Y. Kubo, and T. Manako, Nature 379, 53 (1996).
- (11) C. Felser, K. Ahn, R.K. Kremer, R. Seshadri, and A. Simon, J. Solid State Chem. 147, 19 (1999).
- (12) A. P. Ramirez, R. J. Cava, and J. Krajewski, Nature 386, 156 (1997).
- (13) P. Majumdar and P. Littlewood, Nature 395, 479 (1998).
- (14) G. Gomez-Santos, S. Fratini, and F. Guinea, Phys. Rev. B 70, 184420 (2004).
- (15) F. K. Lotgering, R. P. Van Stapele, G. H. A. M. Van Der Steen, and J. S. Van Wieringen, J. Phys. Chem. Solids 30, 799 (1969).
- (16) J. B. Goodenough, J. Phys. Chem. Solids 30, 261 (1969).
- (17) E. Z. Kurmaev, A. V. Postnikov, H. M. Palmer, C. Greaves, St. Bartkowski, V. Tsurkan, M. Demeter, D. Hartmann, M. Neumann, D. A. Zatsepin, V. R. Galakhov, S. N. Shamin, and V. Trofimova, J. Phys.: Condens. Matter 12, 5411 (2000).
- (18) V. Tsurkan, M. Demeter, B. Schneider, D. Hartmann, and M. Neumann, Solid State Commun. 114, 149 (2000).
- (19) G. Haacke, and L. C. Beegle, J. Appl. Phys. 39, 656 (1968).
- (20) W. E. Pickett, and J. S. Moodera, Phys. Today 54, 39 (2001).
- (21) M. S. Park, S. K. Kwon, S. J. Youn, and B. I. Min, Phys. Rev. B 59, 10018 (1999).
- (22) V. Tsurkan, I. Fita, M. Baran, R. Puzniak, D. Samusi, R. Szymczak, H. Szymczak, S. Klimm, M. Klemm, S. Horn, and R. Tidecks, J. Appl. Phys. 90, 875 (2001).
- (23) V. Fritsch, J. Deisenhofer, R. Fichtl, J. Hemberger, H.-A. Krug von Nidda, M. Mücksch, M. Nicklas, D. Samusi, J. D. Thompson, R. Tidecks, V. Tsurkan, and A. Loidl, Phys. Rev. B 67, 144419 (2003).
- (24) V. Tsurkan, J. Hemberger, M. Klemm, S. Klimm, A. Loidl, S. Horn, and R. Tidecks, J. Appl. Phys. 90, 4639 (2001).
- (25) D. Maurer, V. Tsurkan, S. Horn, and R. Tidecks, J. Appl. Phys. 93, 9173 (2003).
- (26) R. Fichtl, V. Tsurkan, P. Lunkenheimer, J. Hemberger, V. Fritsch, H.-A. Krug von Nidda, E.-W. Scheidt, and A. Loidl, Phys. Rev. Lett. 94, 027601 (2005).
- (27) Ch. Hartinger, F. Mayr, J. Deisenhofer, A. Loidl, and T. Kopp, Phys. Rev. B 69, 100403(R) (2004).
- (28) H. D. Lutz, G. Waschenbach, G. Kliche, and H. Haeuseler, J. Solid State Chem. 48, 196 (1983).
- (29) K. Wakamura, Solid State Commun. 71, 1033 (1989).
- (30) D. W. Berreman and F. C. Unterwald, Phys. Rev. 174, 791 (1968).
- (31) K. Wakamura and T. Arai, J. Appl. Phys. 63, 5824 (1988).
- (32) W. Baltensperger, and J. S. Helman, Helv. Phys. Acta 41, 668 (1968).
- (33) W. Baltensperger, J. Appl. Phys. 41, 1052 (1970).
- (34) A.B. Sushkov, O. Tchernyshyov, W. Ratcliff, S.W. Cheong, and H.D. Drew, Phys. Rev. Lett. 94, 137202 (2005).
- (35) K. Wakamura, T. Arai, and K. Kudo, J. Phys. Soc. Jpn. 41, 130 (1976).
- (36) J.M. Wesselinowa and A.T. Apostolov, J. Phys.: Condens. Matter 8, 473 (1996).
- (37) P. Bruesch, and F. d’Ambrogio, Phys. Status Solidi (b) 50, 513 (1972).
- (38) H. M. Palmer, and C. Greaves, J. Mater. Chem. 9, 637 (1999).
- (39) O. Lang, C. Felser, R. Seshadri, F. Renz, J.-M. Kiat, J. Ensling, P. Gütlich, and W. Tremel, Adv. Mater. 12, 65 (2000).
- (40) A. Abragam and B. Bleaney, Electron Paramagnetic Resonance of Transition Ions, Clarendon, Oxford, 1970.
- (41) S. Wittekoek, R. P. van Stapele, and A. W. J. Wijma, Phys. Rev. B 7, 1667 (1973).
- (42) G. Haacke, A. J. Nozik, Solid State Commun. 6, 363 (1968).
- (43) P. Lunkenheimer and A. Loidl, Phys. Rev. Lett. 91, 207601 (2003).
- (44) I. Eremin, P. Thalmeier, P. Fulde, R.K. Kremer, K. Ahn, and A. Simon, Phys. Rev. B 64, 064425 (2001).
- (45) J. Deisenhofer, H.-A. Krug von Nidda, A. Loidl, K. Ahn, R.K. Kremer, and A. Simon, Phys. Rev. B 69, 104407 (2004).