Magnetic Flux Periodic Response of Nano-perforated Ultrathin Superconducting Films
Abstract
We have patterned a hexagonal array of nano-scale holes into a series of ultrathin, superconducting Bi/Sb films with transition temperatures 2.65 K 5 K. These regular perforations give the films a phase-sensitive periodic response to an applied magnetic field. By measuring this response in their resistive transitions, , we are able to distinguish regimes in which fluctuations of the amplitude, both the amplitude and phase, and the phase of the superconducting order parameter dominate the transport. The portion of dominated by amplitude fluctuations is larger in lower films and thus, grows with proximity to the superconductor to insulator transition.
The superconductors originally considered by BCS exhibited spectacularly sharp transitions from a finite resistance to zero resistance as a function of temperature Bardeen et al. (1957). Fluctuation effects were negligible. Presently, a great deal of attention focuses on low superfluid density superconductors for which fluctuations strongly influence and substantially broaden their phase transitions. These include the high temperature superconductors Emery and Kivelson (1995), and in particular, their underdoped versions Xu et al. (2000); Sandu et al. (2004); Zavaritsky and Alexandrov (2005), and ultrathin superconducting films near the superconductor to insulator transition (SIT) Hebard and Paalanen (1990); Yazdani and Kapitulnik (1995); Marković et al. (1998); Merchant et al. (2001); Sambandamurthy et al. (2004). For the latter, resistive transitions, , can develop widths comparable to or greater than the apparent mean field transition temperature, Chervenak and Valles (1999).
To discuss the effects of fluctuations on the it is helpful to consider the two component superconductor order parameter . In bulk elemental superconductors, the sharp reflect the near simultaneous appearance of a finite amplitude, , and long range coherence of the phase, . In low superfluid density superconductors, however, the amplitude first forms at high temperatures and phase coherence develops at lower temperatures Emery and Kivelson (1995); Kosterlitz and Thouless (1973); Beasley et al. (1979); Hebard and Fiory (1980). High on a transition quasiparticles transiently form Cooper pairs, which enhances the quasiparticle or fermionic contribution to the conductivity, . These pair or amplitude fluctuations give rise to the initial drop in Aslamasov and Larkin (1968). At very low values of , a substantial Cooper pair density exists and the conductivity of these bosons, , controls . is limited by the motion of vortices which causes fluctuations in the phase of the cooper pair condensate. In between, a two fluid model may best describe the transport Yazdani and Kapitulnik (1995).
Physical interpretations of the in high sheet resistance films especially those near the SIT relies heavily on distinguishing the amplitude and phase fluctuation dominated regimes Xu et al. (2000); Sandu et al. (2004); Zavaritsky and Alexandrov (2005); Hebard and Paalanen (1990). Most often, explicit models for and do not exist as a guide and qualitative arguments must prevail. In this paper we present the magnetic flux response of the of very low superfluid density (high sheet resistance) Chervenak and Valles (1999, 1996) films patterned with a nanoscale array of holes. We use the quality of the flux response at different points along their transitions to determine the presence of well-defined vortices Resnick et al. (1981) and thus provide insight into where the amplitude fluctuation dominated transport gives over to phase fluctuation dominated transport on an . In addition, we propose that this method can be used to directly detect the existence of vortices in settings where their presence has been contentious Marković et al. (1998).
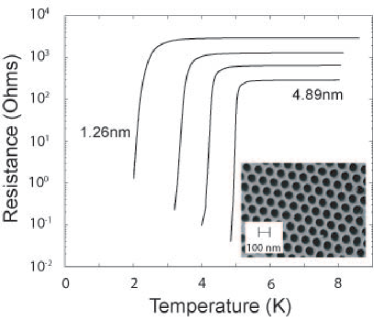
As a consequence of phase coherence, magnetic field periodic behavior is expected in films with multiply connected periodic geometries (see inset of Fig. 1) Fiory et al. (1978); Mkrtchyan and Shmidt (1972). For example, the resistive transitions of thick Nb films Welp et al. (2002) on nanopore arrays and thick Al films with much larger lattice and hole dimensions Bezryadin and Pannetier (1995) oscillate in temperature while maintaining their shape in an applied magnetic field. For holes separated by segments on the order of or less Welp et al. (2002)
| (1) |
where is the shift in the transition, is the (dirty) coherence length, is the hole to hole spacing SEM , is an integer, and is the applied magnetic flux. is the magnetic flux corresponding to having one flux quantum per unit cell and defines the unit cell matching field, . Eq. 1 is derived within the context of mean field theory, or in the absence of appreciable fluctuations of the superconducting order parameter and without considering vortex motion. Therefore, the physical picture which leads to Eq. 1 is that of immobile vortices which penetrate the film through the array of holes. These vortices generate screening currents which, at , nearly cancel in the interior of the film so that . At incommensurate fields the screening currents give rise to pair breaking and thus, a reduction in . The microscopic picture described by Eq. 1 is the familiar Little-Parks physics.
Eq. 1 accounts well for the flux periodic behavior of thick Nb films Welp et al. (2002). Our data, however, show that this physical picture is not valid for ultrathin high sheet resistance films with low superfluid density. Amplitude fluctuations prevent the formation of screening currents as described above when the fraction of the normal state resistance . In addition, as decreases () and screening currents appear, the films’ susceptibility to thermal fluctuations allows activated vortex motion to dominate the transition. Our data also indicate that the region of the transition dominated by amplitude fluctuations grows with decreasing and hence increasing proximity to the SIT.
Our experiments were conducted on homogeneous quench condensed Bi/Sb films similar to those employed in previous studies of the SIT and Thermally Activated Flux Flow (TAFF) Chervenak and Valles (1999). These films have very low superfluid density because they are thin and disordered Chervenak and Valles (1996, 1999). Two films were made simultaneously for each experiment. One film was deposited on a fire-polished glass substrate while the other was deposited on a nano-perforated Anodic Aluminum Oxide (AAO) substrate (see the inset of Fig. 1). The latter assumed the honeycomb geometry of the substrate. The preparation of the AAO substrates can be found elsewhere in the literature Yin et al. (2001); Masuda and Fukuda (1995); Masuda et al. (1997); Li et al. (1999). Those used in these experiments had a hole lattice constant, , of 100 nm and a hole radius, nm. Both substrates were precoated with 50 nm of thermally evaporated Ge (in an attempt to smooth the small surface roughness of the AAO substrate) before Au contact pads were deposited at room temperature. Subsequently both substrates were mounted in our cryostat where homogeneous Bi films are fabricated at K by first evaporating a thin film of Sb (nm, which ensures the films’ homogeneous morphology) and then depositing the desired thicknesses of Bi through sequential depositions. In this way, a series of Bi films were fabricated without breaking vacuum or warming.
The were measured using standard four-terminal, low-frequency ac techniques and acquired in the regime of applied currents where the films exhibit an ohmic response. Nonlinearities associated with the phase transition to the zero resistance state, which are expected at lower temperatures and have been observed in some wire arrays do not appear in this experiment’s range Ling et al. (1996); Higgins et al. (2000); Teitel and Jayaprakash (1983). The normal state resistances, , of neighboring film regions were compared to assess film homogeneity and found to agree to . Magnetic fields were applied perpendicular to the planes of the films. Our thermometry consists of a calibrated carbon glass resistor which has a negligible magnetoresistance in the range of fields used in these experiments.
Data from a series of four superconducting films with ranging from 2.65 to 5 K and normal state resistances, , ranging from 3.3k to 300 are shown in Fig. 1. The reference film exhibits the same range of and a similar increase in the widths of its transitions with decreasing . The latter characteristic has been ascribed to a growing fluctuation dominated regime Chervenak and Valles (1999). The systematic reduction in is believed to result from disorder enhanced Coulomb repulsion effects that grow with increasing and possibly drive the SIT Belitz and Kirkpatrick (1994); Finkelstein (1994).
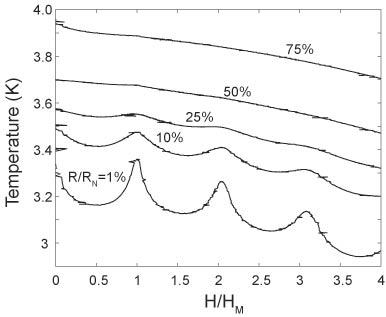
Despite the breadth of the superconducting transitions they do oscillate with increasing magnetic field. The amplitude of the oscillations, however, depends strongly on the reduced resistances, , at which they are measured. That is, unlike thicker films the shape of the transitions change in field Welp et al. (2002); Bezryadin and Pannetier (1995). Figure 2 shows a typical series of isodissipative (i.e. fixed ) measurements of Pannetier et al. (1983). ( does not change in this range of applied fields.) The lower curves exhibit oscillations that diminish in size with increasing field and are superimposed on a nearly quadratic background. The peaks in the data appear at Gauss where is an integer. corresponds closely to the calculated value for one flux quantum per unit cell of the hole array (see SEM ). Thus, these oscillations result from the collective response of the hole array rather than from the responses of single holes Abilio et al. (2000). A feature of particular interest is that the peak amplitudes are larger at lower .
We characterize the flux periodic response using a normalized oscillation amplitude, A, for the first oscillation:
| (2) |
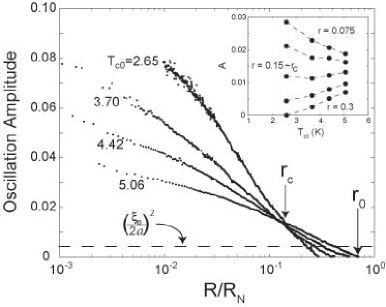
Each solid curve of as a function of shown in Fig. 3 was calculated using individual measurements of at 0, , and . The dashed curve represents the mean field oscillation amplitude, , derived from Eq. 1. nm represents the average value for these films as determined from measurements of the upper critical fields of the reference films. It varied by over this range of .
The oscillation amplitudes exhibit a rich dependence on and , unlike the constant mean field prediction. For all , grows nearly logarithmically from zero with decreasing with a dependence that is stronger for the films with lower . For , the oscillations surpass 10 times the mean field result. The at which oscillations first appear, , is well defined and is lower for lower . Interestingly, the for different cross in the vicinity of a single point near . The existence of this crossing point is supported by data on another hole size. Its significance is brought out partially by the inset in Fig. 3, which shows how depends on at fixed values of . delineates the portions of the in which increases or decreases with the primary energy scale characterizing the transition, .
Accounting for the very large at low and the vanishing of for clearly requires consideration of the effects of fluctuations Hayashi and Ebisawa (2001). Unfortunately, detailed theoretical predictions for the do not exist. Our identification of two scales in the data, and , however, provide a useful guide for the discussion. As we emphasize below, the two scales define points on the transitions at which the dissipative processes and character of the fluctuation effects qualitatively change.
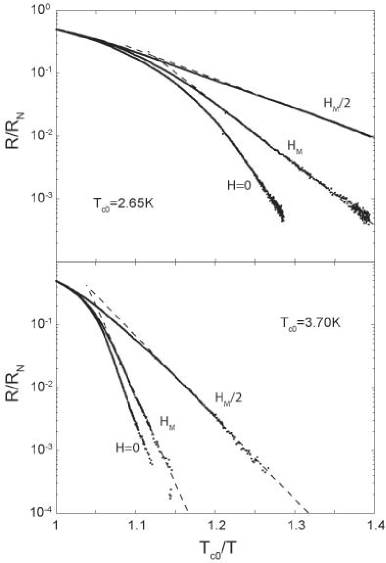
Insight into the large amplitude of the oscillations at comes from investigating the tails of the superconducting transitions in magnetic field. Figure 4 shows Arrhenius plots of the collected at , , and for two films with different . The tails of the follow
| (3) |
which is the signature of Thermally Activated Flux Flow (TAFF). The energy barrier, , is lower by more than a factor of 2 at than at . This nonmonotonic variation in gives rise to the oscillations that continuously grow as . At the vortices come into registry with the holes and thus their lattice is made stiff against thermally activated flux flow. At half integer values of , vortices cannot come into registry with the holes and simultaneously form a stable lattice. Consequently, the activation energy is substantially lower at incommensurate fields. That lower films have larger oscillation amplitudes in this regime results from the difference in the activation barriers for different films as seen in Fig. 4. Even on a normalized temperatuere scale, the lower film has broader transitions than the higher film. Correspondingly, the activation energy increases faster than linearly with . This behavior is consistent with the condensation energy dictating the activation energy scale. A more detailed discussion of the TAFF behavior will appear in future work.
Moving up the transition to (Fig. 3), the oscillation amplitudes wane and eventually go to zero. The behavior as can be attributed to enhanced vortex mobility that causes them to lose registry with the holes. Nearer the shrinkage of the order parameter makes the barrier to interhole vortex motion smaller and the likelihood of amplitude fluctuations greater. Given that the constrictions in the film are quasi-1d (a few across) both of these effects will enhance interhole vortex motion. These effects are more pronounced in lower films since the condensation energy, which is proportional to , governs their strength. Consequently, is lower in lower films. As exceeds , all evidence of well defined vortices that could be pinned by holes and give rise to a periodic response disappears. This last regime can be characterized by amplitude fluctuations that become so strong that they destroy fluxoid quantization altogether.
Thus, even in the absence of a detailed model of which accounts for fluctuations in these films, we can identify three distinct fluctuation regimes defined by and . For , thermally activated flux motion causes phase fluctuations. In the intermediate regime, , the vortex mobility is augmented by strong amplitude fluctuations. And finally, for amplitude fluctuations dominate and vortices do not exist.
The decrease of with implies that the size of the amplitude fluctuation dominated regime increases closer to the SIT Chervenak and Valles (1999). This trend can be attributed to the growth of both the quantum critical regime of the SIT Kirkpatrick and Belitz (1997) and the classical critical regime Goldenfeld (1992) as increases. for the lowest film in the series. It suggests that the fermionic degrees of freedom strongly influence the approach to the SIT in uniform films. Experiments on lower , higher films will provide insight into whether bosonic (vortices) or fermionic degrees of freedom dominate the SIT.
We propose that techniques similar to those applied here may be useful for detecting the existence of vortices in other unconventional situations. For example, evidence from Nernst Effect Xu et al. (2000) and magnetoresistance Sandu et al. (2004) measurements suggests the presence of vortices well above in under doped high compounds. Underdoped films patterned with an ordered array of pinning centers (e.g. holes or magnetic impurities) should exhibit flux periodic behavior according to our results. Similar arrangements Marković et al. (1998) could test the proposal that there are vortices on the insulating side of the superconductor to insulator transition.
In summary, we have quench condensed nano-perforated, homogeneously disordered Bi films. The regular perforations induce a phase-sensitive periodic response to an applied magnetic flux and thus provides a probe capable of distinguishing between the two types of superconducting fluctuations. In these low superfluid density films, we have found that the strength of this response crosses over between regions of the dominated by fluctuations in the amplitude, , of the superconducting order parameter to that dominated by fluctuations in the phase, . In addition, as is lowered and the system approaches the quantum critical point of the SIT, the region of the dominated by amplitude fluctuations grows.
This work has been supported by the NSF through DMR-0203608, AFRL, and ONR. We acknowledge helpful conversations with N. Daniilidis.
References
- Bardeen et al. (1957) J. Bardeen, L. N. Cooper, and J. R. Schrieffer, Phys. Rev. 108, 1175 (1957).
- Emery and Kivelson (1995) V. J. Emery and S. A. Kivelson, Nature 374, 434 (1995).
- Xu et al. (2000) Z. A. Xu, N. P. Ong, Y. Wang, T. Kakeshita, and S. Uchida, Nature 406, 486 (2000).
- Sandu et al. (2004) V. Sandu, E. Cimpoiasu, T. Katuwal, S. Li, M. B. Maple, and C. C. Almasan, Phys. Rev. Lett. 93, 177005 (2004).
- Zavaritsky and Alexandrov (2005) V. N. Zavaritsky and A. S. Alexandrov, Phys. Rev. B 71, 012502 (2005).
- Hebard and Paalanen (1990) A. F. Hebard and M. A. Paalanen, Phys. Rev. Lett 65, 927 (1990).
- Yazdani and Kapitulnik (1995) A. Yazdani and A. Kapitulnik, Phys. Rev. Lett. 74, 3037 (1995).
- Marković et al. (1998) N. Marković, A. M. Mack, G. Martinez-Arizala, C. Christiansen, and A. M. Goldman, Phys. Rev. Lett. 81, 701 (1998).
- Merchant et al. (2001) L. Merchant, J. Ostrick, R. P. Barber, Jr., and R. C. Dynes, Phys Rev. B 63, 134508 (2001).
- Sambandamurthy et al. (2004) G. Sambandamurthy, L. W. Engel, A. Johansson, and D. Shahar, Phys. Rev. Lett. 92, 107005 (2004).
- Chervenak and Valles (1999) J. A. Chervenak and J. M. Valles, Jr., Phys. Rev. B 59, 11209 (1999).
- Kosterlitz and Thouless (1973) J. M. Kosterlitz and D. J. Thouless, J. Phys. C 6, 1181 (1973).
- Beasley et al. (1979) M. R. Beasley, J. E. Mooij, and T. P. Orlando, Phys. Rev. Lett. 42, 1165 (1979).
- Hebard and Fiory (1980) A. F. Hebard and A. T. Fiory, Phys. Rev. Lett 44, 291 (1980).
- Aslamasov and Larkin (1968) L. G. Aslamasov and A. I. Larkin, Phys. Lett. A 26, 238 (1968).
- Chervenak and Valles (1996) J. A. Chervenak and J. M. Valles, Jr., Phys Rev. B 54, R15649 (1996).
- Resnick et al. (1981) D. J. Resnick, J. C. Garland, J. T. Boyd, S. Shoemaker, and R. S. Newrock, Phys. Rev. Lett. 47, 1542 (1981).
- Fiory et al. (1978) A. T. Fiory, A. F. Hebard, and S. Somekh, Apl. Phys. Lett. 32, 73 (1978).
- Mkrtchyan and Shmidt (1972) G. S. Mkrtchyan and V. V. Shmidt, Soviet Phys. JETP 34, 195 (1972).
- Welp et al. (2002) U. Welp, Z. Xiao, J. S. Jiang, et al., Phys. Rev B 66, 212507 (2002).
- Bezryadin and Pannetier (1995) A. Bezryadin and B. Pannetier, J. Low Temp. Phys. 98, 251 (1995).
- (22) From SEM images we have determined the hole lattice constant nm and thus Gauss. The position of the peaks in the data occur at Gauss in agreement with that calculated from the lattice constant. Gauss is the normalization used on the data throughout this paper.
- Yin et al. (2001) A. J. Yin et al., Appl. Phys. Lett 79, 1039 (2001).
- Masuda and Fukuda (1995) H. Masuda and K. Fukuda, Science 268, 1466 (1995).
- Masuda et al. (1997) H. Masuda et al., Appl. Phys. Lett. 71, 2770 (1997).
- Li et al. (1999) J. Li et al., Appl. Phys. Lett. 75, 367 (1999).
- Ling et al. (1996) X. S. Ling et al., Phys. Rev. Lett. 76, 2989 (1996).
- Higgins et al. (2000) M. J. Higgins et al., Phys. Rev. B 61, R894 (2000).
- Teitel and Jayaprakash (1983) S. Teitel and C. Jayaprakash, Phys. Rev. Lett. 51, 1999 (1983).
- Belitz and Kirkpatrick (1994) D. Belitz and T. R. Kirkpatrick, Rev. Mod. Phys. 66, 261 (1994).
- Finkelstein (1994) A. M. Finkelstein, Physica B 197, 636 (1994).
- Pannetier et al. (1983) B. Pannetier, J. Chaussy, and R. Rammal, J. Physique Lett. 44, 853 (1983).
- Abilio et al. (2000) C. C. Abilio et al., J. Low Temp Phys. 118, 23 (2000).
- Hayashi and Ebisawa (2001) M. Hayashi and H. Ebisawa, Physica C 352, 191 (2001).
- Kirkpatrick and Belitz (1997) T. R. Kirkpatrick and D. Belitz, Phys. Rev. Lett. 79, 3042 (1997).
- Goldenfeld (1992) N. Goldenfeld, Lectures on Phase Transitions and the Renormalization Group (Addison-Wesley, New York, 1992).