Molecular Orbital Shift of Perylenetetracarboxylic-Dianhydride
Abstract
Using low-temperature scanning tunneling microscopy we find that perylenetetracarboxylic-dianhydride on Au(788) exhibits three coexisting adsorption phases. Single-molecule tunneling spectroscopy reveals orbital energies, which differ in the different adsorption phases. Density functional theory calculations associate the experimentally observed submolecular corrugation to the spatial distribution of the second-to-lowest unoccupied molecular orbital. We tentatively attribute the orbital shifts to a varying number of hydrogen bonds.
pacs:
68.37.Ef,73.20.At,73.61.PhInterest in organic molecular films is fueled by technological advances in organic devices dim99 ; oij99 , potential applications in molecular switches che99 ; lah03 , and functionalization of surfaces tan87 ; bur93 ; tay97 as well as by the fundamental understanding of the film-metal system. Typically, the geometric and electronic structure of the molecule-substrate interface is of substantial importance. Therefore considerable effort has been made to investigate this interface and to maximize its homogeneity for97 . Owing to the complexity of molecular shapes and interactions, however, perfectly homogeneous interfaces usually remain elusive and coexistence of structural domains has been reported for various molecular systems wit04 . Detailed characterization of the variability of the electronic structure on a single molecule scale requires high lateral resolution and has, consequently, hardly been achieved lud94 ; toe01 .
A model system of molecular electronic studies at the molecular level is -perylenetetracarboxylic-dianhydride (PTCDA). The adsorption geometry of PTCDA on metal surfaces was analyzed previously as excellently reviewed by Witte and Wöll wit04 and Barlow and Raval smb03 . Adsorption characteristics on Au(111) deserve special interest since this surface exhibits a reconstruction. Chizhov et al. chi00 found that room-temperature adsorption leads to two coexisting adsorbate geometries, namely a herringbone structure and a square phase, where four PTCDA molecules adsorb on the boundary of a square with equivalent axes of adjacent molecules including an angle of .
Here, we report on low-temperature scanning tunneling microscopy (STM) of PTCDA on Au(788). We observe three coexisting PTCDA superstructures on this surface. Single-molecule tunneling spectroscopy reveals a peak above the Fermi level whose energy strikingly varies between these geometric superstructures. According to density functional theory (DFT) calculations for the molecule-surface complex the experimentally observed spectral feature is predominantly due to the second-to-lowest unoccupied molecular orbital (LUMO+1). This interpretation is in some contrast to previous work for PTCDA on other metal surfaces where experimental features have been attributed to the LUMO on the basis of calculations for the free molecule lud94 ; glo98 ; mer04 . We argue that the observed shift of the orbital energy is most likely caused by hydrogen bonds.
We used a home-built ultrahigh-vacuum (UHV) low-temperature STM with a base pressure of better than . The Au(788) sample and W tips were cleaned by argon ion bombardment and annealing. Crystalline order was checked by low-energy electron diffraction, and surface cleanliness was monitored by STM. PTCDA was evaporated onto the Au(788) surface held at room temperature from a degassed tantalum crucible keeping the pressure of the UHV recipient below . The rate of deposition, monitored by a quartz microbalance, was . One monolayer (ML) of PTCDA is defined here as one molecule per (corresponding to the density of the herringbone superstructure). The prepared sample was then cooled down to within . For detection of the differential conductivity () we applied a standard lock-in technique. The tip state was checked by spectra of the electronic surface state of clean Au(788) acquired before and after measuring the signal of single PTCDA molecules.
Density-functional calculations were performed with the code Siesta siest using a double- basis set plus polarization functions ang02 for the valence electrons and the Generalized Gradients Approximation (GGA) per96 for the exchange-correlation functional. The Au(111) surface serves as a model of the terraces of Au(788). Various supercell sizes in a slab geometry were explored to take into account different packing densities of PTCDA superstructures. For simulating experimental spectra of the differential conductivity we calculated the local density of states at the tip apex being above the surface. Due to the weak molecule-surface interaction local and semi-local approaches of DFT fail to yield the correct adsorption parameters of PTCDA on Au(111). Here, we are interested in a qualitative analysis of the electronic structure. A recent incidence x-ray standing wave experiment performed on Ag(111)-PTCDA determines the vertical distance of the perylene core to aha05 . Hence, we have frozen the height of the molecular atoms at and allowed a full relaxation of the other molecular coordinates in order to find the correct packing geometry for the two molecules constituing our supercell. Our calculations show that increasing the adsorption height by leads to a basically free molecule, which slightly interacts with the surface. Decreasing the molecule-surface distance by leads to a very large mixing of molecular orbitals because the molecule is already probing the strongly repulsive substrate potential.
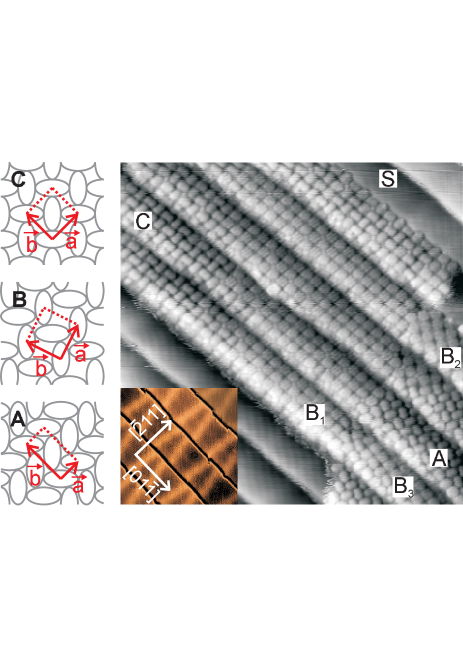
Figure 1 shows a constant-current STM image of PTCDA on Au(788). Crystal directions along ascending steps, , and parallel to the step edges, , are indicated. The inset shows a small-scale STM image of a clean area to highlight the discommensuration lines. These lines of higher corrugation are stacking fault domains separating face-centered cubic (fcc) and hexagonal close packed (hcp) surface layer stacking areas, similar to the case of the reconstruction on Au(111). Au(788) is thus patterned in two dimensions: terraces with a periodicity along and discommensuration lines with a periodicity of along . We find that the Au(788) reconstruction is not perturbed by PTCDA adsorption. A similar observation has been reported previously for the reconstruction on Au(111) chi00 .
Three adsorption phases of PTCDA coexist on Au(788) (labelled A, Bn, and C in Fig. 1). In domain A we find the herringbone structure with lattice vector dimensions and (sketches on the left hand side of Fig. 1). Three prevalent orientations of the shorter unit cell edge with respect to are observed, namely , , and . For Au(111), a different set of orientations (, and ) was reported sch99 and rationalized in terms of a minimum misfit between the molecule film and the substrate. On a stepped surface like Au(788) this effect appears to be suppressed by the possibility to align the molecules with the step edges.
Superstructure B is a square phase with a lattice constant of . Equivalent axes of adjacent molecules are rotated by with respect to each other. Several rotational domains, labelled B1, B2, and B3 in Fig. 1, are observed. Chizhov et al. reported a similar superstructure on Au(111) chi00 .
Adsorption phase C differs from structure B by the end of a molecule pointing towards the center of an adjacent molecule.
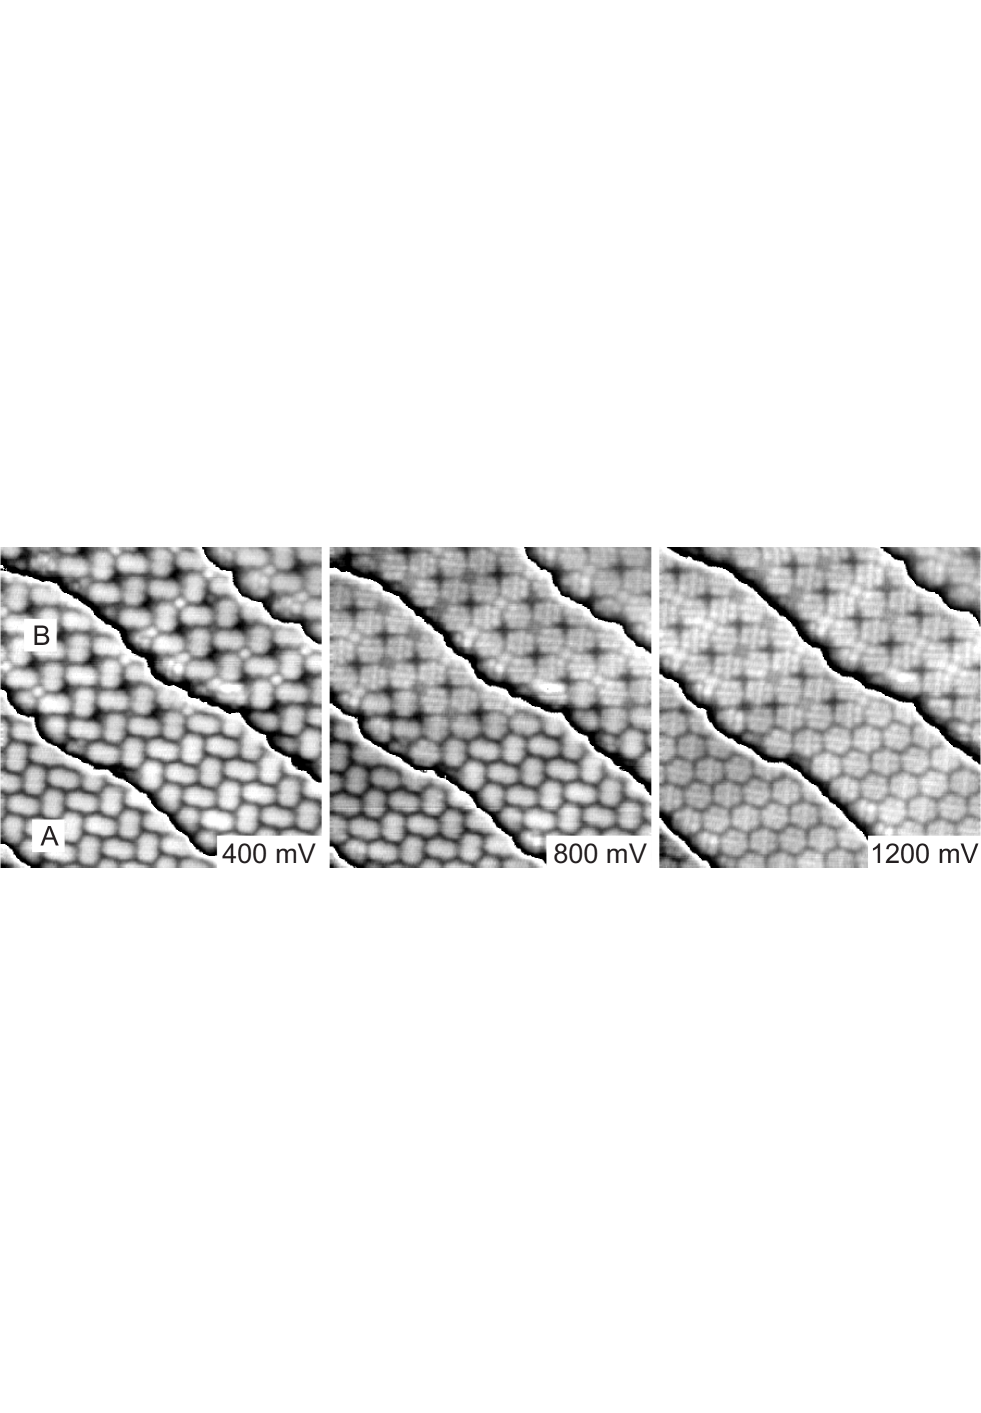
We now turn to the electronic properties of the PTCDA molecules in the superstructures. Figure 2 presents STM images recorded at three characteristic voltages. The images show four PTCDA covered Au(788) terraces where A and B domains are visible in the lower and upper parts, respectively. In B domains, circular protrusions are frequently observed between four PTCDA molecules. We attribute these protrusions to single trapped Au atoms in analogy to single Fe atoms surrounded by trimesic acid molecules spi03 . At all PTCDA molecules are imaged as structureless rectangles. For topographic changes of the A phase are hardly visible while intramolecular structure emerges in the B phase, the former rectangular shape of the molecules being lost in favor of a hexagonal shape. Finally, at submolecular structure is observed for both domains. These observations strikingly demonstrate that the electronic structure underlying the intramolecular contrast depends on the adsorption phase of PTCDA molecules.
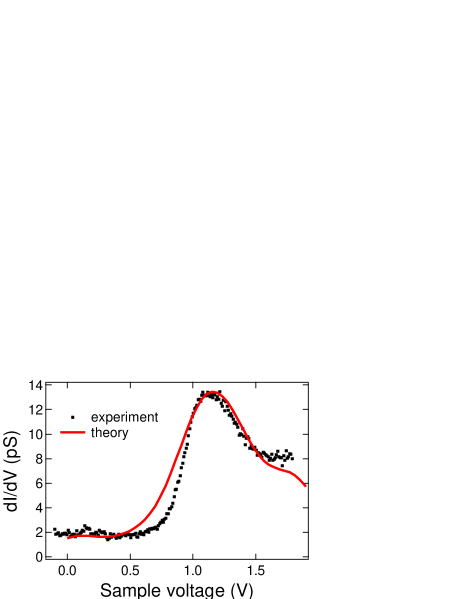
To interpret the data we first trace the origin of submolecular structure back to the involved molecular orbitals. Figure 3 shows the differential conductivity as acquired in the center of a single PTCDA molecule embedded in the herringbone adsorption domain. We find a single peak centered at . The calculated spectrum, shown as a line, matches the experimental spectrum. In the calculation, the main contribution to the conductivity originates from the density of states of the LUMO+1. The LUMO+2 is basically degenerated with the LUMO+1 and also contributes to the spectroscopic signature giving a certain broadening of the peak. Since the intramolecular structure for herringbone-phase molecules appears above we ascribe most of the submolecular structure to the spatial distribution of the LUMO+1.
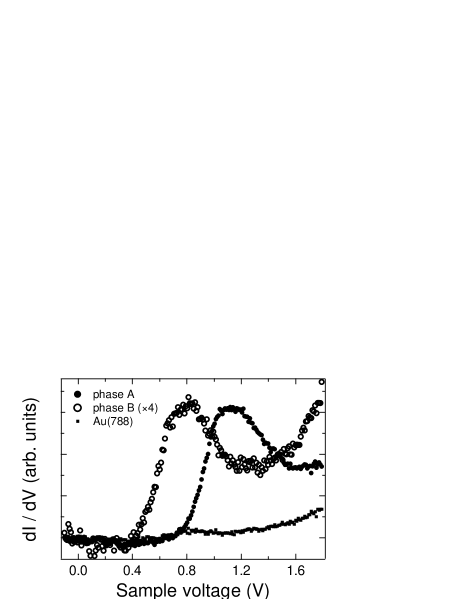
We now return to the differences between domains A, B, and C observed in Fig. 2. Intramolecular structure for the square adsorption domain B appears at lower voltages than for the herringbone phase. Molecules at a domain boundary surrounded from either side by molecules in different arrangements and likewise molecules in adsorption phase C reveal submolecular structure for intermediate voltages. Obviously, the energetic position of the LUMO+1 depends on the local environment of the individual molecule and thus differs for molecules from different domains. We further tested this hypothesis by single-molecule spectroscopy of the differential conductivity acquired above the center of B and A phase molecules (Fig. 4, open and solid circles, respectively). The spectral signature of B phase PTCDA is located at , i. e. shifted by compared to the A phase. Owing to the similar intramolecular contrast in both phases we can safely attribute this peak to the LUMO+1. Since the feedback loop was frozen at the LUMO+1 contribution of the A-phase molecule has not yet developed leading to a smaller tip-molecule distance than in the case of the B-phase molecule. To show both peaks on the same scale we multiplied the data acquired on the B-phase molecule by a factor of 4. Spectra of occupied electronic states, i. e., at negative voltages () turned out to be featureless. Our calculations predict, for instance, the LUMO of PTCDA to be pinned at the Fermi level aha05 . The spatial distribution of the LUMO density of states is found to adhere strongly to the molecule and to be less evanescent into vacuum than the LUMO+1. This leads to its efficient suppression from the d/d spectra (as observed in our experiments).
The calculations indicate that apart from the molecule-substrate interaction the intermolecular one plays a role. The latter is mediated by hydrogen bonding between adjacent molecules which is poorly accounted for by our numerical approach. Nevertheless, our calculation for free standing molecules at the adsorbed geometries yields a widening gap between molecular levels. As a consequence the packing density and the actual adsorption geometry influence the energetic position of molecular orbitals. The ability of DFT to reproduce workfunction changes even in the case of physisorbed molecules mor04 , led us to compute and compare the workfunction changes with the measured ones. The experimental change is of the order of 0.1 eV which agrees with the change of the two molecular phases frozen at 2.8 Å from the surface atomic plane, implying that the molecules lie at the same molecule-surface distance for both phases. However the calculations show small differences between both phases and are unable to explain the significant experimental orbital shift. Different combinations of molecular heights for the two phases led to inconsistent results and to disagreement with the measured workfunction change. Hence, we conclude that the orbital shift is not due to a different molecule-surface distance for the two phases. Other effects such as the influence of the tip’s electric field have been included in the calculation by computing the electronic structure for different values of external electrical fields without a sizeable effect on the peak position. Finally, the modification of the metallic surface is unlikely due to the very weak physisorption interaction. These facts lead us to favor H-bond mediated molecule-molecule interaction, where the role of the surface may not be negligible due to the important change of charge transfer that the orbital shift implies.
In summary, we found that PTCDA exhibits three distinct coexisting adsorption phases on Au(788). The adsorption domains can be distinguished by their geometric arrangement and by their electronic properties. By performing DFT calculations the experimentally submolecular corrugation is ascribed to the spatial distribution of the LUMO+1 density of states. The shift of the LUMO+1 energy as seen in single-molecule spectroscopy measurements in the distinct superstructures might be ascribed to the different PTCDA packing densities and to the particular adsorption geometries.
We are delighted to thank M. Sokolowski (University of Bonn, Germany) for providing the PTCDA molecules and B. Hartke (University of Kiel, Germany) for fruitful discussion. Financial support by the Deutsche Forschungsgemeinschaft and the European Science Foundation is gratefully acknowledged.
References
- (1) C. D. Dimitrakopoulos, S. Purushothaman, J. Kymissis, A. Callegari, and J. M. Shaw, Science 283, 822 (1999).
- (2) A. M. van Oijen, M. Ketelaars, J. Köhler, T. J. Aartsma, and J. Schmidt, Science 285, 400 (1999).
- (3) J. Chen, M. A. Reed, A. M. Rawlett, and J. M. Tour, Science 286, 1550 (1999).
- (4) J. Lahann, S. Mitragotri, T.-N. Tran, H. Kaido, J. Sundaram, I. S. Choi, S. Hoffer, G. Somorjai, and R. Langer, Science 299, 371 (2003).
- (5) C. W. Tang and S. A. VanSlyke, Appl. Phys. Lett. 51, 913 (1987).
- (6) P. E. Burrows and S. R. Forrest, Appl. Phys. Lett. 62, 3102 (1993).
- (7) R. B. Taylor, P. E. Burrows, and S. R. Forrest, IEEE Photonics Technol. Lett. 9, 365 (1997).
- (8) S. R. Forrest, Chem. Rev. 97, 1793 (1997).
- (9) G. Witte and Ch. Wöll, J. Mater. Res. 19, 1889 (2004).
- (10) C. Ludwig, B. Gompf, J. Petersen, R. Strohmaier, and W. Eisenmenger, Z. Phys. B 93, 365 (1994).
- (11) M. Toerker, T. Fritz, H. Proehl, F. Sellam, and K. Leo, Surf. Sci. 491, 255 (2001).
- (12) S. M. Barlow and R. Raval, Surf. Sci. Rep. 50, 201 (2003).
- (13) I. Chizhov, A. Kahn, and G. Scoles, J. Cryst. Growth 208, 449 (2000).
- (14) K. Glöckler, C. Seidel, A. Soukopp, M. Sokolowski, E. Umbach, M. Böhringer, R. Berndt, and W.-D. Schneider, Surf. Sci. 405, 1 (1998).
- (15) M. Eremtchenko, D. Bauer, J. A. Schaefer, and F. S. Tautz, New Journal of Physics 6, 4 (2004).
- (16) J. Soler, E. Artacho, J. D. Gale, A. García, J. Junquera, P. Ordejón, and D. Sánchez-Portal, J. Phys.: Condens. Matter, 14, 2745 (2002).
- (17) E. Anglada, J. M. Soler, J. Junquera, and E. Artacho, Phys. Rev. B 66, 205101 (2002).
- (18) J. P. Perdew, K. Burke, and M. Ernzerhof, Phys. Rev. Lett. 77, 3865 (1996).
- (19) A. Hauschild, K. Karki, B. C. C. Cowie, M. Rohlfing, F. S. Tautz, and M. Sokolowski, Phys. Rev. Lett. 94, 036106 (2005).
- (20) T. Schmitz-Hübsch, T. Fritz, R. Staub, A. Back, N. R. Armstrong, and K. Leo, Surf. Sci. 437, 163 (1999).
- (21) H. Spillmann, A. Dmitriev, N. Lin, P. Messina, J. V. Barth, and K. Kern, J. Am. Chem. Soc. 125, 10725 (2003).
- (22) Y. Morikawa, H. Ishi, and K. Seki, Phys. Rev. B 69, 041403 (2004).