Distinct order of Gd and Fe moments coexisting in GdFe4Al8
Abstract
Single crystals of flux-grown tetragonal GdFe4Al8 were characterized by thermodynamic, transport, and x-ray resonant magnetic scattering measurements. In addition to antiferromagnetic order at , two low-temperature transitions at and were identified. The Fe moments order at with an incommensurate propagation vector () with varying between and as a function of temperature, and maintain this order over the entire range. The Gd moments order below with a ferromagnetic component mainly out of plane. Below , the ferromagnetic components are confined to the crystallographic plane. Remarkably, at low temperatures the Fe moments maintain the same modulation as at high temperatures, but the Gd moments apparently do not follow this modulation. The magnetic phase diagrams for fields applied in [110] and [001] direction are presented and possible magnetic structures are discussed.
pacs:
75.25.+z, 75.30.-mI Introduction
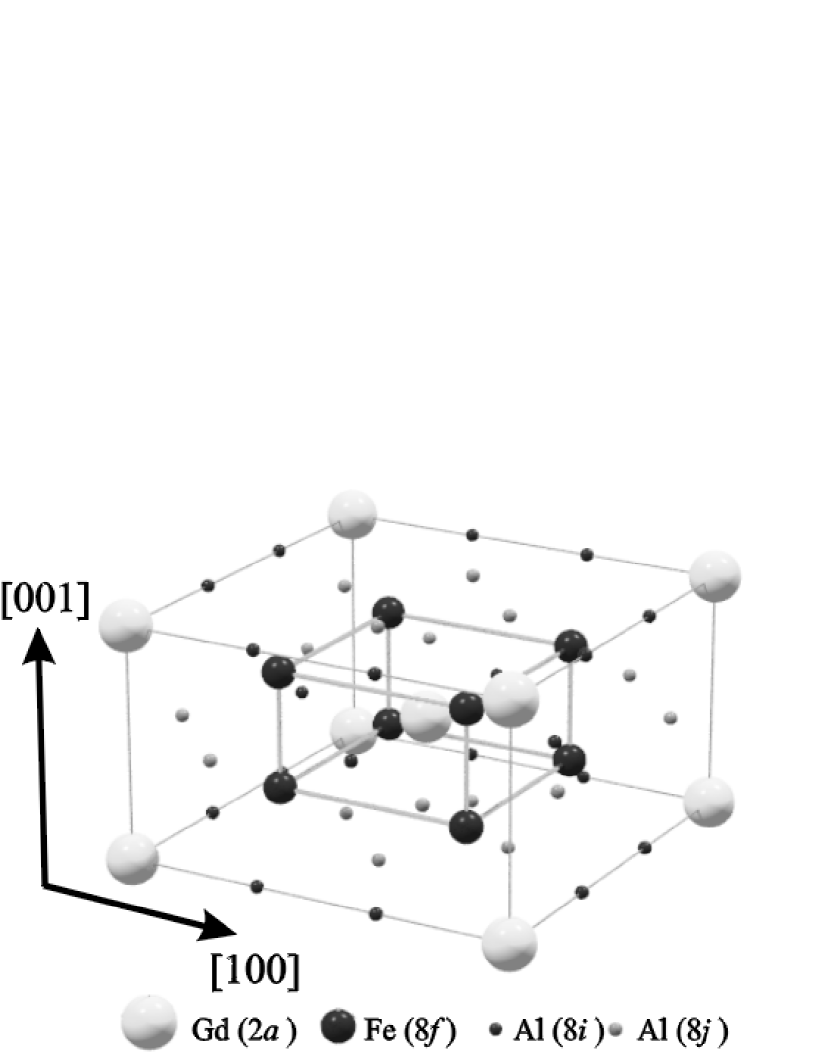
Understanding the interplay of rare-earth local-moment magnetism and transition metal itinerant magnetism is of fundamental physical interestCampbell72 and may help in the design of more efficient permanent magnets. The tetragonal Fe4Al8 (rare earth) compounds (Fig. 1) are well suited for studying this interplay because of simple symmetry conditions and because the interaction between the two magnetic sublattices is rather weak: Fe moments appear to order without a corresponding order. Consequently, numerous studies have been performed on Fe4Al8 (R148) over the last 30 years and interest in these compounds has remained high.Buschow78 ; Felner78 ; Fujiwara87 ; Duong01 ; Duong02 ; Langridge99 ; Paixao00 ; Paixao01 ; Schobinger98 ; Schobinger99
Neutron scattering studies performed on R148 with various indicate that Fe moments, between which the coupling is strongest, order between and , generally in cycloidal structures with propagation vectors parallel to [110] and moments confined to the plane.Paixao00 ; Paixao01 ; Schobinger98 ; Schobinger99 For magnetic rare earths , ordering of the moments, with much weaker coupling and at much lower temperature , has been reported. However, the critical temperature associated with this ordering is very poorly defined. For example in Dy148 at the magnetic dc susceptibility rises faster than expected for Curie-Weiss behavior, but there are no sharp features.Paixao00 Furthermore, the rare earth moments were found to follow the Fe-moment modulation.Paixao00 ; Schobinger98 This seems to imply that the Fe moment interaction is stronger than the moment interaction.
Of all rare earth elements, Gd has two highly interesting specific features associated with its high-spin and zero-angular-momentum state: 1) high spin results in strong magnetic coupling between the localized and the conduction electrons, implying large magnetic interactions and the largest de Gennes factor of all rare earths; 2) zero angular momentum implies a spherical charge-cloud and no magneto-crystalline anisotropy (MCA) resulting from crystal-electric-field effects the direct interplay of magnetic interactions can be studied without crystal-electric-field effects. In view of this, it is somewhat surprising that GdFe4Al8 (Gd148) has been much less studiedFujiwara87 ; Duong01 than R148 with other rare earths. In particular, apart from Mössbauer spectroscopy,Buschow78 there have been no microscopic studies of Gd148.
Here, we report on the flux-growth of single crystals of the GdFe4Al8 phase, and on the characterization of the crystals by magnetization, electrical transport, specific heat, and x-ray diffraction. We also report on first synchrotron x-ray resonant magnetic scattering (XRMS) data. We provide evidence for two consecutive phase transitions at low temperature in addition to the Néel transition at , and show that the two, low-, transitions are associated with the ordering of the Gd moments, resulting in complex magnetic structures involving both ferro- and antiferromagnetic components. In contrast to other R148 compounds, the -moment ordering is associated with a propagation vector that is distinct from that associated with the Fe moment order, which at low has the same modulation as in the vicinity of the Néel temperature. We also present the magnetic phase diagram for two field directions and discuss the implications of changes in the Fe stoichiometry.
The paper is organized into seven sections. In Sec. II we describe the flux growth of the single crystalline samples used in the study, and the experimental procedures. In Sec. III zero and low field electrical transport, magnetization, and specific-heat data are presented, and we evaluate the influence of the iron stoichiometry on the physical properties. In Sec. IV we present electrical transport and magnetization data measured in fields for two field directions, and in Sec. V the results of a first XRMS experiment are described. Finally, we discuss the low-temperature magnetic phase diagram and possible magnetic structures in Sec. VI, before summarizing our main conclusions in Sec. VII.
II Experimental
Whereas all previous single crystals of Fe4Al8 material were obtained using the Czochralsky-method, we have grown single crystals of Gd148 (and other R148) with a self-flux method.Sol1 ; Sol2 ; Sol3 One of the problems with studies on single crystals of R148 is a width of formation often observed, involving some Fe atoms occupying nominal Al positions and vice versa; this can lead to striking differences in the magnetic structure and phase diagram as compared to the stoichiometric material (see, e.g., Refs. Paixao01, ; Waerenborgh00, ). A flux-growth procedure may allow better control of the stoichiometry of the crystals by varying the starting composition. Unfortunately, information about the ternary phase diagram -Fe-Al is very limited. We used differential thermal analysis (DTA; see Ref. Janssen05, for a review of the use of DTA in the flux growth of crystals) to establish i) that GdFe4Al8 is congruently melting and ii) selected solidus temperatures in the ternary around the GdFe4Al8 stoichiometry. For the crystals used in this study, we selected starting compositions between Gd148 and the also congruently melting Fe2Al5 (Gd3Fe16Al34 and Gd2Fe14Al31), which should not lead to large imbalances in the Fe to Al ratio.
Elements in ratios corresponding to the starting composition were first arc-melted together. The resulting ingot was placed in an alumina crucible, which was wrapped in Ta foil (to prevent any residual oxygen in the Ar from reacting with the sample) and placed in a vertical tube furnace in flowing Ar. Crystals were grown by heating to and then slowly () cooling to , at which point the furnace was turned off. The flux was removed from the crystals in a second step by heating to , keeping the temperature for and then decanting, following procedures described in Refs. Sol1, ; Sol2, ; Sol3, ; Janssen05, .
For both starting compositions, we obtained crystals of the Gd148 phase, as identified via powder x-ray diffraction. Crystals typically grow prismatically with (110) facets and the long direction parallel to [001], as determined with Laue scattering. We obtained crystals of dimensions up to about . We determined, via single crystal x-ray-diffraction-structure refinement and electron-microprobe analysis (employing single crystals of GdFe2 as standards), the crystals to be slightly iron deficient, but detected no Al on Fe sites or vice versa (measured compositions were between GdFe3.88(5)Al8 and GdFe3.96(1)Al8; deviations of the Al stoichiometry from were always less than 2 standard deviations and are not listed).
We note that the x-ray-diffraction-structure refinement cannot distinguish between a Fe deficiency due to vacancies and a (larger) Fe deficiency due to Al on Fe sites, both scenarios can give an equal electron density. However, assuming an Al/Fe mixture to retain the full occupancy of the Fe site leads (for one of the investigated crystals) to a GdFe3.92(1)Al8.08(1) composition and, thus, to an excess of Al. Since the electron-microprobe analysis results indicated no significant variations in the ratio of Gd to Al, we did the structure refinements under the assumption that the electron density on the Fe sites is caused by vacancies, although some Al/Fe substitution could never be excluded. Whatever scenario is chosen, none of our conclusions drawn in this article are affected by the issue of whether or not some Al atoms are present on the Fe site, and for definiteness subsequently we will assume that the vacancy scenario is the correct one. The composition of our samples can thus be described with the empirical formula GdFe4-δAl8, with . Surface scans in the electron-microprobe analysis gave no indications of compositional variations within the same crystal.
Since the exact iron stoichiometry varies slightly from crystal to crystal (even within the same growth batch) and this was found to have a significant influence on the magnetic properties (see Sec. III below) most of the measurements presented below were performed on the same crystal, sample I, which has a refined composition GdFe3.96(1)Al8 (Å, Å). A bar cut from the crystal by a wire saw was connected with contacts for 4-point electrical-transport measurements with the current density [110] (sample Ia). Other samples were connected with contacts for electrical transport measurements with either [110] or [001]. On a second bar (sample Ib, which had a mass of ) cut from crystal I we measured the longitudinal magnetization and the zero-field specific heat. In order to investigate the relation between compositional variations and variations in the transition temperatures, we carried out additional magnetization measurements on several other crystals, the composition of which was determined by x-ray diffraction and electron microprobe. The additional crystals are labelled II to VII in the order of their appearance in the text. The above measurements were performed with commercial (Quantum Design) laboratory equipment. For the high-field measurements, the sample orientation was fixed with a two-component glue (X60 from Wägetechnik GmbH, Darmstadt, Germany).
Sample Ib was also used in the XRMS experiment, performed on the 6ID-B undulator beamline in the MUCAT sector at the Advanced Photon Source, Argonne National Laboratory. The incident energy of x-rays was tuned to the Gd edge (), using a liquid nitrogen cooled, double crystal Si (111) monochromator and a bent mirror. Sample Ib was mounted on a copper rod on the cold finger of a closed cycle displex refrigerator, such that a natural (110) facet was exposed to the x-ray beam. Thermal transfer was enhanced by embedding the sample in copper paste. The sample, oriented so that the scattering plane of the experiment was coincident with the plane, was encapsulated in a Be dome with He exchange gas to further enhance thermal transfer. The incident radiation was linearly polarized perpendicular to the scattering plane ( polarized). In this geometry, only the component of the magnetic moment that is in the scattering plane contributes to the resonant magnetic scattering arising from electric dipole transitions () from to states. Furthermore, the dipole resonant magnetic scattering rotates the linear polarization into the scattering plane ( polarization). In contrast, charge scattering does not change the polarization of the incident beam ( scattering). Pyrolytic graphite PG (006) was used as a polarization analyzer, selecting primarily polarized radiation. For , the polarization analyzer used reduces the detected intensity resulting from charge scattering by about , whereas the resonant magnetic scattering is passed with little loss. Thus, the polarization analysis suppresses the charge scattering relative to the magnetic scattering signal.
III Low field measurements and influence of Fe content
In this section, we will first present zero-field transport and low field magnetization measurements on our main crystal (samples Ia/Ib). Then, we will briefly discuss sample-to-sample differences in the characteristic temperatures, which we think are related to Fe deficiency. Finally, we will present specificheat measurements on sample Ib indicating that the Gd moments are ordered only at low temperatures. The main implications of the measurements will be discussed later in Sec. VI.
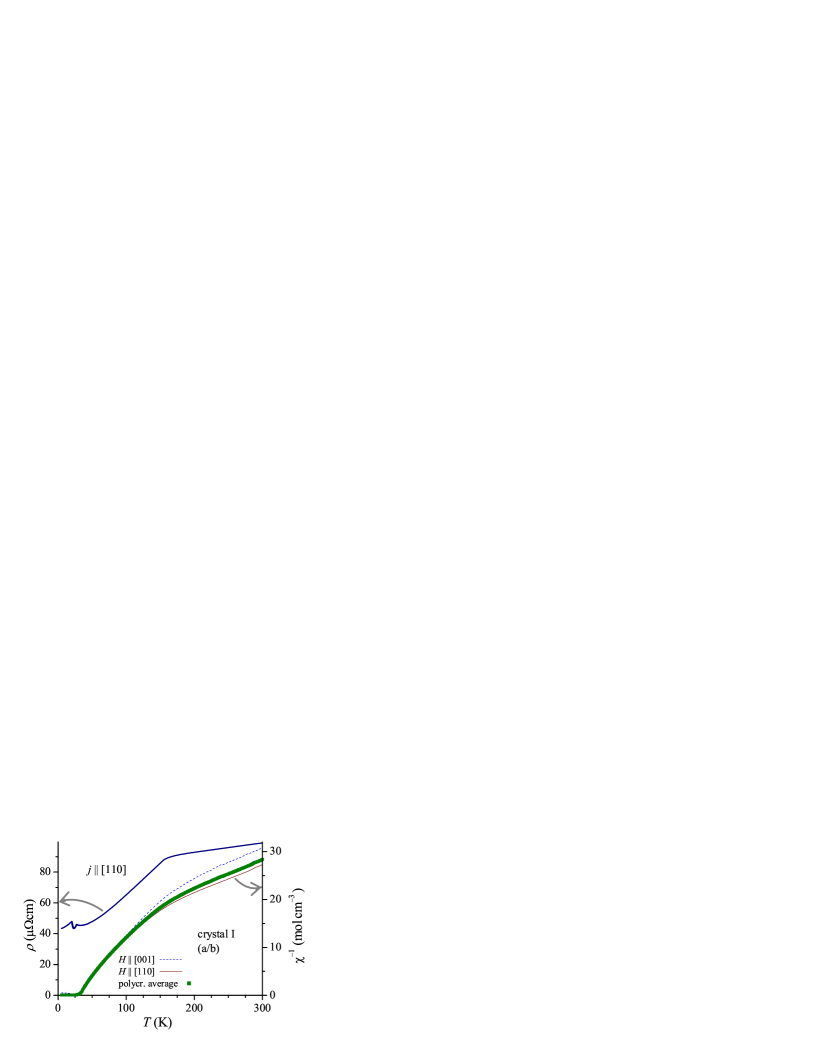
In Fig. 2, we show, for sample Ia, the dependence of the resistivity ([110]). Since the sample is rather small, the estimated uncertainty in the absolute value of the resistivity is about 15%. The antiferromagnetic ordering at is visible as a sharp kink in .note_Palasyuk04 The inverse dc magnetic susceptibility () of sample Ib, cut from the same crystal as sample Ia, is also presented in Fig. 2. The dashed and dotted curves shown are determined from the magnetization in a field of applied parallel to [110] and parallel to [001]. Below this field vs is linear for . Since is slightly anisotropic, we also calculated the polycrystalline average , shown as squares. In for both directions the antiferromagnetic ordering is manifest by a change in slope, but it is much less sharp than the corresponding signature in the resistivity. A weak signature of the Néel transition may be expected if, as we will discuss below, only the Fe moments order at . In agreement with measurements on polycrystalline samples,Buschow78 follows Curie-Weiss behavior both above and, over a limited range, below . We found (on the calculated polycrystalline average) above a Weiss temperature of and an effective moment of . Assuming contributions by the magnetic atoms that are additive in the Curie constant and a contribution by Gd of , the free moment per Fe atom in the paramagnetic state is . Below (range ) we found a Weiss temperature of and an effective moment of . The latter is closer to the Gd free-ion value () than the one reported by Buschow et al.Buschow78 ().
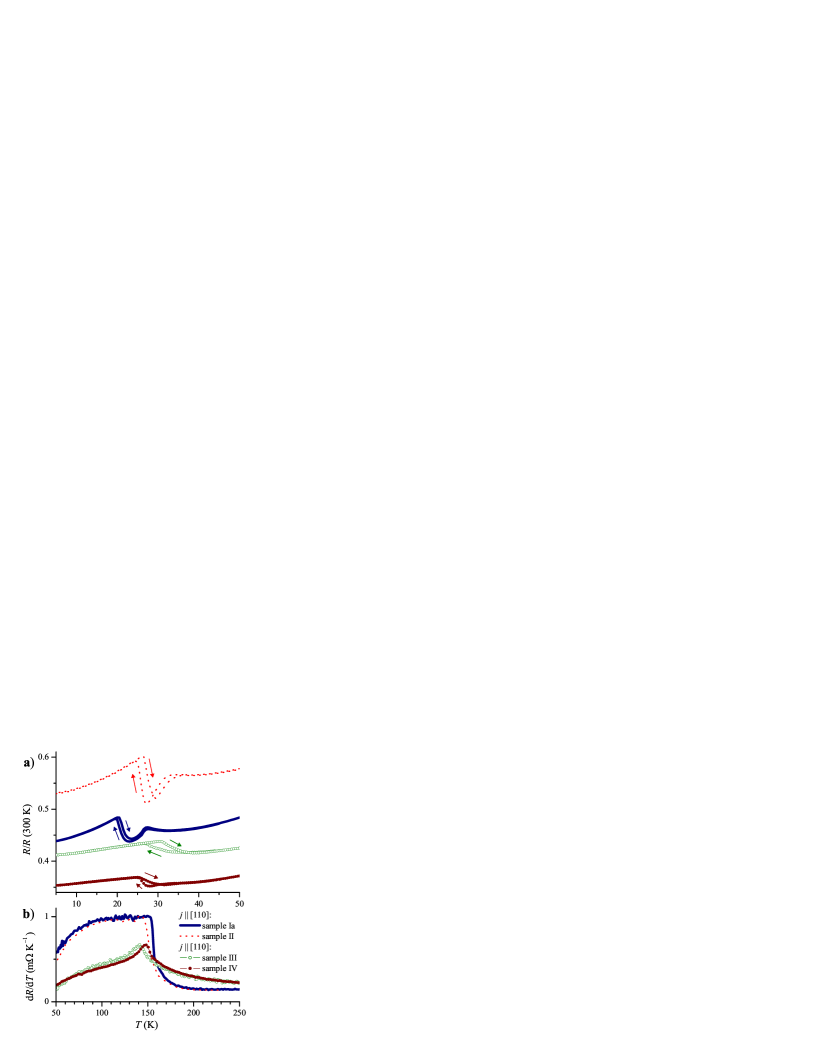
The resistivity curve shows additional features just below , magnified in Fig. 3a) (thick line): The broad peak in at with a drop at () indicates a phase transition. Furthermore, with decreasing , at () there is a sudden increase in by . This feature is hysteretic in temperature, suggesting that the feature is associated with a first-order transition.note_Fujiwara Note that the hysteresis visible at is opposite to what is expected for a first-order transition (i.e., superheating/supercooling). It is most likely a remnant of the hysteresis associated with the transition. At , the form of the hysteresis is consistent with superheating/supercooling.
Also shown in Fig. 3a) are low- zero-field resistivity curves for three additional samples, one also with [110] and two with [001]. Whereas the feature of a sudden increase of with decreasing is visible in all curves, the other feature at slightly higher temperatures is only identifiable when [110]. Based on the results from sample Ia only, it may be tempting to associate the increase in (with decreasing ) with the opening of a superzone gap.Mackintosh62 However, the presence of this increase with the same order of magnitude for both [110] and [001] makes a superzone gap scenario less likely.
It is also clear from Fig. 3a) that there are significant variations of the temperatures corresponding to this feature. For comparison, Fig. 3b) shows the resistivity derivative for the same samples at higher , in order to make the Néel transition more visible, which manifests itself differently for the two current density directions. The curves indicate a sharp, well defined for each sample and comparing Figs. 3a) and 3b) suggests a correlation between higher and lower .
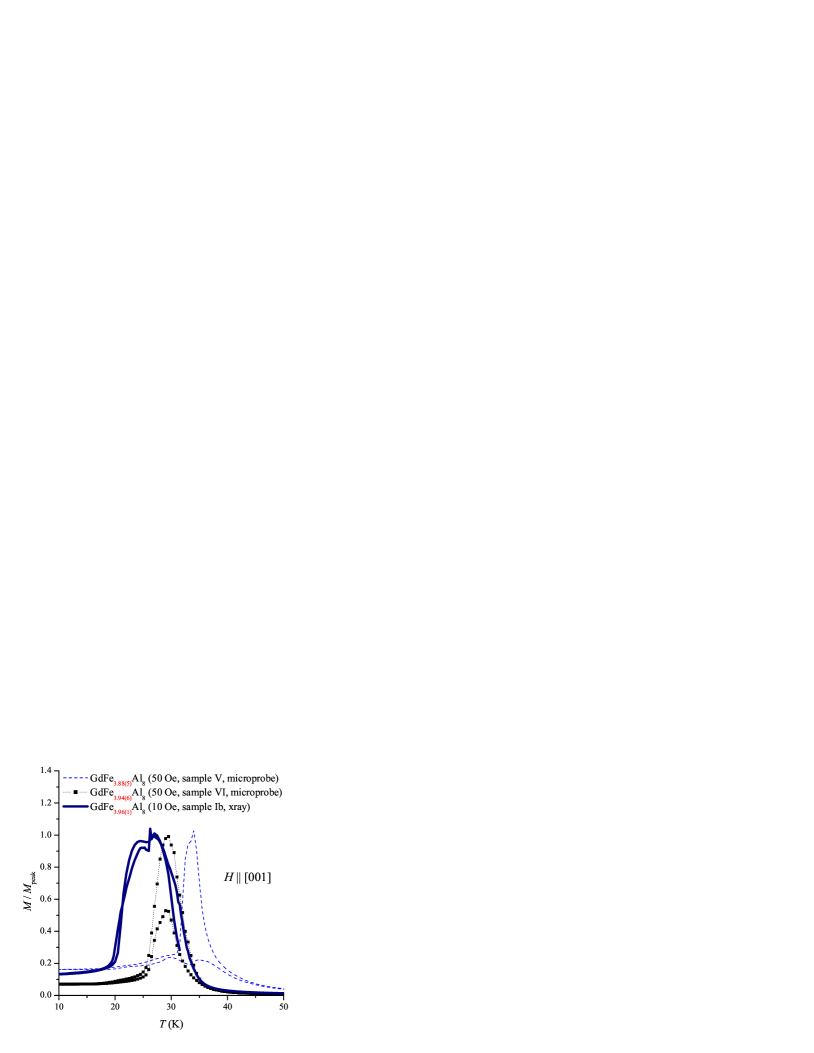
Figure 4 displays low field ([001]) magnetization measurements performed on three samples with different Fe stoichiometry as determined by x-ray diffraction and electron microprobe: samples Ib (GdFe3.96(1)Al8, thick line), V (GdFe3.94(6)Al8, full squares), and VI (GdFe3.88(5)Al8, dashed line). The data were taken for both decreasing and increasing (field cooled), and normalizednote_normalizedM to the maximum in magnetization. A comparison with Fig. 3a) indicates that the rise in with is associated with , the subsequent decrease with . A decrease in the Fe content seems to systematically shift and to higher temperatures. We note that for crystal I (Fig. 4) indicates a higher than [Fig. 3a)]. In principle, this might be due to a different Fe content of the two pieces (Ia and Ib) cut from the crystal and used for these measurements. However, we do not believe that this is the case, because the specific-heat peak associated with (see below; measured on Ib) corresponds well to deduced from on sample Ia.
Combining the above data it seems that decreasing the Fe content results in a decrease of and an increase of and . In order to confirm this, a study involving samples that are much more Fe deficient, would be highly desirable.
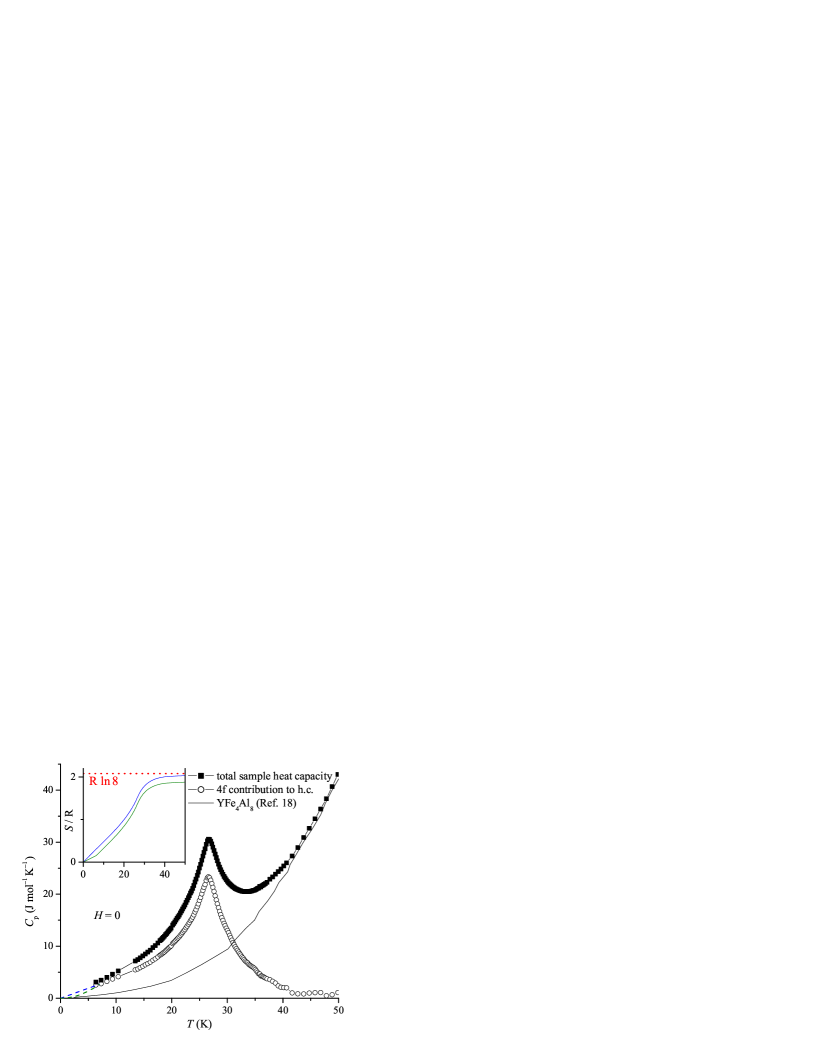
Figure 5 shows the measured specific heat of sample Ib (closed squares) after subtraction of the addenda contribution (the specific heat of sample platform and grease measured before mounting the sample). Also shown is the mass-scaled specific heat of YFe4Al8 from Ref. Hagmusa98, (full line), and the difference between the two specific heats (open circles). Since the necessary mass-scaling is small, the remaining specific heat is close to the magnetic contribution associated with the Gd sublattice. The broad, asymmetric, peak at corresponds to the drop in at [determined on sample Ia cut from the same crystal as sample Ib, see Fig. 3a) dashed curve]. The broadness of the specific-heat peak may suggest a degree of inhomogeneity of the Fe distribution in the sample, although the electron-microprobe analysis provided no indications of inhomogeneities within crystals.
No feature in the specific heat is visible around , the small discontinuity at indicated by the data was found to be an artifact due to the change of the heat pulse intensity applied by the system. We checked the specific-heat raw data, and can exclude any latent heat restricted to a temperature region smaller than the spacing of measurement points. We conclude that the latent heat of the transition has to be small, i.e., the phases above and below have similar entropies. The alternative explanation of the specific heat, that is not a first-order transition, seems unlikely in light of not only the presence, but also the shape of thermal hysteresis observed in , which is particularly clear when a magnetic field is applied in the [110] direction (see Sec. IV below).
The corresponding magnetic entropy , obtained by integration, is shown in the inset of Fig. 5. The two curves shown are calculated with two different extrapolations of to zero temperature (dashed lines in the main panel). One extrapolation is obtained by connecting the data point at the lowest linearly to at zero temperature, the other by connecting the data at the lowest linearly to at zero temperature. Given typically observed specific heats of Gd compounds,note_DuongGdFe2Ge2 the actual specific heat at low temperature will most likely be between these two extrapolations, and thus the two curves shown in the inset of Fig. 5 may be considered lower and upper limits of the Gd entropy (neglecting additional experimental uncertainties). At the magnetic entropy already reaches 80% (78% and 86% for the two low- extrapolations made) of the full entropy of Gd moments (, dashed line). Above it hardly varies anymore, having reached and of the full entropy for the two low- extrapolations made. This strongly suggests that the Gd moments are not ordered above , and the transition at corresponds to the ordering of the moments.
By careful measurement and analysis of the low-field thermodynamic and transport data of solution grown single crystals of Gd148 we have shown that there are sharp features associated with two magnetic phase transitions. These transitions appear to be primarily related to the ordering of the Gd sublattice. In addition we have been able to establish a clear correlation between small variations in the Fe stoichiometry and , , and . Having done this, we will now focus on the sample that is closest to full stoichiometry (crystal I) and try to more fully delineate and understand the field and temperature dependence and the structure of the magnetic phases in this sample.
IV High-field measurements
Applying a magnetic field often helps to clarify the nature of magnetic phases observed in zero (or low) field measurements. We therefore measured the field dependent electrical resistivity and the magnetization on several samples. Shown in this section are electrical transport (subsection IV.1) and magnetization (subsection IV.2) data measured on samples Ia/Ib at low temperatures in fields applied in-plane and out-of-plane. The features in resistivity corresponding to the two low-temperature transitions are much sharper when an in-plane field is applied and observed features suggest complex domain effects. The magnetization data are used to estimate the in-plane and out-of-plane components of the spontaneous ferromagnetic moment. The phase diagrams for [110] and [001], which can be constructed from these transport and magnetization data, will be presented and discussed in Sec. VI.
IV.1 Electrical transport
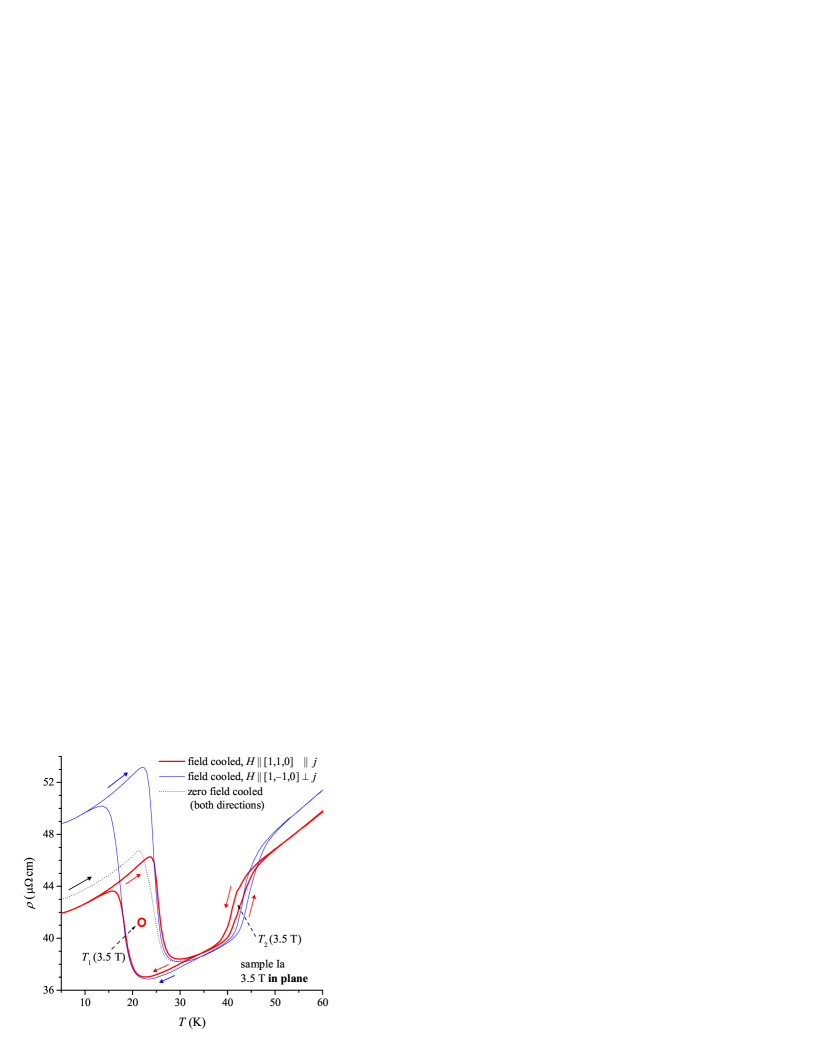
Figure 6 shows the resistivity ([110]) of sample Ia when a field of is applied either (longitudinal resistivity) or (i.e. transverse resistivity, , but in a crystallographically equivalent in-plane direction). For both field directions, the magnitude of the jump at is enhanced and the hysteresis in temperature greatly increased, making the first-order nature of the transition more apparent. The average (,) temperature of the feature, however, is only weakly influenced by an in-plane field. In contrast to this, the feature is shifted to higher by [110], suggesting a ferromagnetic nature of the phase at . Furthermore, the fields remove the peak in just above the drop at , and cause the feature to exhibit hysteresis. This different response to [110] confirms that there are indeed two independent magnetic transitions and , dividing the ordered state below into three magnetic phases, a low-temperature phase (LTP), an intermediate-temperature phase (ITP), and a high-temperature phase (HTP).
Whereas there are similarities in for the two field directions considered, there are also very pronounced differences, particularly for the feature, below which the field cooled is much higher for than for . A transverse magnetoresistance higher than the longitudinal one might arise from a bending of the electron trajectory by the Lorentz force (see, e.g., Ref. Harris95, ). However, the zero-field-cooled below (black dotted line) is the same (within error bars) for and . Indeed, as we will see (Fig. 8 below), at after cooling in zero field the resistivity is only very weakly field dependent for an in-plane field (both for transverse and longitudinal configurations).
This indicates that the difference in the curves of Fig. 6 originates from the magnetism. The magnetoresistance then may arise either from spin-disorder scattering or scattering of domain wallsSingh76 and the difference can be due to a different configuration of domains. In principle, this configuration (domain population, average size of domains, etc.) may be different for (transverse magnetoresistance) and (longitudinal magnetoresistance) due to different demagnetizing effects (the sample was cut in a rod such that the [110] direction is a bout three times longer than the direction). In any case, the fact that the resistivity is almost field-independent (for an in-plane field) at indicates that the relevant (for resistivity) domain configuration in the LTP is very hard to change by applying a magnetic field, whereas a field applied in the ITP prepares a certain LTP domain configuration upon cooling below . We note that application of a field in the ITP also seems to lead to small, but systematic, changes in the resistivity values in the HTP, persisting up to .
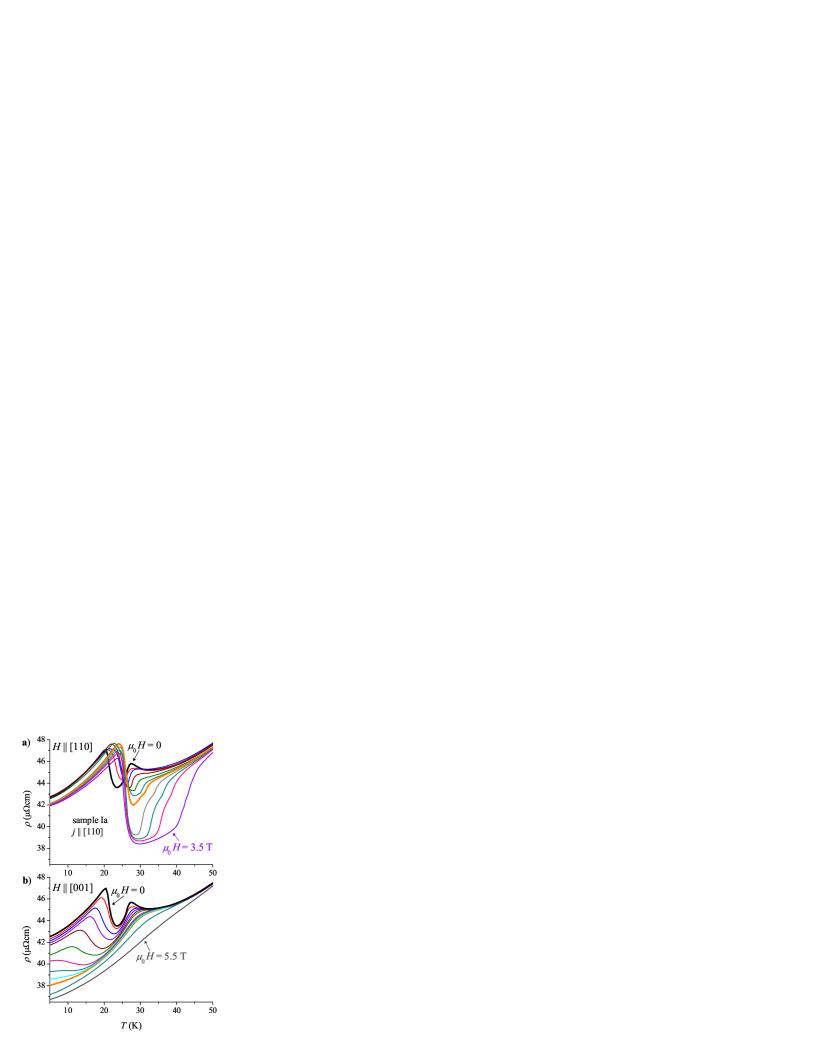
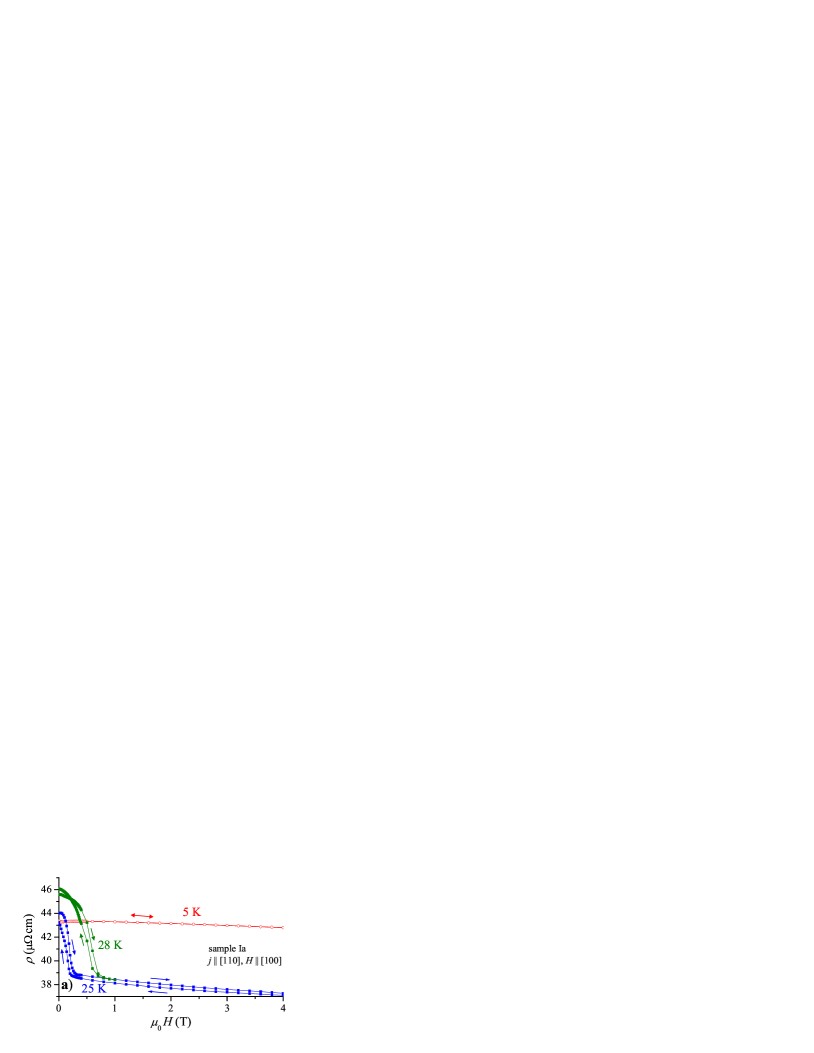
Figure 7a) shows the evolution of [for clarity only the data measured upon warming, after the lowest temperature had been reached by cooling with the same field applied (field-cooled-warming measurement protocol) are displayed] with increasing (again sample Ia, [110]). It seems clear that the transition systematically shifts to higher temperatures with increasing . The transition is far less field dependent (for [110]), and as discussed above, quite hysteretic. Furthermore, the resistivity in the ITP becomes lower in higher , developing into a well-defined weakly temperature-dependent valley above . This development is also visible in the dependence at constant (Fig. 8). There is only a minimal field dependence of at in the LTP. In contrast to this, a pronounced drop in low fields at in the ITP is shifted to higher fields by increasing and seems to transform into the drop associated with the ITP-HTP transition. In the curves of Fig. 7a), for intermediate field ranges, there are indications for an additional feature in the ITP-HTP transition. The details of this feature have to be clarified in future work.
The evolution of with increasing [001] for the same sample and current density direction is shown in Fig. 7b). The data shown were again obtained using the field-cooled-warming measurement protocol, but we note that application of [001] (unlike [110]) quickly suppresses any hysteresis, and broadens the transitions. Apart from a broadening, the transition does not seem to be strongly affected. In contrast to this, [001] systematically shifts the transition to lower temperatures and above there are no longer any indications for a transition to the LTP. This indicates that the LTP is suppressed by [001].
IV.2 Magnetization
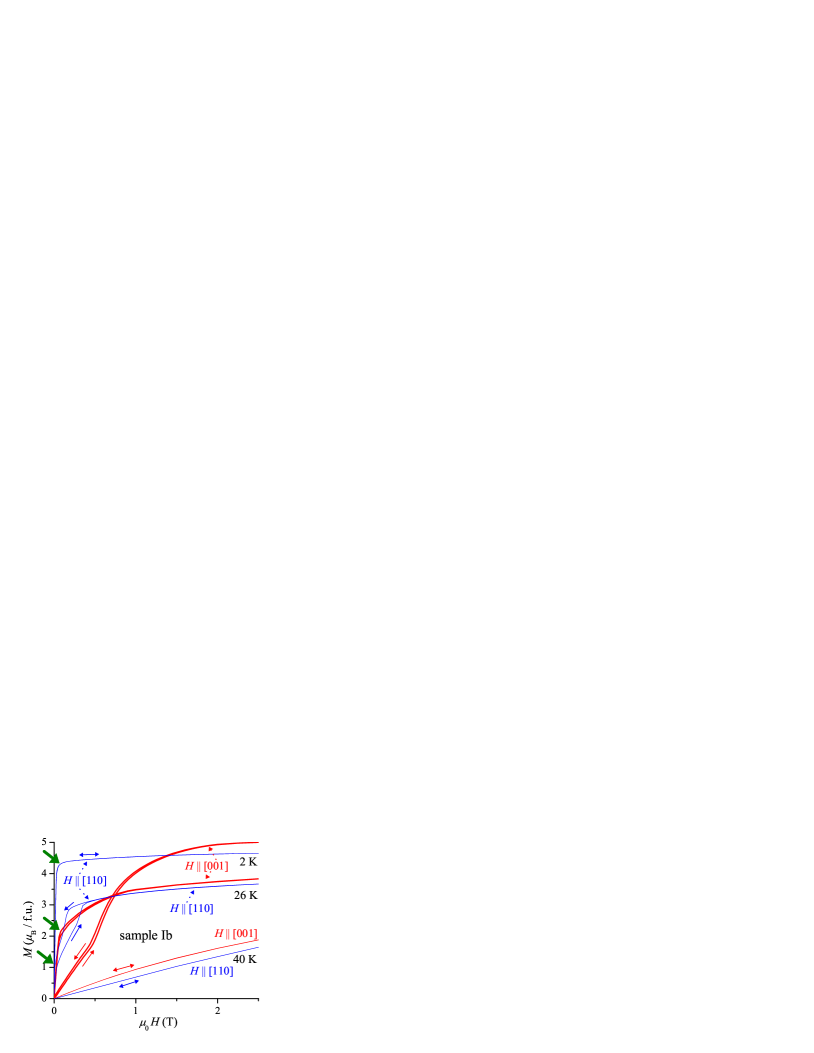
In order to investigate the magnetic nature of these phases, we measured the magnetization as a function of and ([110] and [001]). In Fig. 9, we display for sample Ib loops at selected . For [110], at , shows almost linear behavior, but at has a behavior typical for soft ferromagnets: saturation in a field which is of the order of the estimated demagnetizing field, but no hysteresis or remanence. However, the saturation value of at is much lower than the full Gd moment of . At , pronounced hysteresis is visible in low . This is ubiquitous for in the ITP and correlates with the hysteresis in the drop in visible in Fig. 8a). The hysteresis may suggest a first-order metamagnetic transition. In higher fields is nearly constant, resembling the behavior at . In low fields indicates a spontaneous ferromagnetic moment, unlike at , at we did observe remanence. The dependence of the spontaneous ferromagnetic moment, as estimated from Fig. 9 taking into account demagnetizing effects (we took the magnetization at the first kink in low , indicated by thick arrows in Fig. 9), is shown in Fig. 10 (black squares). The LTP-ITP transition in , [110] is accompanied by a drop of the spontaneous moment to , and by the appearance of hysteresis.
For [001] at (ITP), the form of (Fig. 9 red curves) is consistent with a spontaneous ferromagnetic moment of about . For the LTP consider at . Below , is linear, above it rises more strongly before slowly starting to saturate. The field where starts to increase faster than linear is lower at higher , extrapolating to zero at . For samples with a higher , at low temperatures is proportionally higher (not shown). Whereas the feature at as defined above is rather sharp, the slow saturation of above may be due to a small inhomogeneity of the Fe content in the sample, as discussed in Sec. III.
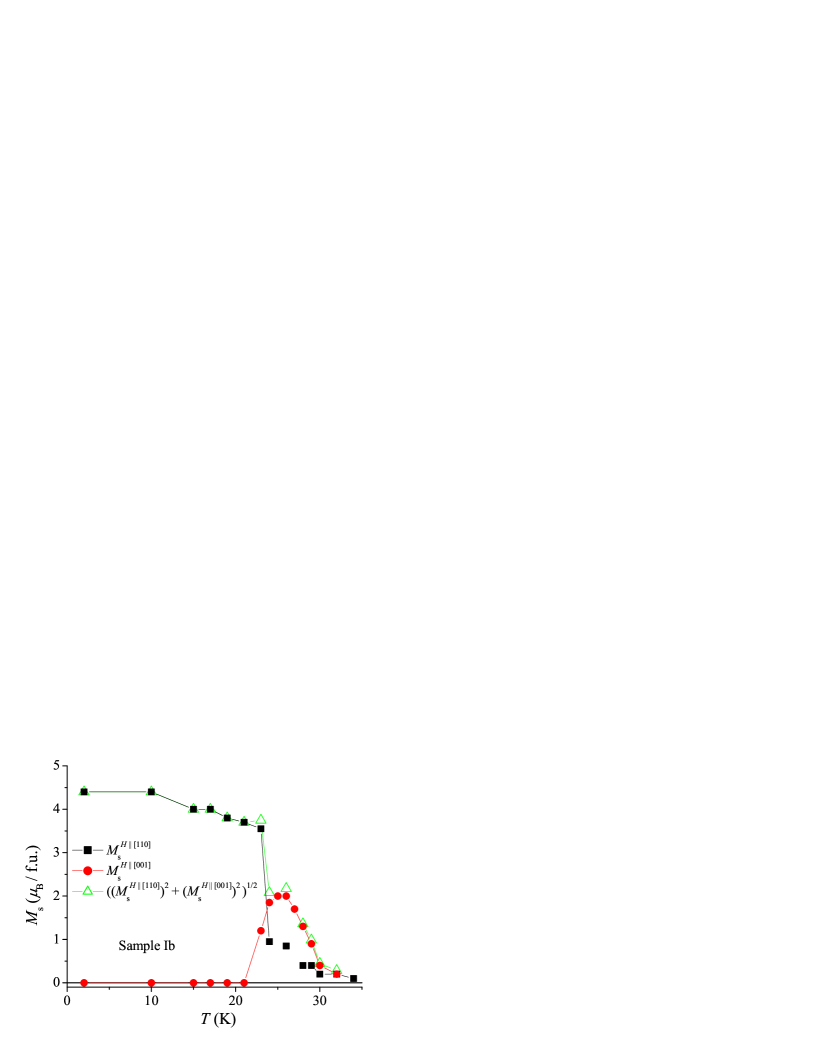
For [001], the saturation value of is higher than for [110], but still far below the full Gd moment. Note that the difference to is much too large to be explained by a negative contribution of the Gd conduction electrons. The low saturated moment implies that the magnetization does not correspond to the magnetization of a simple ferromagnet. For [001], the temperature dependence of the estimated spontaneous ferromagnetic moment is shown in Fig. 10 as red circles. It is similar to in low (c.f. Fig. 4).
The linear behavior (below at ) may be due in-plane ferromagnetic moments resisting a reorientation by an out-of-plane field. The LTP-ITP transition could correspond to a reorientation of ferromagnetically aligned moments (as suggested in Ref. Fujiwara87, ). Figure 10 indicates that in the LTP the ferromagnetically aligned moments are confined to the plane, whereas in the ITP the moments are mainly out-of-plane, pointing into a direction with an angle of about to [001]. A crude estimate of the magnitude of the spontaneous moment is given by , shown in Fig. 10 as open triangles. Apart from one point near the LTP-ITP transition (where the estimation of is less clear than in other regions) the temperature dependence of is consistent with the LTP-ITP transition not affecting the magnitude of the ferromagnetic component, but only it’s direction. Finally, we note that, like the low-field magnetization (Fig. 4 full line), the estimated spontaneous moment extrapolates to zero around , i.e., slightly higher than as indicated by resistivity and the specific heat maximum. This roughly correlates with the onset of the contribution to the specific heat (Fig. 5), which is not sharp at all. We therefore think it is not an indication of an additional transition, rather it may be due to an inhomogeneous Fe distribution or due to significant precursor-effects (e.g. fluctuations).
The electrical-transport and magnetization data presented in this section will allow us to construct phase diagrams for [110] and [001]. We will do this in Sec. VI. Furthermore, we have established that the Gd moment order setting in at has a large ferromagnetic component, and the first-order (see Fig. 6) transition at involves a reorientation of the ferromagnetic component into the plane for . In order to elucidate the underlying magnetic structure we will now focus on scattering data.
V X-ray magnetic resonant scattering
In order to prove the long-range nature of the magnetic order, and to learn more about the magnetic structure than the information that is obtainable from thermodynamic and transport measurements, scattering techniques can be applied, typically neutron scattering. For Gd148, neutron scattering is less feasible because of the large neutron absorption cross-section of the natural isotope of Gd. An alternative technique, which relies on intense synchrotron radiation and exploits a large increase in the scattered intensity due to resonant processes when the energy of the radiation is close to an absorption edge of a magnetically ordered element, is x-ray resonant magnetic scattering (XRMS).Gibbs88 ; Hannon88 ; XRMSreview To gain further insight into the magnetism of Gd148, we therefore performed a first XRMS experiment on the (together with piece Ia from the same crystal) best characterized sample Ib.
Based on the neutron scattering and XRMS results on R148 with other rare earths,Langridge99 ; Paixao00 ; Paixao01 ; Schobinger98 ; Schobinger99 as well as on the thermodynamic and transport results presented in earlier sections, we expected at temperatures between and a modulation of Fe moments with propagation along the [110] direction to be present, with a feasible resonant enhancement of the intensity scattered at the corresponding satellite reflections at the Gd edge. Figure 11a) shows reciprocal space scans along [,,] with polarization analysis and the energy tuned to the Gd edge () at and . At , the charge reflection at (4,4,0) is accompanied by small satellites at (,,) with . The satellite reflections are not present at , indicating that they are due to the magnetic ordering at the Néel temperature (c.f. Fig. 2). We also found satellite reflections at (,,), (,,), and (,,), with , depending on . The full width at half maximum (FWHM) of the satellite reflections is approximately twice the FWHM of the charge reflections. The corresponding smaller correlation length of the magnetic order may be an indication of the presence of small domains. We roughly estimate the average size of the domains (in [110] direction) to be or about unit cells. Rearrangements of these domains might be the cause of the small changes in resistivity values in the HTP (see the discussion of Fig. 6 in Sec. IV.1).
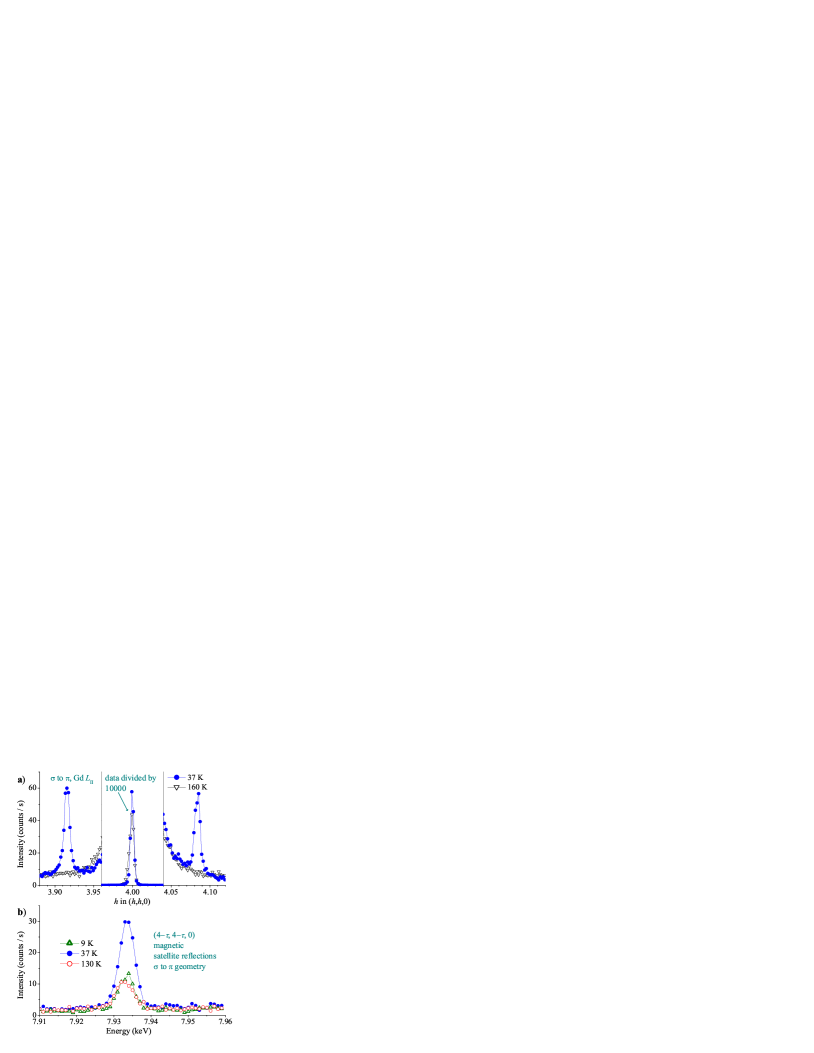
The intensity of the (,,) satellite reflections is about four orders of magnitude lower than the intensity of the (4,4,0) charge reflection, despite the use of the polarization analysis, which suppresses the charge reflection intensity by three orders of magnitude. Due to the small intensity of the satellite reflections and their vicinity to the charge reflections, there is considerable intensity due to the charge tail at the position of the satellite reflections. A slight asymmetry in the charge tail leads to a larger charge contribution to the scattered intensity at the (,,) reflection, and we therefore further analyzed only the (,,) satellite reflection.
Figure 11b) shows, at selected , energy scans over the Gd edge for the satellite reflections at (). The intensity of the resonance is largest at . The lower intensity at is due to the vicinity of the Néel transition, the lower intensity at will be discussed below in Sec. VI. The position and the (amplitude-normalized) peak shape of the resonance is independent within our resolution and consistent with dipolar () transitions.Langridge99 ; Gibbs88 ; Hannon88 ; XRMSreview We note that a resonant enhancement at the Gd edge was observed only at the () satellite reflections, there was no enhancement at the (4,4,0) charge reflection, consistent with resonant magnetic scattering. Reciprocal space scans and the resonant enhancement at the Gd edge are consistent with a magnetic modulation with propagation vector (,,0) associated with Gd.
The specific-heat measurement discussed in Sec. III implies that in the HTP the Gd moments are not ordered. Since XRMS is element-sensitive, this might seem in contradiction to our observation of a resonant magnetic signal at the Gd edge at and (Fig. 11). However, XRMS () of the Gd edges is sensitive to the polarization of the Gd bands, not (directly) to the moments.Langridge99 ; Gibbs88 ; Hannon88 ; XRMSreview A Gd band polarization can also be induced by the Fe moments. For this situation, a very weak intensity of the corresponding magnetic satellites is expected.Everitt95 Compared to other Gd compounds,Granado04 ; Good05 ; Tan05 ; Kim05branch the intensity of the satellite reflections we observed is indeed very weak more than three orders of magnitude lower. This low intensity might be due to the ordered moments pointing into a direction close to [001], since in our scattering geometry we are not sensitive to moments in [001] direction. However, changing the orientation of the sample such that [001] is in the scattering planeLangridge99 ; Tan05 did not significantly change the intensity, suggesting that its low value is not related to the direction of magnetic moments. The behavior is similar to the situation in Dy148 at high temperatures.Langridge99
At this point it may be useful to briefly comment on an XRMS signal coming directly from the Fe moments. This would of course be very important to confirm the above considerations. Unfortunately, the energies of the absorption edges of transition metals do not allow diffraction experiments for regular crystalline materials.Tonnerre95 Resonances at the edge may be used instead, but the x-ray resonant process at transition metal edges is neither well understood nor efficient. Reported resonant enhancements at transition metal edges of magnetic scattering intensities were typically very small and often broad (see, e.g., Refs. Hill97, ; Stunault99, ; Hill00, ; Neubeck01, ; Paolasini02, ), compared to the substantial enhancements often observed at rare earth edges (see for example Refs. Granado04, ; Good05, ; Tan05, ; Kim05branch, ).
An additional problem in our case is the large charge scattering background due to the vicinity of the magnetic satellite reflections to the charge reflections. This is more problematic for Fe edge measurements, because at the Fe edge, the angle of the analyzer crystal for the polarization analysis is further away from the ideal than in the case of the Gd edge, resulting in a significantly higher charge scattering background at the Fe edge. Performing energy scans in the range of the Fe edge () we did not observe a clear resonant enhancement. In view of the mentioned difficulties, this does not, however, imply that the Fe moments are not ordered. Rather, we conclude that the direct observation of an XRMS signal from the Fe moments will need a separate experiment with specialized equipment and enough time to gather high statistics.
Although we did not observe a clear resonant enhancement at the Fe edge, based on the above discussion of the intensity of the XRMS at the Gd edge and the comparison with other R148 compounds, we conclude that the () propagation vector describes the order of the Fe moments. A Fe moment modulation along [110] is common for R148 compounds, but in R148 with other rare earths is typically larger () and varies less with .Paixao00 ; Paixao01 ; Schobinger98 ; Schobinger99
At , the satellite reflections are present as well [Fig. 11b)], with the propagation vector in the same direction. This demonstrates that the Fe moments maintain their modulation from the HTP, where the Gd moments are not ordered, in the LTP, where the Gd moments are ordered. This is similar to the situation in other R148 compounds. However, the low intensity of the () satellite reflections at low indicate that for Gd148, unlike the situation in other R148 compounds,Langridge99 ; Paixao00 ; Schobinger98 the rare-earth moments do not follow the Fe moment modulation. In order to find possible modulations involving the Gd moments, we searched at also for magnetic satellite reflections in other high-symmetry directions. However, full scans along [110], [100], and [001] (for scattering geometries mentioned above) did not turn up any reflections with intensity high enough to correspond to a modulation of a significant part of the moments.
Further XRMS experiments, including tracking the observed magnetic satellite reflections in detail through temperature and applied field, and comparing the resonances at absorption edges other than Gd are planned.
VI Discussion and conclusions
In the following we will discuss our results, starting with the magnetic ordering at the Néel temperature and the nature of the resulting phase. We will then discuss the phase diagrams (for two field directions) at low temperature and the magnetic order in these phases.
Our resistivity and magnetization data indicate that GdFe4Al8 orders magnetically at (see Sec. III). Even small () iron deficiency significantly lowers , indicating that magnetic interactions involving the Fe moments drive the transition. In the x-ray resonant magnetic scattering (XRMS) experiment (Sec. V), the order below was identified as an incommensurate antiferromagnetic order with propagation in [110] direction. Although corresponding satellite reflections were measured on the Gd edge, the dependence of entropy associated with the Gd moments, estimated from specific-heat data (see Fig. 5 in Sec. III), indicates that at high temperature, the Gd moments do not participate in this antiferromagnetic order, which is thus driven by Fe-Fe moment interactions. This can explain the weak intensity of the measured satellite reflections. Antiferromagnetic order propagating in [110] direction, at high confined to Fe moments, seems to be rather typical for Fe4Al8 compounds.
In addition to the Néel transition, we found two more phase transitions at low temperature ( and ), dividing the ordered state into three phases: LTP (low-temperature phase), ITP (intermediate-temperature phase), and HTP (high-temperature phase). Due to the proximity of the two low- transitions it proved to be very useful to apply magnetic fields in two directions and thereby more clearly separate these phases.
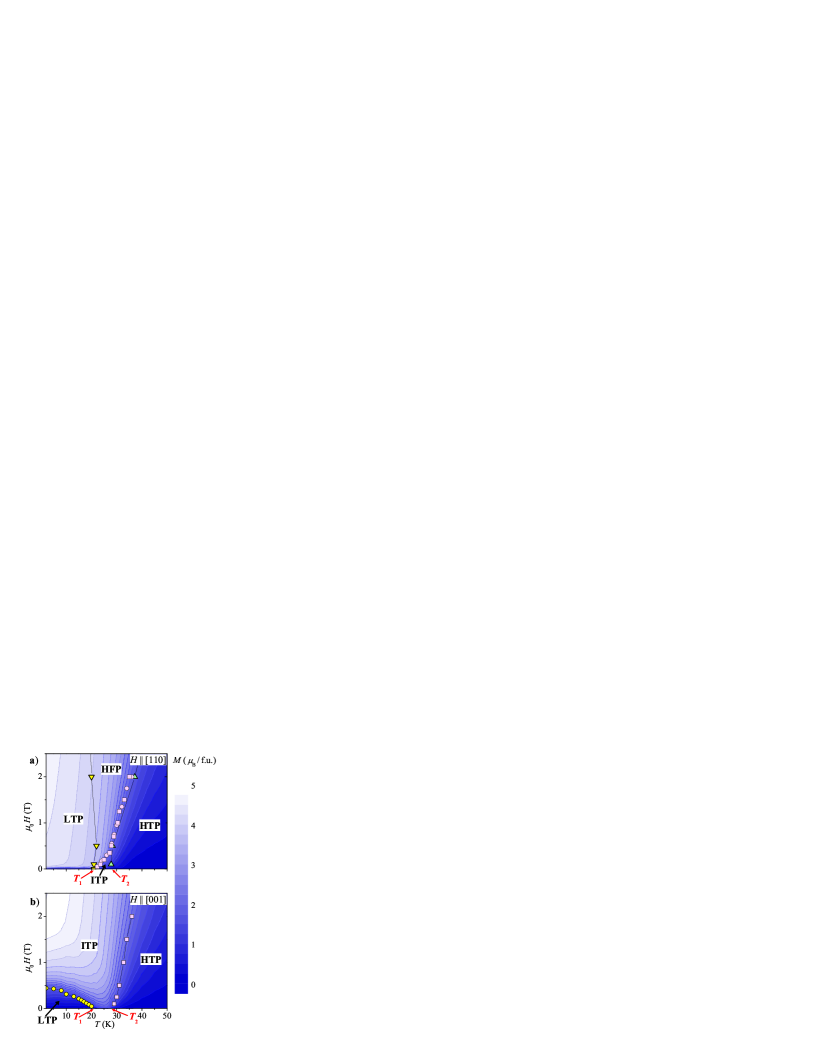
Low-temperature phase diagrams established from resistivity and and magnetization measurements (see Sec. IV) on crystal I (samples Ia and Ib) are presented in Fig. 12 [for [110] in panel a) and for [001] in panel b)]. The phase diagrams are underlaid with a contour-plot of the magnetization [data determined from measurements as displayed in Fig. 9, for increasing].
For [110] [Fig. 12a)] the phase boundaries (,) were determined from measurements [steepest slope, c.f. Fig. 7a); shown is the average between points determined on curves measured with increasing and decreasing]. In the ITP-HTP transition corresponds to, upon decreasing , a steep rise in and saturation. For definiteness, we used the extrema in [], plotted in Fig. 12a) as (). In case of hysteresis we again took the average between or increasing and decreasing. Above , this tracks the ITP-HTP transition deduced from well, but in lower the smallness of the magnetization component in [110] direction leads the transition line established by these criteria two lower , in fact extrapolating to for . The curve measured at (Fig. 9) and the curve measured at (Fig. 8) do suggest an additional metamagnetic transition in the temperature region of the ITP. This transition is what is determined from the criteria above below , starting from in zero field and apparently merging with the boundary to the HTP at about in .
This seems to separate the ITP as deduced from resistivity measurements into two phases, we call the tentative high field phase HFP. In the (longitudinal, [110]) magnetization the HFP is indistinguishable from the LTP, and thus it could be that the HFP is better described as a “modified LTP” phase rather than as a “modified ITP” one. However, the electrical transport data (see, e.g., Fig. 6) clearly indicate a first-order transition separating LTP and HFP. This transition exhibits a wide hysteresis in temperature when [110] is substantial (see Fig. 6) and likely involves complex transformation of domains present in the LTP and in the HFP (see the brief discussion in Sec. IV.1; note that the HFP was not yet introduced there) warranting further investigation. The connection of the LTP-HFP transition with pronounced domain effects might indicate that domains are a significant force driving this transition, but presently this is tentative at best. The large hysteresis associated with the LTP-HFP transition complicates the determination of the equilibrium transition line. Estimating the equilibrium transition by taking the average of the transitions for increasing and decreasing [for this is indicated by an open circle in Fig. 6, in the phase diagram, the transition is indicated by open down triangles] suggests that [110] favors neither the LTP nor the HFP strongly. Similarly, the transition between the ITP and the HTP is hard to pin down from measurements with [110] because of the smallness of the component along [110] of the magnetization. We observed no second “extremum in ”, using this criterion only leads to the transition between the HFP and the ITP, rather than to the one between the ITP and the HTP. For a field applied along [110], resistivity vs temperature measurements clearly indicate two transitions, whereas (longitudinal) magnetization vs temperature measurements indicate only one. Only when examining the spontaneous magnetization along [110] (Fig. 10) is the presence of two separate transitions clearly indicated.
For [001] [Fig. 12b)], three distinct regions in the contour-plot of the magnetization are readily identified with LTP (low ), ITP (high ) and HTP (low ). The transition lines between these phases are qualitatively consistent with what may be deduced from the resistivity measurements presented in Fig. 7b). In contrast to the phase diagram for [110], there are no indications for the presence of additional phases for [001]. Since [001] significantly broadens the features in , we rely here on magnetization measurements (see Figs. 4 and 9) only to draw the transition lines in Fig. 12b). To fix the ITP-HTP transition, we used the same procedure as for [110] (squares). For [001] too, the dependence of the transition and a saturation consistent (considering demagnetizing effects) with a spontaneous moment indicate a ferromagnetic component in the ITP (see also Fig. 10). The LTP-ITP transition is determined from the loops (c.f. Fig. 9), taking the field value where starts to increase faster than linear as the criterion for the transition field. This transition is displayed by yellow circles in Fig. 12b). For the transition line extrapolates to , reaffirming it’s identity as the LTP-ITP transition. It can be seen that [001] quickly suppresses the LTP.
Based on the specific-heat data, we can conclude that the HTP to ITP transition corresponds to the ordering of the Gd moments. Since the magnetization data indicate the presence of a spontaneous ferromagnetic moment in the ITP, this Gd ordering is either ferromagnetic or has a ferromagnetic component. The increase of the transition temperature upon application of a magnetic field (Fig. 12) is consistent with this. Thus, Gd moments do not simply follow the Fe moment order from higher temperatures [this is in contrast to, e.g., DyFe4Al8 (Ref. Paixao00, )].
The transition from the LTP to the ITP seems to be of first-order as indicated by the observation of thermal hysteresis in the resistivity (see Fig. 3) as well as the magnetization (see Fig. 9). Surprisingly though, no feature could be identified in the specific heat corresponding to this transition and any latent heat would have to be very small. The LTP-ITP transition is associated with a lock-in of the observed spontaneous ferromagnetic component (Fig. 10) into the plane in the LTP, but there are no clear indications that its magnitude is changed by the transition. The appearance of an additional antiferromagnetic modulation is possible, at least it is not clear why a pure lock-in transition of a ferromagnetic component should result in a sizeable increase of the resistivity (both for [110] and [001]).
The presence of the HFP in [110] complicates the situation. In fact, there are clear indications (meta-stability) for the first-order nature of the transitions at all boundaries of the HFP. In contrast to this, there are no indications for meta-stability in the ITP-HTP transition. Meta-stability seems to be present in the LTP-ITP transition, but it is much weaker than in any transition from or to the HFP. We point out that the first-order transition lines LTP-HFP and HFP-HTP both seem to extrapolate to in zero field, and therefore the observed smaller meta-stability of the LTP-ITP transition might well be connected with the HFP phase. This is a strong incentive for further investigations of the HFP.
We now attempt to draw a picture accounting for the full magnetic moment of both Gd and Fe. The full ordered moment of Gd is . Since the valence of Gd is fixed and there are no crystal-electric-field effects, this is the same for different compounds, with only small corrections, up to , due to contributions by itinerant electrons (such as the Gd electrons). The full moment of Fe can vary from compound to compound.
We know from the specific heat and XRMS measurements that in the HTP Gd moments (the Gd moments at least) are not ordered, and Fe moments are antiferromagnetically ordered with propagation along [110]. Magnetization measurements further show that there is no significant ferromagnetic component present [see the loops in Fig. 9]. We recall that, according to the x-ray-diffraction-structure refinement and specific-heat measurements, the Gd lattice is fully occupied and that at low temperatures the Gd moments are well ordered. The appearance of a spontaneous ferromagnetic moment below the temperature where the Gd moments start to order (compare Figs. 5 and 10) indicates that the ordering of the Gd moments is ferromagnetic, but the saturation moments for both field directions are far below the (see Fig. 9) expected for a full ferromagnetic alignment of Gd moments. What could be the reason for this?
One possibility is that the Gd moments are not fully ferromagnetically ordered, but rather also have an antiferromagnetic component. However, since we did not find any satellite reflections with high enough intensity to account for the necessary fraction of the full Gd moment in any of the high symmetry directions (see Sec. V, note that the intensity of the () reflection is much too low) this scenario is not very likely.
From high-field measurements on finely ground free powder particles of Gd148 (likely, at least roughly, corresponding to [001], ITP), Duong et al.Duong01 suggested for a ferrimagnetic structure with Gd moments parallel, Fe moments antiparallel to the field, with an antiferromagnetic Fe moment order re-established only in high fields. On the one hand, such a simple ferrimagnetic arrangement of Gd and Fe moments is inconsistent with our observation in the XRMS experiment of the presence of the () satellite reflection characteristic for the antiferromagnetic Fe modulation even at [Fig. 11b)]. On the other hand, a related idea would be consistent with both the XRMS and the magnetization measurements: upon the ferromagnetic ordering of the Gd moments, the Fe moments could pick up a ferromagnetic component, leading to a canted antiferromagnetic structure. Such a canted magnetic structure with a large ferromagnetic component may also explain why the intensity of the () satellite reflection is about three times smaller at (in the LTP) than at (in the HTP). Furthermore, it would also allow Fe to influence the low- transitions, as indicated by the influence of Fe deficiencies on all characteristic temperatures (see Sec. III). The results of a recent dichroism experiment (on a crystal ground to powder), which will be discussed in detail elsewhere, are consistent with such a scenario as well.
This picture covers, at least for the LTP and the HTP, all the data presented in the paper, but without more detailed scattering data it remains speculative. Particularly concerning the ITP and HFP, the absence of scattering data makes detailed conclusions elusive.
Since the direction of the spontaneous ferromagnetic moment is different for the ITP and the LTP, magnetocrystalline anisotropy (MCA) is likely one of the forces driving this transition. In rare earth compounds, MCA typically arises from crystal-electric-field effects. As we mentioned in Sec. I, this source of anisotropy is absent for Gd. Significant MCA that was nevertheless observed for both elemental Gd and Gd compounds has been ascribed to a combination of dipole-dipole interactions and (mainly) anisotropy in the bands.ColarietiTosti03 ; KimPhD The corresponding magnetic-anisotropy energies are much lower than the magnetic-anisotropy energies resulting from crystal-electric-field effects in other rare earths. A weak magnetic-anisotropy energy might also, at least partly, explain why no latent heat could be observed at . In Gd148, anisotropy in the Fe bands might be an additional source of MCA.note_Lu148 In any case, the different spontaneous moment direction in the ITP likely results in a different structure of the Fe moments. The apparent shift of upon changing the Fe stoichiometry may be taken as an indication of the involvement of Fe moments in the LTP-ITP transition. Before going any further in the discussion of the driving forces (there is likely a delicate balance between multiple energy scales) of the transitions between LTP, ITP, and HFP, the magnetic structures of these phases need to be solved. With this aim in mind, additional scattering experiments are planned.
Regardless of the details of the magnetic structure at low temperature, it is important to point out that i) on the one hand, the Fe moments have at least a component antiferromagnetically modulated in [110] direction ii) The Gd moments, on the other hand can not have a component ordered with the same propagation as the Fe moments, because then the intensity of the reflections measured at would have to be orders of magnitude higher (see Sec. V). This is strikingly different from the behavior for example in Dy148, where the rare earth moments order at lower temperature, but then follow the Fe moment modulation, and it implies a co-existence of two distinct orders associated with Gd and Fe moments. Whereas compounds in which one magnetic sublattice orders at temperatures much lower than the other magnetic sublattice are not very rare (indeed this was well known to be the case for R148 compounds in general), we are aware of only one example, PrBa2Cu3O6.92,Hill00 in which the magnetic sublattice ordering at lower has no component with the same modulation that the other sublattice has at all .
The at low temperatures persisting antiferromagnetic modulation of the Fe moments coexisting with an order of the Gd moments with a large ferromagnetic component and without a component having the Fe moment modulation is the central point of our paper. It may indicate a modified relation between the strength of the Gd-Gd and Gd-Fe moment interactions in Gd148 as compared to other R148 compounds. As we mentioned, apart from the stronger couplings between and conduction electrons in general, the most peculiar property of Gd is the absence of crystal-electric-field effects.
It seems remarkable that in the absence of the MCA due to crystal electric field effects, the magnetic behavior in Gd148 is more complex than in other R148. Likely, strong crystal-electric-field effects play a central role in the magnetism in R148 (except for Gd148). E.g., in Dy148, crystal-electric-field effects press the moments into the crystallographic plane, making an order following the Fe-moment modulation more probable, since the Fe moments are already in-plane. Our results on Gd148, in contrast, indicate a complex interplay of local and itinerant moments when crystal-electric-field effects are absent.
VII Summary
We presented an extensive set of data including magnetization, electrical transport, specific heat, and x-ray resonant magnetic scattering, measured on flux-grown single crystals of GdFe4Al8. We found that two transitions at and at low temperature divide the ordered state below , where Fe moments order antiferromagnetically with modulation along [110], into three phases. The corresponding phase diagrams for fields applied in [110] and [001] direction were presented.
Gd moments order, mainly ferromagnetically, below . Above the ferromagnetic component of the moments points into a direction close to [001], whereas below the ferromagnetic component is locked into the plane. The Gd moment order is distinct from the Fe-moment order At low temperature : the Fe moments still have at least a component modulated along [110], but the Gd moments apparently do not have such a component. We proposed a canted antiferromagnetic structure of the Fe moments at low , which can cover all the low- data presented in the paper, but to some extent still is speculative. Above The transition at likely involves a delicate balance of multiple energy scales associated with both Gd and Fe.
The complex magnetism in GdFe4Al8 as compared to Fe4Al8 compounds with other rare earths likely is related to a modified ratio of coupling strengths and to the absence of crystal-electric-field effects. In order to further elucidate the structure of the magnetic phases of GdFe4Al8 additional scattering experiments are planned.
Acknowledgements.
We thank S. L. Bud’ko, P. Ryan, and R. W. McCallum for useful discussions, P. Ryan also for technical assistance during the synchrotron experiment. Ames Laboratory is operated for the U.S. Department of Energy by Iowa State University under Contract No. W-7405-Eng-82. This work was supported by the Director for Energy Research, Office of Basic Energy Sciences. Synchrotron work was performed at the MuCAT sector at the Advanced Photon Source supported by the U.S. DOE, BES, and OS under Contract No. W-31-109-Eng-38.References
- (1) I. A. Campbell, J. Phys. F: Metal Phys. 2, L47 (1972).
- (2) K. H. J. Buschow and A. M. van der Kraan, J. Phys. F: Met. Phys. 8, 921 (1978).
- (3) I. Felner and I. Nowik, J. Phys. Chem. Solids 39, 951 (1978).
- (4) H. Fujiwara, W.-L. Liu, H. Kadomatsu, and T. Tokunaga, J. Magn. Magn. Mater. 70, 301 (1987).
- (5) N. P. Duong, E. Brück, F. R. de Boer, and K. H. J. Buschow, Physica B 294-295, 212 (2001).
- (6) N. P. Duong, E. Brück, P. E. Brommer, A. de Visser, F. R. de Boer, and K. H. J. Buschow, Phys. Rev. B 65, 020408(R) (2001).
- (7) S. Langridge, J. A. Paixão, N. Bernhoeft, C. Vettier, G. H. Lander, D. Gibbs, S. A. Sørensen, A. Stunault, D. Wermeille, and E. Talik, Phys. Rev. Lett. 82, 2187 (1999).
- (8) J. A. Paixão, M. Ramos Silva, S. A. Sørensen, B. Lebech, G. H. Lander, P. J. Brown, S. Langridge, E. Talik, and A. P. Gonçalves, Phys. Rev. B 61, 6176 (2000).
- (9) J. A. Paixão, M. R. Silva, J. C. Waerenborgh, A. P. Gonçalves, G. H. Lander, P. J. Brown, M. Godinho, and P. Burlet, Phys. Rev. B 63, 054410 (2001).
- (10) P. Schobinger-Papamantellos, K. H. J. Buschow, and C. Ritter, J. Magn. Magn. Mater. 186, 21 (1998).
- (11) P. Schobinger-Papamantellos, K. H. J. Buschow, I. H. Hagmusa, F. R. de Boer, C. Ritter, and F. Fauth, J. Magn. Magn. Mater. 202, 410 (1999).
- (12) Z. Fisk and J. P. Remeika, in Handbook on the Physics and Chemistry of Rare Earths (Elsevier, Amsterdam, 1989), Vol. 12.
- (13) P. C. Canfield and Z. Fisk, Phil. Mag. B 65, 1117 (1992).
- (14) P. C. Canfield and I. R. Fisher, J. Crystal Growth 225, 155 (2001).
- (15) J. C. Waerenborgh, P. Salamakha, O. Sologub, A. P. Gonçalves, C. Cardoso, S. Sério, M. Godinho, and M. Almeida, Chem. Mater. 12, 1743 (2000).
- (16) Y. Janssen, M. Angst, K. W. Dennis, R. W. McCallum, and P. C. Canfield, cond-mat/0506587.
- (17) Consistent with measurements on polycrystalline Gd148. See A. M. Palasyuk, B. Ya. Kotur, E. Bauer, H. Michor, and G. Hilscher, J. Alloys Compd. 367, 205 (2004).
- (18) Indications for a transition around (but not its first order nature) were earlier found by Fujiwara et al.Fujiwara87 Their torque measurements indicate a change of the angle between the magnetic easy axis and the plane from at high to at low .
- (19) A. R. Mackintosh, Phys. Rev. Lett. 9, 90 (1962).
- (20) Due to demagnetization effects, the magnetization at the peak maximum can vary drastically from sample to sample. Normalization allows to better compare transition temperatures.
- (21) I. H. Hagmusa, E. Brück, F. R. de Boer, and K. H. J. Buschow, J. Alloys Compd. 278, 80 (1998).
- (22) See, e.g., N. P. Duong, E. Brück, P. E. Brommer, J. C. P. Klaasse, F. R. de Boer, and K. H. J. Buschow, J. Magn. Magn. Mater. 242-245, 813 (2002).
- (23) J. M. Harris, Y. F. Yan, P. Matl, N. P. Ong, P. W. Anderson, T. Kimura, and K. Kitazawa, Phys. Rev. Lett. 75, 1391 (1995).
- (24) R. L. Singh, Phys. Rev. B 14, 4106 (1976).
- (25) D. Gibbs, D. R. Harshman, E. D. Isaacs, D. B. McWhan, D. Mills, and C. Vettier, Phys. Rev. Lett. 61, 1241 (1988).
- (26) J. P. Hannon, G. T. Trammell, M. Blume, and D. Gibbs, Phys. Rev. Lett. 61, 1245 (1988).
- (27) For a recent review see articles in Synchrotron Radiation News, Vol. 14, No. 5 (2001).
- (28) B. A. Everitt, M. B. Salamon, B. J. Park, C. P. Flynn, T. Thurston, and D. Gibbs, Phys. Rev. Lett. 75, 3182 (1995).
- (29) E. Granado, P. G. Pagliuso, C. Giles, R. Lora-Serrano, F. Yokaichiya, and J. L. Sarrao, Phys. Rev. B 69, 144411 (2004).
- (30) W. Good, J. Kim, A. I. Goldman, D. Wermeille, P. C. Canfield, C. Cunningham, Z. Islam, J. C. Lang, G. Srajer, and I. R. Fisher, Phys. Rev. B 71, 224427 (2005).
- (31) L. Tan, A. Kreyssig, J. W. Kim, A. I. Goldman, R. J. McQueeney, D. Wermeille, B. Sieve, T. A. Lograsso, D. L. Schlagel, S. L. Bud’ko, V. K. Pecharsky, and K. A. Gschneidner, Jr., Phys. Rev. B 71, 214408 (2005).
- (32) J. W. Kim, Y. Lee, D. Wermeille, B. Sieve, L. Tan, S. L. Bud’ko, S. Law, P. C. Canfield, B. N. Harmon, and A. I. Goldman, Phys. Rev. B 72, 064403 (2005).
- (33) J. M. Tonnerre, L. Sève, D. Raoux, G. Soullié, B. Rodmacq, and P. Wolfers, Phys. Rev. Lett. 75, 740 (1995).
- (34) J. P. Hill, C.-C. Kao, and D. F. McMorrow, Phys. Rev. B 55, R8662 (1997).
- (35) A. Stunault, F. de Bergevin, D. Wermeille, C. Vettier, Th. Brückel, N. Bernhoeft, G. J. McIntyre, and J. Y. Henry, Phys. Rev. B 60, 10170 (1999).
- (36) J. P. Hill, D. F. McMorrow, A. T. Boothroyd, A. Stunault, C. Vettier, L. E. Berman, M. v. Zimmermann, and T. Wolf, Phys. Rev. B 61, 1251 (2000).
- (37) W. Neubeck, C. Vettier, F. de Bergevin, F. Yakhou, D. Mannix, O. Bengone, M. Alouani, and A. Barbier, Phys. Rev. B 63, 134430 (2001).
- (38) L. Paolasini, R. Caciuffo, A. Sollier, P. Ghigna, and M. Altarelli, Phys. Rev. Lett. 88, 106403 (2002).
- (39) M. Colarieti-Tosti, S. I. Simak, R. Ahuja, L. Nordström, O. Eriksson, D. Åberg, S. Edvardsson, and M. S. S. Brooks, Phys. Rev. Lett. 91, 157201 (2003).
- (40) J.-W. Kim, Ph.D. thesis, Iowa State University, 2005.
- (41) We note that in preliminary measurements, we observed significant anisotropy in the dc magnetic susceptibility in the ordered state of Lu148, which seems to indicate that substantial MCA can arise from Fe alone.