Atom-molecule dark states in a Bose-Einstein condensate
Abstract
We have created a dark quantum superposition state of a Rb Bose-Einstein condensate (BEC) and a degenerate gas of Rb2 ground state molecules in a specific ro-vibrational state using two-color photoassociation. As a signature for the decoupling of this coherent atom-molecule gas from the light field we observe a striking suppression of photoassociation loss. In our experiment the maximal molecule population in the dark state is limited to about 100 Rb2 molecules due to laser induced decay. The experimental findings can be well described by a simple three mode model.
pacs:
34.50.Rk, 32.80.Pj, 03.75.Nt, 42.50.GyThe phenomenon of coherent dark states is well known in quantum optics and is based on a superposition of long-lived system eigenstates which decouples from the light field. Since their discovery Ari76 dark states have found numerous applications. Prominent examples are electromagnetically induced transparency and lasing without inversion Har97 , sub-recoil laser cooling Asp88 , and ultra-sensitive magnetometers Sta02 . A particular application is the coherent transfer of population between two long-lived states by a stimulated Raman adiabatic passage (STIRAP) Bergmann .
In the emerging field of ultracold molecules, the conversion of atomic into molecular BECs is a central issue. A series of recent experiments on the creation of molecular quantum gases rely on the application of Feshbach resonances molecules . This coupling mechanism, however, is restricted to the creation of molecules in the highest ro-vibrational level and is only practicable for a limited number of systems. As a more general method a stimulated optical Raman transition can directly produce deeply bound molecules as demonstrated a few years ago Wynar ; Tol01 . STIRAP was proposed as a promising way for a fast, efficient and robust process to convert a BEC of atoms into a molecular condensate Vardi ; Jul98 ; Mackie ; Hop01 ; Drummond ; Dam03 . The central prerequisite for this kind of STIRAP is a dark superposition state of a BEC of atoms and a BEC of molecules.
In this Letter, we report the observation of such a collective multi-particle dark state in which atoms in a BEC are pairwise coupled coherently to ground state molecules.
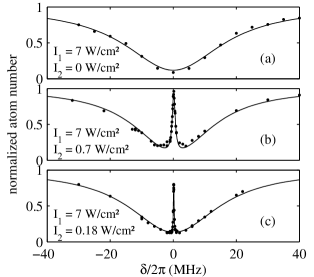
This dark atom-molecule BEC shows up in a striking suppression of photoassociative loss, as illustrated by the spectra in Fig. 1. In one-color photoassociation, the excitation of a molecular transition produces a resonant loss feature that reflects the optical transition linewidth, see Fig. 1(a). The presence of a second laser field coupling the electronically excited molecular state to a long-lived ground-state level can drastically reduce this loss, as shown in Fig. 1(b) and (c). In (b), for example, we observe a striking loss suppression by about a factor of 70 on resonance.
Already the mere observation of an atom-molecule dark resonance in a BEC proves that a coherent, quantum degenerate gas of molecules has been formed. This follows from the facts that 1) the dark state is by definition a coherent superposition of atoms and molecules and 2) the atomic BEC is a coherent matter-wave. In this fully coherent situation, the molecular fraction itself must be quantum degenerate with a phase-space density corresponding to the number of molecules. The very narrow resonance lines indicate the high resolution of our measurements and the potential sensitivity of the dark state as an analysis tool. Using a BEC allows direct interpretation and clear understanding of our data without ambiguity. Thermal averaging of signal features plays no role in contrast to previous measurements in thermal gases Sch03 ; Tol01 ; Lis02 .
The starting point of our measurements is a BEC of 87Rb atoms in the spin state Thalhammer . In the level scheme of Fig. 2 the atomic BEC state is represented by . Laser 1 couples this state to the excited molecular state . Laser 2 couples to the molecular ground state . We choose level to be the electronically excited molecular state located below the dissociation asymptote Thalhammer . For level we choose the second to last bound state in the ground state potential. It has a binding energy of Wynar . , and form the lambda-system for the atom-molecule dark states.
We illuminate the trapped condensate for typically 10 ms with two phase-locked laser beams in a Raman configuration as shown in Fig. 2. Both laser beams are derived either from a single diode laser or, for higher optical powers, from a Ti:Sapphire laser. The frequency difference between the two beams is created with an acousto-optical modulator at a center frequency of about 320 MHz in a double-pass configuration. This allows precise control of the beams’ relative frequency difference over several tens of MHz. Both beams propagate collinearly and are aligned along the weak axis of the trap. They have a waist of about 100 µm, and their linear polarization is perpendicular to the magnetic bias field of the trap. The diode laser and the Ti:Sapphire laser both have line widths of less than 1 MHz. They are offset locked relative to the -line of atomic rubidium with the help of a scanning optical cavity. This yields an absolute frequency stability of better than 10 MHz.
We are able to describe all our spectra with a relatively simple three mode model. Although the atom-molecule dark states are intrinsically complicated and entangled, in a first approximation the atoms and molecules can be represented as coherent matter fields Vardi ; Jul98 ; Mackie ; Hop01 ; Drummond ; Dam03 . Using the notation of M. Mackie et al. Mackie we obtain a set of differential equations for the normalized field amplitudes , , and of the BEC state, the excited molecular and ground state, respectively:
| (1) | ||||
We refer to as the free-bound Rabi frequency (see Fig. 2). It scales with intensity of laser 1 and initial atom density as . The bound-bound Rabi frequency only depends on the intensity of laser 2. The detunings and are defined as depicted in Fig. 2. and denote the effective decay rates of state and (for details see Fig. 2). , and give the ratio between the respective atom (molecule) number and the initial atom number. In the absence of losses, i.e. , particle numbers are conserved globally, . Unlike the previous theoretical treatments Vardi ; Jul98 ; Mackie ; Hop01 ; Drummond ; Dam03 where the decay rate was basically neglected, we find that is relatively large and intensity dependent, . In our simple model we do not include atomic continuum states other than the BEC state. We neglect inhomogeneity effects due to the trapping potentials and finite size laser beams. Energy shifts caused by the mean-field interaction of atoms and molecules are small and neglected.
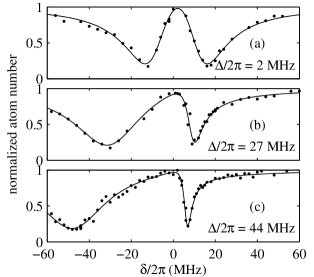
In order to determine the parameters of our model and to check it for consistency, we performed measurements in a broad parameter range of intensities and detunings. Fits to the photoassociation curves determine all unknown parameters of the system such as , , and . Figure 3 shows photoassociation spectra for a relatively high laser power 20 W/cm2 and various detunings . For a small detuning (Fig. 3 (a)) the dark resonance line from Fig. 1 has broadened considerably. This spectrum can also be viewed as two absorption lines resulting from a strong Autler-Townes splitting which was also observed in thermal gases Tol01 ; Sch03 . From the 30 MHz separating the two resonance dips, the magnitude of the Rabi frequency can be directly determined. For a larger detuning , the resulting spectrum becomes asymmetric and turns into a narrow and a broad dip, see Fig. 3 (b) and (c). The narrow loss feature is related to the two-photon Raman transition while the broad dip is due to the one-photon transition . Note that similar to Fig. 1, losses are suppressed at .
Figure 4 shows the dark resonances in the low power limit where is held constant and is lowered in 4 steps. The dark state transforms more and more into a grey state, because losses become more dominant due to a nonzero decay rate . The height of the dark resonance decreases when the pumping rate comes in the range of the decay rate of the molecular ground state . This allows for a convenient determination of . From Fig. 4 it is also clear that the width of the dark resonance decreases with . For the width is given by , corresponding to power broadening and the effective ground state relaxation.
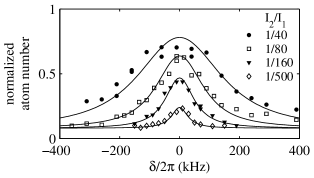
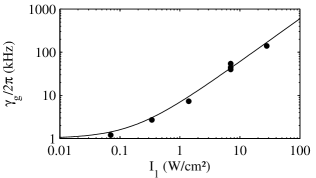
The following set of parameters describes all our measurements quite accurately and was used in particular for the calculated solid lines in Fig. 4: at a peak density of , , and . We find that the decay rate of the ground state molecular level increases with the intensity of laser 1 as shown in Fig. 5. A dependence of on was negligible in our experiments where typically . We model the behavior of as , the sum of a light-induced decay rate proportional to and background decay rate due to inelastic collisions in the absence of light. From measurements at low intensities we can estimate an upper value for the background decay rate of about for . This value for is consistent with previous experimental results for 87Rb at similar atom densities Wynar . The increase of with is due to several imperfections which break the ideal 3-level lambda system. Laser 1 also couples the molecular ground state to the short-lived excited molecular state , which leads to an incoherent loss of the molecules due to spontaneous decay. Due to the rather small frequency difference ( MHz) of the two Raman lasers and the strong bound-bound transition, this cannot be neglected. In addition, only 290 MHz below level exists another excited molecular state which represents an additional loss channel Thalhammer . These two contributions explain about one third of our observed losses. Furthermore, losses can also stem from a photodissociation transition which couples ground state molecules directly to the continuum above the dissociation asymptote.
Having determined the parameters we can use model (1) to calculate the fraction of ground state molecules . For the measurements presented in Fig. 4 we have a peak molecular fraction of corresponding to about 100 molecules (at and ). For comparison, for the molecule number is only about 25 at . It is interesting to note how few molecules are needed to stabilize almost a million atoms against photoassociation. This large asymmetry of the particle numbers reflects the different coupling strengths of the free-bound and bound-bound transitions. Naturally the question arises how the experimental parameters should be chosen to optimize the number of molecules. This is non-trivial due to the finite decay rate . With model (1) we have numerically mapped out molecule numbers as a function of time, detuning and laser intensities, starting out with a pure atomic BEC and simply switching on the lasers. In general within a few s of evolution, the dark state is formed. This involves only negligible losses of atoms since the dark state is very close to our initial BEC state.
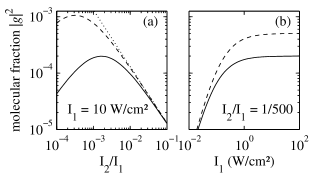
The maximum number of molecules of every evolution is then determined. We find that we can optimize the molecular production by working at although other values for can be used. For the maximum number of molecules correspond to , hence both lasers are on resonance. Figure 6 shows the molecular fraction as a function of the laser intensities. In Fig. 6(a), as is lowered from high values, the molecule fraction initially grows and follows a straight dotted line which coincides with the ideal route for STIRAP. Following this route would lead to a full conversion of atoms into molecules in the absence of loss . This can be seen from Eqs. (1) when setting and such that . For finite , however, the molecular fraction curve rolls over for some value of , when the molecule loss rate is larger than its production rate. A smaller would lead to a larger number of molecules (dashed line). The finite in our experiments leads to a maximum molecule number at , a ratio which we also used in our measurements (see Fig. 4, open diamonds). For this optimum value the dependence of the molecular fraction on is shown in Fig. 6(b). Here it becomes clear that the laser intensities have to be kept above a certain threshold so that losses are not dominated by the background decay rate of the molecular state.
To summarize, we have created a novel multi-particle dark state where an optical Raman transition coherently couples an atomic Rb BEC of about 4105 atoms to a quantum degenerate gas of up to 100 Rb2 ground state molecules. Our investigations can be extended in a straight forward manner to create and study BECs of arbitrarily deeply bound molecules and coherent atom/molecule mixtures. The dark resonance has proven itself as a useful tool to analyze the atom-molecule system and to optimize the optical conversion of atomic to molecular BECs. An increase of the number of molecules by several orders of magnitude should be possible by choosing better suited ground and excited molecular states for the free-bound Raman transition.
We appreciate the help of George Ruff and Michael Hellwig at an early stage of the experiment. We thank Paul Julienne, Eite Tiesinga, Peter Drummond and Karen Kheruntsyan for valuable discussions. This work was supported by the Austrian Science Fund (FWF) within SFB 15 (project parts 12 and 17) and the European Union in the frame of the Cold Molecules TMR Network under contract No. HPRN-CT-2002-00290.
References
- (1) E. Arimondo and G. Orriols, Lett. Nuovo Cim. 17, 333 (1976).
- (2) For a review see S.E. Harris, Physics Today 50, 36 (1997).
- (3) A. Aspect et al., Phys. Rev. Lett. 61, 826 (1988).
- (4) M. Stähler et al., Opt. Lett. 27, 1472 (2002).
- (5) K. Bergmann, H. Theuer, and B.W. Shore, Rev. Mod. Phys. 70, 1003 (1998).
- (6) For a review D. Kleppner, Phys. Today 57, 12 (2004).
- (7) R. Wynar, R.S. Freeland, D.J. Han, C. Ryu, and D.J. Heinzen, Science 287, 1016 (2000).
- (8) B. Laburthe Tolra, C. Drag, and P. Pillet, Phys. Rev. A 64, 061401 (2001).
- (9) A. Vardi, D. Abrashkevich, E. Frishman, and M. Shapiro, J. Chem. Phys. 107, 6166 (1997); A. Vardi, V.A. Yurovsky, and J.R. Anglin, Phys. Rev. A 64, 063611 (2001).
- (10) P.S. Julienne, K. Burnett, Y.B. Band, and W.C. Stwalley, Phys. Rev. A 58, R797 (1998).
- (11) J. Javanainen and M. Mackie, Phys. Rev. A 58, R789 (1998); M. Mackie, A. Collin, and J. Javanainen, Phys. Rev. A 71, 017601 (2005).
- (12) J.J. Hope, M.K. Olsen, and L.I. Plimak, Phys. Rev. A 63, 043603 (2001).
- (13) P. D. Drummond, K.V. Kheruntsyan, D.J. Heinzen, and R.H. Wynar, Phys. Rev. A 65, 063619 (2002); P.D. Drummond, K.V. Kheruntsyan, D.J. Heinzen, and R.H. Wynar, Phys. Rev. A 71, 017602 (2005).
- (14) B. Damski et al., Phys. Rev. Lett. 90, 110401 (2003).
- (15) C. Lisdat, N. Vanhaecke, D. Comparat, and P. Pillet, Eur. Phys. J. D 21, 299 (2002).
- (16) U. Schlöder, T. Deuschle, C. Silber, and C. Zimmermann, Phys. Rev. A 68, 051403 (2003).
- (17) For details see G. Thalhammer et al., Phys. Rev. A 73, 033403 (2005).