Anharmonic vs. relaxational sound damping in glasses:
II. Vitreous silica
Abstract
The temperature dependence of the frequency dispersion in the sound velocity and damping of vitreous silica is reanalyzed. Thermally activated relaxation accounts for the sound attenuation observed above 10 K at sonic and ultrasonic frequencies. Its extrapolation to the hypersonic regime reveals that the anharmonic coupling to the thermal bath becomes important in Brillouin-scattering measurements. At 35 GHz and room temperature, the damping due to this anharmonicity is found to be nearly twice that produced by thermally activated relaxation. The analysis also reveals a sizeable velocity increase with temperature which is not related with sound dispersion. A possible explanation is that silica experiences a gradual structural change that already starts well below room temperature.
pacs:
63.50.+x, 78.40.Pg, 62.80.+f, 78.35.+cI Introduction
In the first paper of this series (I), the hypersonic attenuation of highly densified silica glass, -SiO2, was investigated. It was found that in that material the damping of hypersound is completely dominated by its anharmonic interaction with the thermally dominant modes. In the present paper we consider the corresponding situation in usual vitreous silica, -SiO2, for which a large quantity of high quality data is already available in the literature. In the early 1950’s, ultrasonic absorption peaks in function of the temperature were first observed in -SiO2. These were described by Anderson and Bömmel in terms of a phenomenological Maxwell model And55 . Following the discovery of the key role played by two-level systems (TLS) in producing the anomalous thermal properties of glasses And72 ; Phi72 , it became clear that these should also be invoked in the description of acoustic relaxation. A theory including both resonant and relaxational sound damping produced by tunneling was developed by Jäckle Jae72 . It was then extended to higher temperatures by including in the description the classical jumps over the energy barrier separating the wells of TLS Jae76 . The presently accepted model for thermally activated relaxation (TAR) includes a distribution of asymmetric double-well potentials, as discussed by Gilroy and Phillips Gil81 .
The simple extrapolation of this behavior to GHz frequencies, i.e. to the hypersonic regime, has sometimes been presented as an appropriate description of the observed phenomena, e.g. in Wie00 ; Wie01 or Sur04 . However, it has also been recognized that TAR might not always be sufficient to account for sound dispersion and damping. A specific example has been discussed in the case of vitreous germania, GeO2 Her98 . The results presented in (I) strongly suggest that -SiO2 should be an excellent candidate to search for a possible anharmonic contribution to the hypersonic attenuation.
The paper is organized as follows. In Section II the phenomenology of TAR is reviewed to formulate a description that can reasonably be extrapolated to sufficiently high- and to Brillouin-scattering frequencies. In Section III this formalism is applied to available high quality sonic and ultrasonic data on -SiO2, covering more than four orders of magnitude in the frequency . The model parameters that are thus extracted are then used in Section IV to estimate the TAR contributions to both velocity dispersion and damping at Brillouin-scattering frequencies. The anharmonic contribution can then be extracted from the total signal. It is analyzed in terms of a mean thermal mode relaxation time in Section V. Interestingly, this time is found to be about an order of magnitude longer than that of densified silica glass, -SiO2. Section VI presents a synthesis of the above analysis for the entire range of , from ultrasonic to Brillouin-scattering frequencies. A part of that analysis concerns the velocity changes with . We find an anomalous increase of the bare velocity with , nearly the same in -SiO2 and -SiO2. This unrelaxed velocity, , is obtained after subtraction of the velocity changes produced by both thermally activated relaxation and anharmonicity. The -dependence of suggests that silica experiences a progressive structural change with increasing . Section VII is a discussion, which mentions the crossovers between the various frequency regimes, considers the suitability of power laws for the description of the dependence of the damping on , and evoques possible extension to other glasses.
II The phenomenology of thermally activated relaxation
We consider an assembly of defects represented by double-well potentials that are separated by barriers of height and whose depths differ by the asymmetry . The energies and are randomly distributed according to a distribution to be discussed below. The system is thought to hop continuously between the wells. The energy difference between the wells is coupled to the strain of a sound wave of angular frequency by a deformation potential . Owing to the delayed energy exchanged in hopping, this produces the dissipation of the sound wave. This situation has been described in great details elsewhere Jae76 ; Gil81 ; Phi87 ; Tie92 . To an excellent approximation, it leads to a relaxational contribution to the internal friction given by
In this expression, is the material density, is the velocity of sound, and is in energy units. We remark that both and depend on the polarization of the acoustic wave, longitudinal (LA) or transverse (TA). In this writing, is restricted to positive values while the distribution is symmetric in . We also note that is a density, i.e. a number per unit volume. The associated velocity change, which follows from the Kramers-Kronig relation, is given by
In these equations, is the relaxation time for hopping within the double well. It is given by
where is the inverse of an attempt frequency, as shown in detail e.g. in Tie92 .
The key in applying these expressions is to use a reasonable distribution . For small and the distribution is often replaced by a constant . This is suggested by the -dependence of the specific heat at low which only probes low values of and Poh81 . Of course, a constant cannot be extended to high values of and as this leads to a diverging integral density of defects which is unphysical. A reasonable guess for can be obtained with the help of the soft-potential model (SPM) Kar83 . That model is characterized by a distribution of random dimensionless cubic and quadratic coefficients, and respectively, by an energy scale of the potential , and by a characteristic cross-over energy Kar83 . We are only interested here in the region with which gives double wells with barriers centered at the origin of the soft mode coordinate . As shown in Ili87 , owing to the latter choice, the variables and are not statistically independent. This leads to a sea-gull singularity in their distribution, , where is finite near the origin. For the range of values of interest here, one has and . The deformation potential of the SPM is also function of with as defined in Buc92 and further explained in Par94 . The terms of (1) are transformed into in the SPM. Using the Jacobian , one finds that Buc92 . This was already used by Keil et al. Kei93 who selected a distribution proportional to times a gaussian. These authors experimentally found that indeed is very near 1/4 in the case of silica.
For convenience, and for lack of different compelling indications, we assume that the distribution can be factored into
For , inspired by Buc92 and Kei93 , we use the normalized form
Since , this expression is integrable. The norm is selected so that integrates to 1. This gives
The function is the parabolic cylinder function Abr70 . As explained in the following Section, our independent analysis of a collection of data larger than that used in Kei93 also leads to very close to 1/4. This provides a solid support for this particular choice of . For we use a simple gaussian, rather similar to the gaussian cut-off of the linear asymmetry coefficient used by Gil et al. Gil93 . Indeed, , so that a gaussian in is very close to one in , the power of connecting the two variables being quite small. This functional form for was already employed succesfully by Bonnet Bon91 . It is written
where is defined by the normalization condition that the integral of equals . The norm is then dimensionless and given by
where we defined
being the cut-off value of the asymmetry. We finally remark that with the above definitions, the integral density of defects is
To complete the calculation, we now introduce (4) and (5) into (1), and use (2). In performing the integrals in (1), we make the same approximation as in Gil81 that sech() is replaced by 1 for and by zero otherwise. This eliminates the sech factors in (1) and (2) and simply replaces the limits of integration on by . It is convenient to define a dimensionless constant
One obtains
where is the error function,
For the purpose of comparison with literature results, it will be useful to relate the value of with the “tunneling strength” defined by in the usual tunneling model Phi87 ; Buc92 ; Poh02 . Given the distribution (4), one cannot strictly define , but this does not prevent defining in a consistent manner Buc92 . We calculate this for . We use and from Buc92 , where . Introducing these definitions into , and using (8), we find in the limit of small and ,
Information on the numerical handling of Eqs. (9) and our choice of suitable fitting parameters are found in Appendix A.
III Analysis of sonic and ultrasonic relaxational data
It is generally agreed that sonic or ultrasonic damping at temperatures above K is dominated by thermally activated relaxation. To obtain the model parameters , , and entering Eqs., it is necessary to analyze acoustic results over a sufficiently large range of frequencies , this up to high ultrasonic frequencies. It implies comparing data from various sources and generally acquired with different measurement techniques. TAR leads to a peak in as observed by Anderson and Bömmel in ultrasonic pulse-echo measurements And55 . These authors report precise data obtained on the TA-mode of vitreous silica at MHz. This is one of the curves that will be used for our analysis, as displayed in Fig.. Other high-frequency data were measured using the Bragg diffraction of light, Vac81 in a set-up similar to the original Debye-Sears experiment Deb32 . Damping results at MHz on both LA- and TA-modes have been obtained in that manner Vac81 . From these, and from results presented in Str64 , it is clear that LA- and TA-modes lead to identical peak shapes. This implies that similar distributions of defects are active in the damping of all acoustic waves, independently from their polarizations. We use the data on the LA-mode at 207 MHz from Vac81 , also shown in Fig.. The independence from polarization allows including in the evaluation sonic frequency results acquired on macroscopic vibrational modes, such as in vibrating reed measurements. We use the data at kHz of Classen, as reported in Tie92 . This curve is also displayed in Fig.. Results at intermediate frequencies were collected using composite oscillators, at 660 kHz on the LA-mode in Gil81 , and at 180 kHz on a torsional mode in Kei93 . As remarked in Kei93 , this particular method can easily lead to instrumental background-loss contributions. This might have been the case in Gil81 , as suggested from data on other glasses presented by the same authors in Gil80 which show long absorption tails at high . This notion is also supported by fits that are explained below. Hence, it is the 180 kHz data from Kei93 which is included in Fig.. With these four curves, the analysed data covers more than four decades in with a nearly linear progression in .
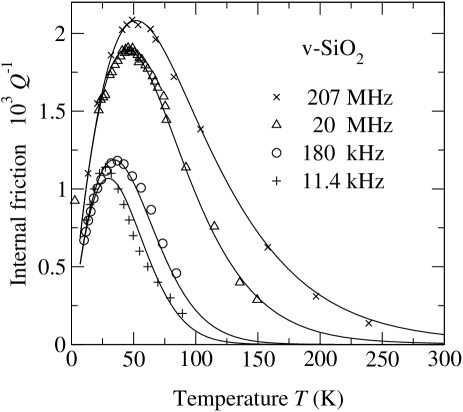
The curves shown in Fig. have been simultaneously adjusted to Eq., allowing for each measurement an independent coupling parameter . In the Marquardt-Levenberg routine used to this effect, the weights have been adjusted so that each curve had approximately the same weight, independently from the number of data points at each particular frequency. The excellent results of this fit, with fixed at 1/4, are illustrated by the solid lines in Fig.. The distribution parameters corresponding to these lines are K, with in seconds, and . If the same fit is repeated with free, one finds , and similar values for the other parameters: K, , and . This shows that the distribution suggested by the SPM is very adequate indeed. It also shows that can be fixed at 1/4, which will be done for the rest of this paper. The rather high value obtained for emphasizes that one should not neglect the cut-off in the asymmetry distribution. We return to this point below.
Our analysis reveals a certain difficulty in comparing the absolute size of the various curves. This can be related to some extent to the different polarizations of the waves in these measurements, or also to a small part to the different qualities of the silica samples employed. However, it seems more likely that it arises to a large part from calibration inaccuracies in some of these measurements. Indeed, discrepancies in the size of are directly observed in comparing literature reports, for example for the TA-waves at 20 MHz in And55 and Str64 . The difficulty is also seen in comparing the LA to TA values of in Vac81 and in Str64 . While in the former case it is the attenuations that have the same amplitudes for both LA and TA, in the latter it is the internal frictions which are practically the same for both polarizations. This cannot be reconciled as attenuation and friction differ by a factor proportional to the sound velocity, and the latter is m/s for LA and m/s for TA-waves at low . We also observed that the results at 660 kHz in Gil81 are fitted extremely well with the same model parameters, provided one allows for a relatively small constant background contribution to , equal to . The values of obtained for these various measurements range then from in the case of Gil81 to for And55 . These variations in do not seem correlated to either the measuring frequency or the wave polarization, which is another reason to suspect calibration difficulties.
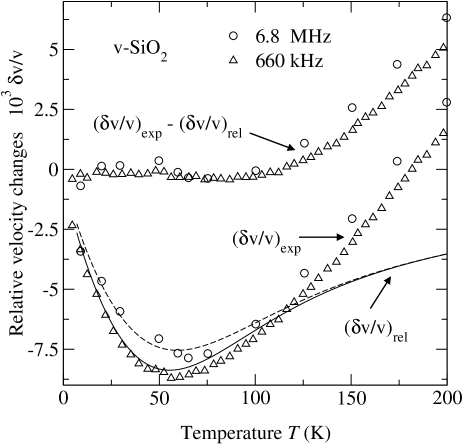
It is necessary to obtain a more reliable value of to analyze the Brillouin scattering data in the following Section. To this effect we remark that velocity measurements are generally both accurate and precise, allowing to follow small changes in with excellent accuracy. We use two measurements of the LA-wave velocity, one at 660 kHz from Gil81 and the other at 6.8 MHz from Vac81 . The experimental values are shown in Fig., together with continuous lines marked . These are calculated from the relaxation equation using the above values of , , and , together with . With the latter value, the dip around 50 K is completely accounted for. This is emphasized by the difference also shown in Fig.. Hence, we adopt for the following the coupling constant which happens to fall within the range of values obtained by fitting the various curves discussed above.
We now return to the small cut-off value K which we obtained. This aspect has mostly been ignored by other workers. It was shown in Bon91 that it is necessary to include a cut-off to obtain a good fit to the high- tails in Fig. 1. For example, forcing , the quality of the fits degrades appreciably above K, especially for the highest curve. More importantly, the calculated values of are then much too large to account properly for the dip around 60 K observed in Fig. 2. Obviously, by the virtue of the Kramers-Kronig transform, integrates over a large part of the distribution, which is the reason for this problem. One might wish to gain an intuitive picture of why can be so much smaller than . To this effect, one can consider the models of TAR drawn in Fig. 2 of Hun76 . We take as simplest examples model A, in which the two Si atoms of a SiOSi bond are too close, and model B, in which they are too far apart. In either case, a double well potential for the connecting oxygen results with a barrier height that comes mainly from the separation of the two Si. This barrier can thus be quite high. On the other hand, the asymmetry is produced by the difference in the wider environment of the two wells. In a hard glass, one might expect that these environments, which are dictated by the minimization of the energy, can be mostly quite similar. From these considerations, one intuitively anticipates that the ratio might depend significantly on the particular glass.
Finally, we remark that the temperature of the peak positions in Fig. depends linearly on ln. A similar observation was already made in Hun76 . This typical Arrhenius behavior supports TAR as the principal relaxation mechanism to describe Fig., as opposed for example to incoherent tunneling that would lead to as seen from Eq. (2.95) of Rau95 .
IV Analysis of Brillouin scattering results
High-resolution Brillouin scattering measurements of the temperature dependence of the LA-linewidth of vitreous silica have been reported in Vac76 and Tie92 . Both experiments were performed near backscattering and below room , using as exciting radiation the blue argon-laser line at nm. Measurements above room are reported in Pel76 . These were performed at nm. The Brillouin frequency shifts from Vac76 and Pel76 , the latter rescaled to nm, are displayed in Fig. over the entire range of .
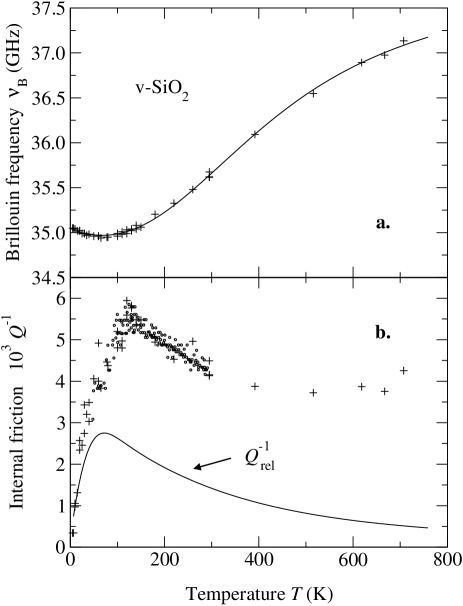
The frequency widths extracted from the Brillouin peaks in Vac76 and Pel76 , after correction for the instrumental broadening, have been converted to internal friction as shown in Fig.. The internal friction reported by Tielbürger et al. in Tie92 is also shown on the same figure. One notices the remarkable agreement between these two independent determinations. It emphasizes that Brillouin scattering gives an absolute measurement of , independent from calibrations, since it suffices to take the ratio of the Brillouin full-width to the Brillouin shift to extract . This statement of course assumes that the spectroscopy can be performed with the required resolution, and in particular that the broadening produced by the finite collection aperture can be made sufficiently small.
Also shown in Fig. is the curve calculated with Eq. for GHz and with the parameters determined in Section III. It is evident that at Brillouin frequencies TAR cannot account for the entire internal friction. The value is confirmed by the Brillouin velocity results explained below. However, even if one would allow oneself to arbitrarily double the coupling constant , the line in Fig. would still not superpose the data points. In particular the peak in occurs at a lower -value than the peak in the observed . The difference between the two curves is attributed to its largest part to the anharmonic coupling of the LA-waves with the thermally excited vibrational modes, as reported in (I) for densified silica glass.
The velocities are extracted from the Brillouin frequencies of Fig. using , where is the refractive index and is the internal scattering angle, here close to . To derive precise values on , it is necessary to know with an equal precision. This information has been derived from Wax71 . The results below 300 K are shown in Fig. 4, together with the velocities at 6.8 MHz from Vac81 .
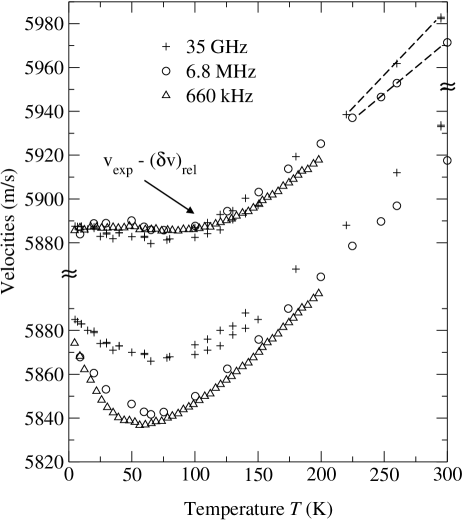
The relative changes reported in Gil81 have also been converted back to velocities using m/s. Subtracting from all three curves the calculated from Eq., one observes that below 150 K all the data collapse quite well. This confirms that the value of is also correct at Brillouin frequencies. It also emphasizes that the -dependence in the depth of the dip around 70 K is well predicted by TAR. As explained in Section VIB, the velocity changes that are produced by the anharmonicity, , show little dispersion compared to the large dispersion in . Hence, they do not modify the above conclusion.
Figure 5 shows the difference between the experimental internal friction and the calculated TAR contribution. Similarly to the results on -SiO2 in (I), there is a region where the signal falls rapidly with decreasing . However, it does not seem to fall to zero sufficiently fast. In spite of the large scatter in the experimental values, there is a hint for an additional contribution to at low , in the region from to K.
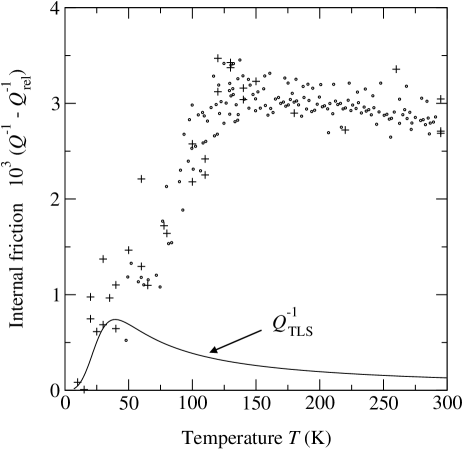
At these hypersonic frequencies and temperatures, one can anticipate a contribution arising from the relaxation of two-level systems (TLS) by incoherent tunneling. Generally, exhibits a plateau separating a regime at low from at higher , as shown in Rau95 where and are defined. The position, extent, and height of this plateau are -dependent, as emphasized in Fig. 6 of Top96 . According to Rau95 , the extent of the plateau should shrink to zero at sufficiently high frequencies such that , where is a frequency independent characteristic temperature marking the end of the plateau region. In -SiO2, it has been observed that K Tie92 . The plateau becomes then a hump slightly above . As shown in Top96 , for MHz one should have K. This value increases with , as confirmed from sound-damping data between 330 and 930 MHz Jon64 , showing a shoulder on the low side of the TAR peak. Hence, at 35 GHz one expects K, giving a broad TLS hump centered around 40 K. below this hump, and above it Rau95 . Extrapolating the observations reported in Top96 we posit
as a rough estimate for this relatively small contribution to . This curve, which peaks around 40 K, is shown in Fig. 5. The difference
will be used below to analyse the anharmonic damping. Since there seems to be a small tunneling contribution , then there ought to be by the Kramers-Kronig relation a corresponding contribution . As shown in Eq. (2.96) of Rau95 , this should produce at high- a frequency dependent term in . As shown in Appendix B, there are reasons to believe that it is this term that produces the difference in slopes indicated by short dashed lines in Fig. 4.
To conclude, we find a relatively large at hypersonic frequencies. It is of the same order of magnitude as . The small additional term that has been discussed above is a correction of minor importance compared to , as obvious from Fig. 5.
V The thermal relaxation time
In the spirit of (I) we now analyze the anharmonic damping with the expression
where is the mean lifetime of the thermal modes and is the prefactor given in Eq. of (I), with the specific heat per unit volume and the Debye velocity. We remark that all quantities entering are known, except for the mean-square average Grüneisen parameter . Thus we can directly plot the quantity as it is independent from . The result obtained using the values taken from Fig. 5 is drawn in Fig..
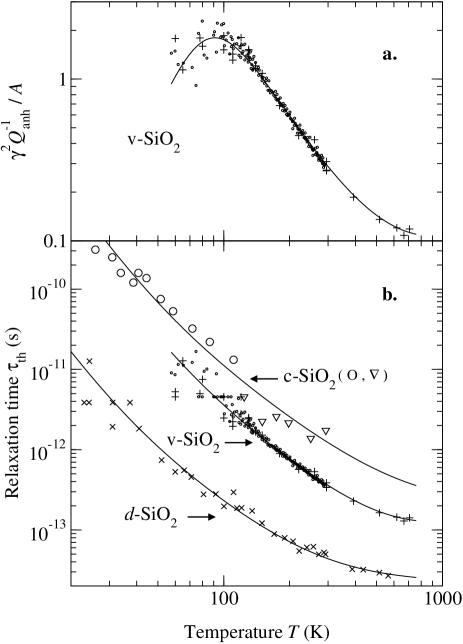
Points below 60 K are not shown as the data is too noisy at low to be significant after division by . This plot exhibits a peak for . From the height of this peak one reads . With this determination, Eq. (14) can then be solved for , and thus for . The procedure is explained in Appendix C. The result is shown in Fig.. One observes that is proportional to over the main part of the data, from K to K. At higher , tapers off, while at lower there is a hint that might diverge faster than in . The solid line is a guide to the eye which is a sum of powers of . The same law is then used to trace the guide to the eye in Fig..
In Fig. we have traced for comparison the values of the relaxation time of the thermal modes for two other cases. Firstly, we observe that obtained in (I) for densified silica glass, -SiO2, is substantially shorter than in -SiO2. However, it shows a very similar functional dependence on . Secondly, in order to deepen the understanding, we applied the same method of analysis to data on the LA-mode of X-cut crystal quartz, -SiO2. We used to this effect the attenuation coefficient measured by Bömmel and Dransfeld at 1 GHz Boe60 . At temperatures above 150 K, we completed these data using the width of the Brillouin line reported in Bon94 . These data were analyzed similarly to Fig. leading to . The corresponding is shown in Fig.. In this case, the line through these points is not a guide to the eye as for the two glasses, but it is an independent determination of using the well-known kinetic expression for the thermal conductivity,
We observe that in this case the value of derived from (line) is in remarkable agreement with that obtained from the measurement of anharmonic damping of the acoustic modes. This emphasizes the physical significance of : it really is the mean lifetime of the excitations in the thermal bath which at sufficiently high is entirelly controlled by Umklapp (U) processes. As pointed out in Zim60 , this produces a relaxation proportional to the phonon population, and thus at high one has . At intermediate , where and , Eq. (15) indicates that . This is indeed observed in -SiO2 over a large range of , as seen in Fig..
Equation (15) assumes propagating thermal phonons. For this reason, it becomes invalid in glasses at soon as increases beyond the thermal conductivity plateau located around 10 K in -SiO2. However, we remark that the functional dependence observed in the two glasses is very similar in shape to that in -SiO2. We have no simple explanation for this. In glasses, there are two competing effects that modify the picture presented above. On the one hand, the strict quasi-momentum conservation which is invoqued in U-processes is strongly relaxed, and this must greatly enhance the interactions in the thermal bath, decreasing . This could account for the observed difference between crystal and glasses. On the other hand, the thermal modes are not expected to be propagating plane-waves but they are at best diffusive. This restricts the spatial extent of the modes, greatly decreasing their overlap and thereby their interactions, which increases . We believe it is the latter effect which produces the much longer in -SiO2 compared to -SiO2. Indeed, in -SiO2 the boson peak is strongly reduced Ina99 . This increases the crossover frequency beyond which the acoustic excitations become diffusive, as recently confirmed by inelastic x-ray scattering Ruf03 . This in turn increases the mean spatial extent of the modes and thereby their interactions leading to a faster thermalization.
Finally, we remark that the above analysis gives values for the mean Grüneisen parameter . We find 0.95 for the LA-mode of x-cut quartz, 3.6 for -SiO2, and 8 for -SiO2. In the case of crystal quartz, the agreement between the line calculated from the thermal conductivity and that obtained from gives a solid support for the value of . Unfortunately, one cannot make a similar comparison for the glasses.
VI Summing-up
VI.1 The internal friction
Figure 7 summarizes the present analysis of the internal friction observed in -SiO2 with Brillouin scattering around 35 GHz. One identifies two main contributions: arising from thermally activated relaxation and which results from network viscosity. Around room , is nearly twice as large as . The incoherent tunneling contribution , if it really exists at these high frequency and temperatures, mainly produces the small hump around 40 K. Although there is a hint for such a feature in the data shown in Fig. 7, it would need to be confirmed by more precise measurements. Also, we neglected in this analysis a possible contribution arising from the quasi-harmonic oscillators of the soft-potential model Par94 . This is explained in Appendix D.
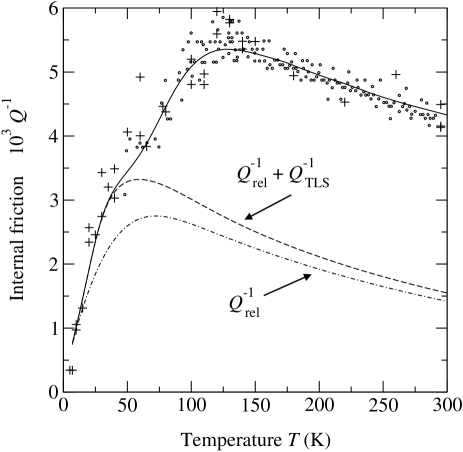
As is increased beyond 35 GHz, we find that the value calculated with Eq. (9a) saturates. This saturation essentially results from the cut-off in . For example at room , does not increase beyond 1.510-3. On the other hand, at sufficiently high , continues to grow with according to which applies as long as . We also find that is practically constant from 100 to 300 K. For these reasons, the total becomes dominated by network viscosity, it continues to increase proportionally to up to several hundred GHz, and it is nearly -independent from 100 K to 300 K. This is in excellent agreement with the results on acoustic propagation reported for -SiO2 thin films by Zhu, Maris, and Tauc Zhu91 . These authors find that the mean free path, , grows in from 30 GHz to 300 GHz, and that it is nearly independent of from 80 to 300 K. Since , the dominance of , its growth , and its near constancy in , fully account for the data reported in Zhu91 . Our predictions are also fully consistent with three data points measured with UV Brillouin scattering from 50 to 100 GHz Mas04 ; Ben05 .
On the other hand, at ultrasonic frequencies, i.e. much below 35 GHz, the contribution of which decreases proportionally to becomes completely negligible compared to . This justifies the analysis based only on TAR that was performed in relation with Fig. 1.
VI.2 The velocity changes
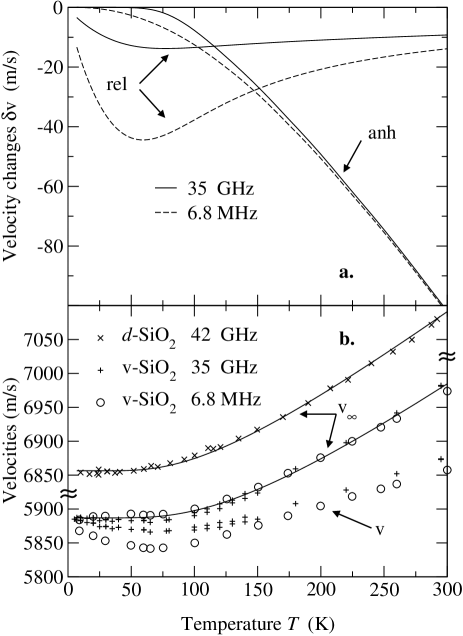
Figure shows the velocity changes calculated from Eq. for TAR, and using
for the network viscosity, this at two typical frequencies. One notices that the increase in from 6.8 MHz to 35 GHz leads to a large reduction of . On the other hand, , although quite large above 100 K, changes relatively little with . In particular, the dashed curve is entirely in the regime , so that it is practically independent of at lower -values. This justifies the approach used to determine in Fig. 2 where the anharmonicity contribution was simply neglected. At sufficiently high-, anharmonicity always leads to a quasi-linear decrease of with , very similar to what is observed in crystals Lan66 ; Gar75 . This has been seen in ultrasonic measurements in a large number of glasses, e.g. in Cla78 where this effect is interpreted as such. At these frequencies, one is in a regime where the velocity changes are dominated by network viscosity while the damping mainly originates from TAR. It is generally necessary to go up to Brillouin frequencies to observe in both contributions simultaneously.
The velocity changes in tetrahedrally coordinated glasses, in particular in -SiO2 and in -SiO2, are more complex than described above. Fig. shows the observed velocities, , and the unrelaxed value that is corrected for both TAR and network-viscosity dispersions, . As observed, the experimental points collapse to a which on this scale is essentially -independent. However, rather than being constant, increases considerably with . In the same figure, the results obtained in (I) for -SiO2 are shown for comparison. Both solid lines are guides to the eye obtained by an ad hoc adjustment to Wachtman’s equation And66 . The behaviour of is remarkably similar in both glasses, pointing to an anomalous hardening of silica with increasing . As discussed in (I), the earlier proposal that this is a manifestation of large structural inhomogeneities Kul74 is not supported by observations. The anomalous hardening has recently been attributed to a progressive local polyamorphic transition associated with abrupt rotations of randomly distributed Si-O-Si bonds, found in simulations Hua04a . Thermal agitation would redistribute the Si-O-Si bond angles in configurations where they are more resilient. However, contrary to Hua04b , our results indicate that a very similar mechanism would then be active in permanently densified silica. Repeating the warning made in (I), although has a clear physical significance, it would be nearly impossible to perform at the moment an experiment to directly measure it. This is even more so in -SiO2 than in -SiO2, owing to the lower of the former glass.
VI.3 The tunneling strength
It remains to compare the value found in Section III to the tunneling-strength parameter from the literature. To do this, both values are inserted in Eq. (11) to calculate the cut-off energy that applies to the present case. We find K, as opposed to the TLS value K derived from the low- specific heat data Buc92 . Such a larger value of was already reported, resulting from a similar analysis in Kei93 . Its origin was convincingly explained there as arising from a different weighing of the distribution of -values, in for the specific heat, and in for the ultrasonic absorption. The value of is thus fully in line with expectations.
VII Discussion
We have shown that ultrasonic and hypersonic damping and dispersion in vitreous silica at temperatures above the quantum regime originate in at least two main processes: thermally activated relaxation and network viscosity. These have different and dependences which leads to a non-trivial variation of the scattering linewidth with . At a given , TAR dominates the damping at low , while anharmonicity dominates at sufficiently high . Between these two regimes there occurs a “dynamical crossover” which for -SiO2 at room falls near our Brillouin frequency, as shown in Fig. 10 of Zhu91 and confirmed in Fig. 7 above. Above this crossover, the damping is dominated by , which implies that . As is increased far beyond optical Brillouin frequencies, another broadening mechanism eventually comes into play. Around 300 GHz, one expects the onset of a new contribution to , growing with a higher power of , possibly in , as suggested in Vac97 . This additional contribution is currently thought to result from the hybridization of the acoustic modes with boson-peak excitations Gur03 ; Ruf05 , as inelastic x-ray scattering observations on -SiO2 strongly suggest Ruf03 ; Cou03 . Unfortunately, inelastic x-ray scattering at sufficiently small scattering vectors and with sufficiently high energy resolution could not yet be performed on -SiO2 to settle the issue of this onset. This hybridization eventually leads to the Ioffe-Regel crossover at , above which the excitations have lost their plane-wave character. Then, the wave-vector does not remain a good label for the modes which are at best diffusive Fab96 . The excitations of the thermal bath are expected to be of that nature in glasses, as discussed in Section V.
Power laws , or which is equivalent as long as the frequency is well below the Ioffe-Regel limit so that , are often employed to represent the damping data . As just explained, is a reasonable approximation in the region between the dynamical crossover and the Ioffe-Regel one. On the opposite, such laws should be viewed as quite rough approximations in the TAR-dominated regime. The reason is that the dependence of on predicted by Eq. 9a is more complicated. It cannot be written simply in terms of a -dependent exponent . For example, in -SiO2 at room , a value is given in Sco03 , while is derived from Wie00 . We conclude that power laws in the TAR-dominated regime are ad hoc devices which only represent approximately the data, especially if the latter are sufficiently noisy to mask the disagreements.
At this point, it is legitimate to ask to what extent anharmonicity might be important to sound damping in other glasses. The answer to this question depends on two factors: i) the strength, density, and distribution of the relaxing defects; ii) the strength of the anharmonicity. It is conceivable that in glasses that contain a large quantity of defects up to high values of and , TAR would mask the anharmonicity. In that case the dynamical crossover might move up to nearly , so that a regime might not be observable at all. We have found such a case in lithium diborate, -Li2B4O7 Ruf05 . This type of situation is expected for most polymers in which the tunneling strength is quite large Poh02 . On the other hand, there exist many glasses or amorphous materials for which is quite small, well below Poh02 . Such are the amorphous group IV semiconductors, C, Si, and Ge. In that case, the anharmonicity is expected to dominate over a considerable range of and a calculation to that effect has already been performed Fab99 . Of the tetrahedrally coordinated glasses, it will be particularly interesting to reinvestigate -GeO2 and -BeF2. Difficulties met in obtaining a quantitative description of damping and dispersion in germania on the basis of TAR alone, described in Her98 , might find their resolution by including in the analysis the cut-off and the network-viscosity contribution.
To summarize, TAR essentially explains acoustic damping results in silica glass up to a few GHz. At higher frequencies, the anharmonic coupling of hypersound to the modes that form the entire thermal bath becomes progressively dominant. This conclusion, in line with previous observations Vac81 and simulations Fab99 , corrects statements to the contrary often found in the literature, e.g. in Wie00 ; Wie01 ; Sur04 . The anharmonicity which in our view produces is a coupling of sound to the whole bath, in addition to the relatively small fraction of modes forming the boson peak. This process, which we call network viscosity, is in a way quite similar to the usual lattice viscosity of crystals.
Appendix A Estimating Eqs. (9)
For the Marquardt-Levenberg adjustment of Eqs. (9), it is convenient to use the parameters , , log, , and . Taking as integration variable , and defining the auxiliary variables and , Eq. becomes
Good results are obtained with a simple trapezoidal integration, taking a geometric progression for the vector of -values. We used starting at and ending at , in steps of 1%. Eq. is handled similarly.
Appendix B Velocity changes due to incoherent tunneling
One observes on the upper curves of Fig. 4 that there is a small difference in the high temperature slopes for the two different frequencies. The origin of this effect might be in the velocity dispersion associated, by the Kramers-Kronig transform, with the relatively small damping produced by incoherent tunneling. At high , the damping is given by the third equation (2.94) of Rau95 ,
The corresponding is derived from the third equation (2.96) of Rau95 , which gives for the -dependent part
The temperature marks the end of the low- plateau region in and it is given by Eqs. (2.78) and (2.79) of Rau95 . Owing to the logarithmic dependence in (B2), it is the difference of slopes at two frequencies which is significant,
With the values in Fig. 4, and calculating following Rau95 , one finds
. As expected, this is smaller than the tunneling strength
found from specific heat measurements at low temperatures Poh02 , the reduction being of the order
of .
Hence, it is not unreasonable to assign the difference in slopes observed at high- in Fig. 4 to the Kramers-Kronig
transform of .
Appendix C Solving Eq. (14) for the relaxation time
It is in principle trivial to solve the quadratic equation for in terms
of the measured .
However, imaginary roots do occur in the region around owing to fluctuations
in the data leading to some points for which .
These are the points whose ordinate lies above the maximum of the solid curve drawn
in Fig..
For these data points, we simply replaced by 1, as the nearest real solution.
This produces a line of data points with in the presentation of Fig..
For the data points with , one must select between the upper and the lower root of the quadratic equation.
This is set by the location of the maximum in the solid curve, .
For , the upper root applies since , while
the lower root applies at higher temperatures.
Appendix D Another possible source of damping
We have not considered the damping
arising from the weak anharmonicity of the nearly harmonic oscillators (HO) of the soft
potential model in the domain Par94 .
This contribution should be most active at “intermediate” frequencies.
In -SiO2, its strength has actually been predicted to be largest near our Brillouin frequency Par94 .
It must be noted that the entire -domain covered by the propagating pulse
measurements of Zhu91 falls within this “intermediate” frequency range
where the additional damping obeys Par94 .
If the strength of would be sufficient, one should definitely notice its effect on the
-dependence of the mean free
path reported in Zhu91 from 80 to 300 K and from 30 to 300 GHz.
On the contrary, the mean free path is found practically -independent and it increases ,
in agreement with the network-viscosity contribution.
It seems thus justified to neglect in our analysis of the Brillouin results up to 300 K.
The difficulty in estimating the size of apparently lies in finding
the proper value for the tunneling-strength parameter that applies to it.
The value 3.010-4, appropriate for TLS at very low temperatures Poh02 , is certainly too large here.
Indeed, using this value in Eq. (3.18) of Par94 , we calculate 510(K),
which at 300 K is larger than the entire observed.
¿From an analysis of heat-release measurements there are grounds to adopt here a value of which is
at least five times smaller Par93 .
Even so, the resulting is still too large to agree with the results of Zhu91 .
Our Brillouin measurements up to 700 K shown in Fig. suggest that there could be a small contribution
that starts being felt above K.
This contribution would then be of the order of (K), which implies a very small effective
for this particular damping mechanism.
References
- (1) O.L. Anderson and H.E. Bömmel, J. Am. Ceram. Soc. 38, 125 (1955).
- (2) P.W. Anderson, B.I. Halperin, and C.M. Varma, Phil. Mag. 25, 1 (1972).
- (3) W.A. Phillips, J. Low Temp. Phys. 7, 351 (1972).
- (4) J. Jäckle, Z. Physik 257, 212 (1972).
- (5) J. Jäckle, L. Piché, W. Arnold, and S. Hunklinger, J. Non-Cryst. Solids 20, 365 (1976).
- (6) K.S. Gilroy and W.A. Phillips, Phil. Mag. 43, 735 (1981).
- (7) J. Wiedersich, S.V. Adichtchev, and E. Rössler, Phys. Rev. Lett. 84, 2718 (2000).
- (8) J. Wiedersich, N.V. Surotsev, V.N. Novikov, E. Rössler, and A.P. Sokolov, Phys. Rev. B 64, 064207 (2001).
- (9) N.V. Surotsev, V.K. Malinovsky, Yu.N. Pal’yanov, A.A Kalinin, and A.P. Shebanin, J. Phys.: Condens. Matter 16, 3035 (2004).
- (10) J. Hertling, S. Baeßler, S. Rau, G. Kasper, and S. Hunklinger, J. Non-Cryst. Solids 226, 129 (1998).
- (11) W.A. Phillips, Rep. Prog. Phys. 50, 1657 (1987).
- (12) D. Tielbürger, R. Merz, R. Ehrenfels, and S. Hunklinger, Phys. Rev. B 45, 2750 (1992).
- (13) R.O. Pohl, in Amorphous Solids: Low-Temperature Properties, W.A. Phillips Ed. (Springer, Berlin, 1981) pp. 27-52.
- (14) V.G. Karpov, M.I. Klinger, and F.N. Ignat’ev, Sov. Phys. JETP 57, 439 (1983).
- (15) M.A. Il’in, V.G. Karpov, and D.A. Parshin, Sov. Phys. JETP 65, 165 (1987).
- (16) U. Buchenau, Yu.M. Galperin, V.L. Gurevich, D.A. Parshin, M.A. Ramos, and H.R. Schober, Phys. Rev. B 46, 2798 (1992).
- (17) D.A. Parshin, Phys. Solid State 36, 991 (1994).
- (18) R. Keil, G. Kasper, and S. Hunklinger, J. Non-Cryst. Solids 164-166, 1183 (1993).
- (19) M. Abramowitz and I.A. Stegun, Handbook of Mathematical Functions (Dover, New York, 7th Printing 1970), Ch. 19, particularly p. 687.
- (20) L. Gil, M.A. Ramos, A. Bringer, and U. Buchenau, Phys. Rev. Lett. 70, 182 (1993).
- (21) J.P. Bonnet, J. Non-Cryst. Solids 127, 227 (1991).
- (22) R.O. Pohl, Xiao Liu, and EJ. Thompson, Rev. Mod. Phys. 74, 991 (2002).
- (23) R. Vacher, J. Pelous, F. Plicque, and A. Zarembowitch, J. Non-Cryst. Solids 45, 397 (1981).
- (24) P. Debye and F.W. Sears, Proc. Natl. Acad. Sci. USA, 18, 409 (1932).
- (25) R.E. Strakna and H.T. Savage, J. Appl. Phys. 35, 1445 (1964).
- (26) K.S. Gilroy and W.A. Phillips, J. Non-Cryst. Solids 35&36, 1135 (1980).
- (27) S. Hunklinger and W. Arnold, in Physical Acoustics, Vol. XII, edited by W.P. Mason and R.N. Thurston (Academic Press, New York, 1976), pp. 155-215.
- (28) S. Rau, C. Enss, S. Hunklinger, P. Neu, and A. Würger, Phys. Rev. B 52, 7179 (1995).
- (29) R. Vacher and J. Pelous, Phys. Rev. B 14, 823 (1976).
- (30) J. Pelous and R. Vacher, Solid State Commun. 18, 657 (1976).
- (31) R.M. Waxler and G.W. Cleek, J. Res. Nat. Bur. Stand. (U.S.) 75A, 279 (1971).
- (32) K.A. Topp and D.G. Cahill, Z. Phys. B 101, 235 (1996).
- (33) C.K. Jones, P.G. Klemens, and J.A. Rayne, Phys. Lett. 8, 31 (1964)
- (34) H.E. Bömmel and K. Dransfeld, Phys. Rev. 117, 1245 (1960).
- (35) J.P. Bonnet, M. Boissier, and A. Ait Gherbi, J. Non-Cryst. Solids 167, 199 (1994).
- (36) J.M. Ziman Electrons and Phonons Oxford Clarendon Press 1960
- (37) Y. Inamura, M. Arai, O. Yamamuro, A. Inaba, N. Kitamura, T. Otomo, T. Matsuo, S.M. Bennington, and A.C. Hannon, Physica B 263 & 264, 299 (1999).
- (38) B. Rufflé, M. Foret, E. Courtens, R. Vacher, and G. Monaco, Phys. Rev. Lett. 90, 095502 (2003).
- (39) T.C. Zhu, H.J. Maris, and J. Tauc, Phys. Rev. B 44, 4281 (1991).
- (40) C. Masciovecchio, A. Gessini, S. Di Fonzo, L. Comez, S.C. Santucci, and D. Fioretto, Phys. Rev. Lett. 92, 247401 (2004).
- (41) P. Benassi, S. Caponi, R. Eramo, A. Fontana, A. Giugni, M. Nardone, M. Sampoli, and G. Viliani, Phys. Rev. Lett. 71, 172201 (2005).
- (42) Landolt-Börnstein, New Series, Group III, Vol. 1 (Springer-Verlag, Berlin, 1966).
- (43) J.A. Garber and A.V. Granato, Phys. Rev. B 11, 3990 (1975).
- (44) T.N. Claytor and R.J. Sladek, Phys. Rev. B 18, 5842 (1978).
- (45) O.L. Anderson, Phys. Rev. 144, 553 (1966).
- (46) M.N. Kul’bitskaya, S.V. Nemilov, and V.A. Shutilov, Sov. Phys. Solid State, 16, 2319 (1974).
- (47) Liping Huang and J. Kieffer, Phys. Rev. B 69, 224203 (2004).
- (48) Liping Huang and J. Kieffer, Phys. Rev. B 69, 224204 (2004).
- (49) R. Vacher, J. Pelous, and E. Courtens, Phys. Rev. B 56, R481 (1997).
- (50) V.L. Gurevich, D.A. Parshin, and H.R. Schober, Phys. Rev. B 67, 094203 (2003).
- (51) B. Rufflé, G. Guimbretière, E. Courtens, R. Vacher, and G. Monaco, submitted (arXiv:cond-mat/0506287, 01 Sep 2005).
- (52) E. Courtens, M. Foret, B. Hehlen, B. Rufflé, and R. Vacher, J. Phys.: Condens. Matter 15, S1279 (2003).
- (53) J. Fabian and P.B. Allen, Phys. Rev. Lett. 77, 3839 (1996).
- (54) T. Scopigno, S.N. Yannopoulos, D.Th. Kastrissios, G. Monaco, E. Pontecorvo, G. Ruocco, and F. Sette, J. Chem. Phys. 118, 311 (2003).
- (55) J. Fabian and P.B. Allen, Phys. Rev. Lett. 79, 1885 (1999).
- (56) D.A. Parshin and S. Sahling, Phys. Rev. B 47, 5677 (1993).