Present address: ]Laboratoire de Spectrométrie Physique, Université Joseph Fourier, F-38402 Saint Martin d’Hères, France.
Anharmonic vs. relaxational sound damping in glasses:
I. Brillouin scattering from densified silica
Abstract
This series discusses the origin of sound damping and dispersion in glasses. In particular, we address the relative importance of anharmonicity versus thermally activated relaxation. In this first article, Brillouin-scattering measurements of permanently densified silica glass are presented. It is found that in this case the results are compatible with a model in which damping and dispersion are only produced by the anharmonic coupling of the sound waves with thermally excited modes. The thermal relaxation time and the unrelaxed velocity are estimated.
pacs:
78.40.Pg, 63.50.+x, 78.35.+cI Introduction
The understanding of the physical processes leading to sound attenuation and dispersion in dielectric glasses is still far from perfect. At least four distinct causes have been discussed: two-level systems And72 ; Phi72 ; Jae72 ; Phi81 , relaxation And55 ; Hun76 ; Par94 , Rayleigh scattering Ray96 ; Kle51 ; Ell92 , and anharmonicity. Anharmonicity produces a direct interaction of sound with thermal vibrations. One knows that for dielectric crystals it is a dominant contribution to the damping of acoustic waves Mar71 . This has been called either “lattice viscosity” Vau67 or “phonon viscosity” Mar69 . In Akhiezer’s treatment Akh39 ; Pom41 , the sound wave modulates the frequencies of the thermally excited modes and thereby their effective temperatures. The return to thermal equilibrium within this vibrational bath, characterized by the mean thermal lifetime of the dominant vibrations , leads then to energy dissipation and thereby to sound damping. This process can be quite local, occuring between spatially overlapping but not necessarily propagating modes Boe60 . The time just describes the return to equilibrium after a perturbation of these vibrations by an acoustic wave. Described in these terms, the Akhiezer mechanism also ought to be active in glasses, even though the thermal modes might then be local or diffusive ones, leading to what we shall call “network viscosity”. One of us had already suggested long ago that at the high frequencies of Brillouin scattering experiments, this Akhiezer contribution should not be neglected in vitreous silica Vac81 . A simulation based on this mechanism was performed for the case of amorphous silicon Fab99 . It showed that the anharmonicity of thermal vibrations can induce in glasses sound attenuation larger than in the corresponding crystal owing to the enhancement of the Grüneisen parameters by internal strains. Other detailed calculations of the anharmonic damping of sound in glasses do not seem available in the literature, except for extensive predictions of relaxation times based on the fracton model Ale86 .
At temperatures above the quantum regime, owing to the considerable disorder of glasses, damping can also result from unstable structural features relaxing in the strain field of the sound wave And55 ; Hun76 . These “defects” produce what is called “thermally activated relaxation”. The damping depends then on the defect density, on the strength of their coupling to strain, and on the distribution of their relaxation times . These times are often much longer than typical values of . Hence, this type of damping appears dominant in many glasses at sonic and ultrasonic frequencies. It produces peaks in the temperature dependence of the sound attenuation which have been well described by phenomenology Hun76 , although the exact nature of the defects remains most often unknown. A puzzling aspect is the relative “universality” of these relaxation phenomena, as reviewed in Poh02 . Another non-trivial aspect is that within the soft-potential model the relaxational features at higher temperatures and the properties associated with two-level systems, at He temperatures and below, can be quite succesfully described using a single picture Par94 .
Another possible damping mechanism is scattering of the sound waves by static density or elastic constant fluctuations. This effect which grows with the fourth power of the frequency was described long ago by Lord Rayleigh Ray96 . Although this mechanism has been invoked to explain the plateau in the thermal conductivity of glasses, or the “end” of acoustic branches Car61 ; Gra86 ; Ell92 ; Rat99 , it has been known for quite some time that it is difficult to construct a model for glasses that produces strong Rayleigh scattering Zai75 . It has been recently reemphasized that the Rayleigh scattering of sound is generally too weak for it to play any appreciable role at frequencies below at least 1 THz Par01 ; Gur03 . Thus, this will not be of importance to the present series of papers as our considerations will be restricted to frequencies below GHz. Similarly, another very strong damping mechanism is the resonant interaction –or hybridization– of the sound with other low frequency modes, which can lead to “boson peaks” Kar85 ; Kli01 . In the case of densified silica, this effect has been observed to start around 1 THz and to grow then with a high power of the sound frequency Ruf03 ; Cou03 . Again, this will not be of relevance here. Our interest will in fact mainly be in the relative strength of the anharmonic and relaxation sources of damping. At very low temperatures, below liquid He, the quantum aspect of two-level systems becomes crucial Jae72 ; Vac80 but anharmonic damping tends to zero owing to the weak population of the thermal bath. Very low temperatures will not be discussed here.
Compared to the very abundant ultrasonic results there exist relatively few damping data at frequencies between 1 GHz and 1 THz. The “hypersonic” regime observed with optical Brillouin scattering falls in the middle of this range. The longitudinal acoustic (LA) waves are active in the backscattering geometry. To fix ideas, in the case of silica and using the green argon-laser line, the observed hypersonic frequency is then GHz. Explanations that are only based on thermally activated relaxations generally meet difficulties in trying to account simultaneously for hypersonic and ultrasonic attenuation results, e.g. in Her98 . However, it was recently claimed that for silica, “within a factor of two”, the results over the entire frequency range are well accounted for by relaxation only Wie00 . A main purpose of the present series is to clarify this issue. This becomes all the more important that data are now also obtained at frequencies above GHz, using x-ray Brillouin scattering Ruo01 ,Ruf03 . In that context, one should beware of sweeping interpolations of the damping behavior over great many decades in frequency Ruo01 . As explained in the second paper of this series (II), the damping contribution of anharmonicity in the hypersonic regime increases faster in than that of relaxations. At sufficiently high frequencies and temperatures , this can lead, over certain frequency and temperature ranges, to a dominance of anharmonicity. Indeed, the thermal phonon contribution increases with the thermal population and thus with some power of , whereas the effect of the relaxing defects usually saturates.
In order to estimate the anharmonic contribution to sound dispersion and damping, it is of interest to consider several varieties of silica glasses besides usual vitreous silica, -SiO2. For example, it is already known that irradiation of -SiO2 by fast neutrons increases slightly the glass density , from 2.20 to g/cm3 Luk55 , but thereby increases appreciably the hypersonic velocity while it reduces substantially the hypersonic attenuation Bon94 . Similarly, it has already been shown that in permanently densified silica glass both the relaxation at sonic frequencies Wei96 and the hypersonic linewidth Doe94 are very strongly reduced. The latter experiments were performed on a sample of mean density g/cm3 which unfortunately was quite inhomogeneous. It is thus of considerable interest to obtain detailed -dependent Brillouin data on a much better sample of well densified silica, -SiO2, with g/cm3. The results of such an experiment are presented and discussed in this first paper. They confirm that the hypersonic damping in -SiO2 is indeed entirely dominated by anharmonicity. This is of particular interest as it reveals for the first time what the shape and strength of a pure anharmonic contribution can be in a glass.
Two quantities will be of main interest in these papers, the damping of sound and its velocity dispersion. Damping can be expressed in several ways. It is manifested in a Brillouin scattering measurement by a linewidth , where is defined as the deconvoluted frequency half-width at half-maximum of a damped harmonic oscillator response adjusted to the Brillouin peak. On the other hand, in ultrasonics the damping is generally measured as an energy mean-free path , or as its inverse , where is the sound velocity and is in rad/s. Traditionally, the attenuation constant is often expressed in dB/cm, in which case its numerical value must be multiplied by to convert it to m-1. To compare these various results over a broad range of frequencies, we prefer to use the internal friction which is the inverse of the quality factor . Thus, . This is particularly convenient for graphical presentation as near a relaxation peak depends little on , this over many decades of . The dispersion in is usually quite weak, and thus it is indicated to present a differential quantity, . In defining this quantity a suitable reference value must be selected, as really means . A rather common choice is to take for the value of at the lowest measured temperature, usually near liquid-He temperatures. One should be aware that an arbitrary choice of modifies practically by an additive constant, since . Further, if is small compared to 1, which is always true here, one easily shows that and are Kramers-Kronig transforms of each other,
with the related relation for the inverse transform. As explained in LL , this strictly requires that , where is the high-frequency limit of , which can be called the unrelaxed velocity. It is conceivable that “static” structural changes might occur in function of , and that these could produce a temperature dependent .
As discussed in Jae76 , if is given by a single Debye relaxation,
where and are independent of frequency but might depend on , it follows from (1) that
Finally, concerning the various independent contributions to , and thus to , we shall adopt the equivalent of “Matthiessen’s rule” Kit76 that these are simply additive. Thus, if is produced by relaxation and by anharmonicity, the total will simply be . It should also be noted that the right-hand side of (1) only describes velocity changes associated with frequency dependent damping, while “static” velocity changes might result from -dependent structural effects.
The paper is organized as follows. In Section II, the experimental aspects are described, including the spectrometer and the characterization of the sample. In Section III, the new Brillouin scattering data obtained on a well densified sample of -SiO2 are presented. These are then analyzed in Section IV. A discussion concludes the paper in Section V.
II Experimental aspects
The experiments reported here are particularly demanding both in terms of sample quality and spectrometer resolution. The Brillouin frequency shift produced by light scattering from an acoustic wave of velocity in an isotropic medium is given by
where is the refractive index of the sample, the vacuum wavelength of the exciting laser, and the scattering angle. The scattered light must be collected over a finite aperture . Hence, if one is interested in small linewidths – which is eminently the case here – the broadening produced by , proportional to cos, must be minimized by working with the smallest acceptable and near backscattering, i.e. for . In isotropic media the transverse acoustic modes are not active in backscattering. This is why the measurements are restricted here to the LA-mode.
Densification has an enormous effect on which at room changes from m/s for -SiO2 to m/s for -SiO2 with g/cm3. Thus, near backscattering and at Å, changes from GHz in -SiO2 to GHz in -SiO2. On the other hand, densification also reduces considerably the sound attenuation and hence the half-width of the Brillouin line. In -SiO2 at room a half-width MHz is observed Vac81 , whereas it falls below 20 MHz in -SiO2. Note that would equal – the quantity of main interest here – in absence of parasitic sources of broadening. In fact, these narrow linewidths can only be measured on samples that are very homogeneous in their density. It is easily estimated from the above figures that an inhomogeneity within the scattering volume of only 1% in density would lead to a broadening of the Brillouin signal by about 400 MHz. This value would be totally unacceptable when the instrinsic width of interest is only a few MHz. Furthermore, such small linewidths are usually not measurable in commercial Brillouin instruments. The Brillouin spectrometer used in these measurements is briefly described in Subsection II A.
Permanently densified silica, -SiO2, is obtained by submitting -SiO2 to high pressure at elevated Bri53 . Our series of samples was prepared from short cylinders of silica that were submitted to GPa of quasi-hydrostatic pressure at ∘C. Different densities were achieved by varying the duration of the treatment. We used samples with initial values of 2.31, 2.46, and 2.63 g/cm3, besides -SiO2 with g/cm3. A typical raw sample had a diameter of 4 mm and a length of 8 mm. Although the samples are often cracked, those at the highest densities can be clear and transparent. Their surfaces are smooth but not flat. Thus, to perform Brillouin scattering at room , the samples can be placed in an index matching fluid. This is not feasible at either cryogenic or elevated temperatures. Hence, a selected sample of the highest density had to be cut and polished with flat faces. It was then carefully characterized to identify a suitable region to perform these experiments. This is described in Subsection II B.
II.1 High resolution spectrometer
Three main criteria are to be satisfied by a spectrometer suitable for these Brillouin measurements: contrast, resolution, and accuracy. A very high contrast between the Stokes shifted frequency and the exciting laser frequency can be achieved by multiple passes through a planar Fabry Perot (PFP) interferometer San71 . However, the resolution of such a PFP is insufficient to measure . It is thus placed in series with a spherical Fabry Perot (SFP) which is the scanned instrument. The high accuracy on is achieved by producing a frequency adjustable reference signal with an electro-optic modulator working near . In practice, this reference is also used to dynamically adjust the PFP which works as a filter only transmiting the Stokes Brillouin line.
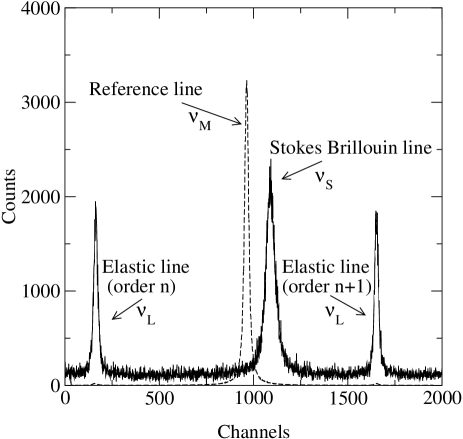
We used a modern version of the instrument described in Vac80b . The PFP has a spacing of 2 mm and it is used in four passes. The SFP has a free spectral range of 1.5 GHz and a finesse of . A typical spectrum obtained in scanning just the SFP is illustrated in Fig. 1. One recognizes two orders of the elastic line at , the Stokes Brillouin signal at , and the modulation signal at . All these lines are at a rather high interference order. A very high accuracy on is obtained as only the fractional order separating it from needs to be determined, while itself is known to the extremely high accuracy of the frequency generator. This provides for a determination of to better than 2 MHz absolute accuracy provided the Brillouin signal is appropriately intense and symmetric. The instrumental half-width of this SFP is MHz. Using photocounting and numerical deconvolution the half-width of a sufficiently intense damped harmonic oscillator (DHO) Brillouin line can then be determined with to 3 MHz precision.
II.2 Sample characterization
The mean densities of the various samples were carefully determined by the flotation method. Their refractive index at the sodium D lines ( Å) was measured with an Abbe refractometer. This gave results in good agreement with a previous determination Arn88 . The corresponding indices for Å were extrapolated. Their values vary linearly with and are given by
to accuracy.
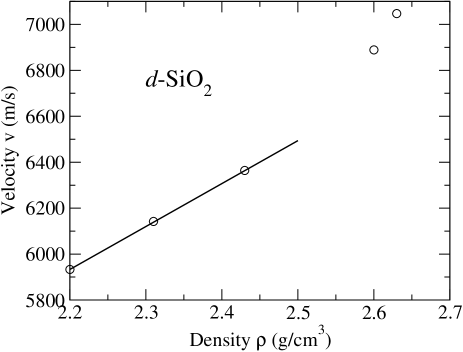
Figure 2 shows the hypersonic velocities measured at room temperature on the four original densities, plus one at an additional density of 2.60 g/cm3 (see below). The samples of intermediate densities (2.31 and 2.46) were much cracked internally, which produced a spread of velocities that translated into broader and distorted Brillouin lines. This did not prevent a sufficiently accurate determination of a mean velocity, with a m/s error bar which is still small on the scale of Fig. 2. The important point is that is a strong function of . One finds in m/s per g/cm3, at small densifications. As seen in Fig. 2, this slope steepens towards higher densities.
Brillouin scattering is a rather local probe. In the backward geometry used here, different small areas of a sample cross-section can be probed. The measurement of is then a test for the sample homogeneity. This revealed that one of the samples of highest density was rather homogeneous, with ranging from 42.32 to 42.35 GHz across its section. This piece was then selected for cutting and polishing, to obtain flat faces in order to be able to perform the Brillouin measurements in function of . Unfortunately, this mechanical process introduced an appreciable distribution of frequencies, to such an extent that the Brillouin lines became quite asymmetric. This sample was then used for Brillouin scattering with x-rays in Rat99 , and subsequently in For02 and Ruf03 . It should be remarked that these inhomogeneities do not appreciably affect the x-ray Brillouin scattering results. The latter experiments are indeed performed with four orders of magnitude less frequency resolution than here, the error bars on being then at best GHz Ruf03 . During the x-ray measurements the sample was maintained at an elevated temperature for a long time in order to increase the signal by the thermal population of the acoustic mode. We used K Rat99 , a temperature which is too low to appreciably relax the densification over the long duration of the x-ray experiment. Checking the optical Brillouin spectrum after the first x-ray experiment we discovered that the sample had become locally much more homogeneous, presumably owing to the thermal treatment. Nice symmetric and narrow Brillouin lines were then observed. At room , one end of the sample had a velocity indicating g/cm3, while near the opposite end we found . The corresponding difference in is of the order of 1 GHz. The former region had a linewidth MHz, while the latter had MHz. These two regions were separated by a less homogeneous one, with asymmetric Brillouin lines and a higher width. For the measurements presented in Section III, the region of density 2.60 and with the narrower line was selected. It should be remembered that part of the observed broadening can easily arise from small remaining inhomogeneities.
III Brillouin scattering results
Figure 3 presents the Brillouin results obtained on the sample region with as explained in Subsection II B. For the low- measurements, the sample was placed in a He-flow optical cryostat. The temperature of the gas flow is stabilized to much better than 1 K, and the sample temperature is read with a silicon diode. For the high- measurements, the sample was mounted in an optical oven stabilized to K. The value of , the scattering angle internal to the sample, was taken at for these measurements in order to minimize the collection angle broadening. The measured spectra were fitted to a DHO response function of frequency and half-width , convoluted with the experimental instrumental function.
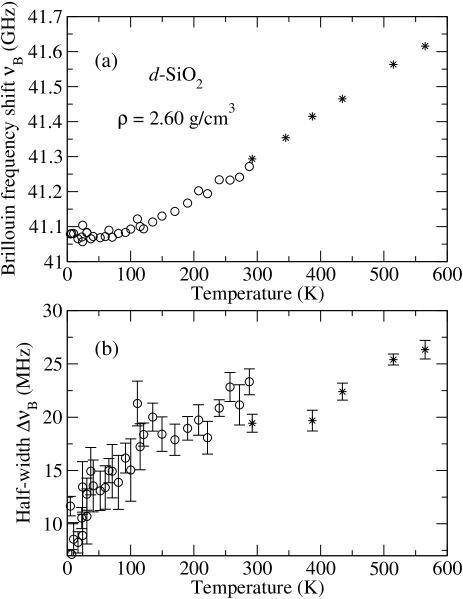
The values are shown in Fig. 3a. The error bars on these values are of the order of the size of the points. The values are shown in Fig. 3b with error bars that are given by the Marquardt-Levenberg least-square fitting algorithm. Care was taken to keep the laser beam on the same sample spot during the several days needed for measurements. It was however not possible to recover exactly the same position on the sample after its transfer from the cryostat to the oven. If residual inhomogeneous broadening is present – as we suspect – its amount is likely to vary from place to place. This could explain the difference – beyond the size of the error bars – between the level of observed in the cryostat and that in the oven.
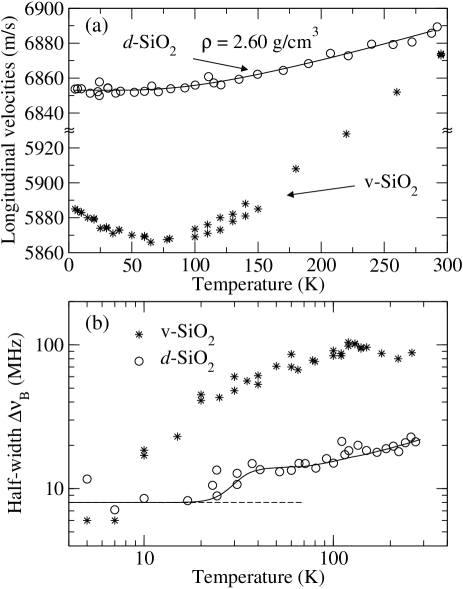
It is now of interest to briefly compare the results obtained on -SiO2 to these in -SiO2. Fig. 4 illustrates data obtained long ago on -SiO2 Sil81 . The velocities below room- are compared in Fig. 4a. The values of for -SiO2 are derived from the data shown in Fig. 3a using Eq. (3). As is raised from liq. He temperatures, one clearly observes a dip of in -SiO2. Within the accuracy of our experiment, such a dip is totally absent in -SiO2. It is well known that the dip is produced by the -dependence of thermally activated relaxational motions. This will further be discussed in paper (II). Its absence in -SiO2 demonstrates that thermally activated relaxation becomes negligible after densification. A strong decrease of these relaxations compared to -SiO2 has already been reported for the less densified sample of -SiO2 that was examined with both Brillouin scattering Doe94 and vibrating reed Wei96 measurements. In that sample there remained a clear dip in , but the relaxation peak observed with vibrating reed had decreased by a factor of about six compared to -SiO2. We conclude that in our case, the dip in being absent, the relaxation contribution to the damping must be totally negligible.
Fig. 4b shows the corresponding half-widths. A logarithmic scale is used here to emphasize the low- region and also because the damping in -SiO2 is quite a bit larger than in -SiO2. As discussed in paper (II), the -SiO2 values result from a combination of relaxation and anharmonicity. Below 10 K, they fall however below the values observed in -SiO2, which would be surprising were it not for the inhomogeneity of the -SiO2 sample dicussed above. Hence, we attribute the level of 8 MHz, illustrated by the dashed line, to the residual inhomogeneous background. The corresponding level for the data measured in the oven is estimated to be about half of that, i.e. MHz.
IV Network viscosity
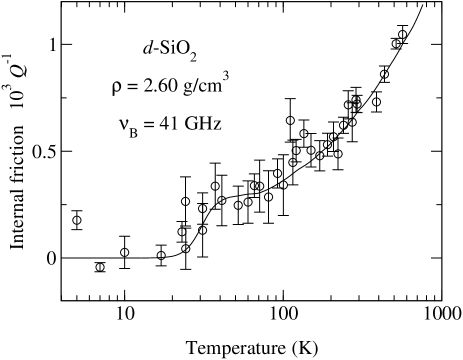
The data shown in Fig. 3b, corrected for the estimated inhomogeneous background, is used to calculate the internal friction shown in Fig. 5.
As explained above, this result should be interpreted in terms of the produced by anharmonicity. The theory of lattice viscosity was developed for crystals, in which case the calculation of correlation functions Vau67b or the sums over modes Mar71 ; Woo61 could be carried out quite far. For glasses, only the fracton model has been pursued to the point of making analytic predictions for the acoustic linewidth Ale86 ; Jag89 . However, the development described in Mar71 , in particular the one leading to Eq. (131) of that review, is essentially based on the standard equations of viscoelasticity supplemented by a simplifying assumption regarding the details of the collision term in the Boltzmann equation. A fully parallel reasoning can be made for glasses. Hence, for , similarly to the phonon viscosity term of Mar69 , we posit that network viscosity in glasses leads to the internal friction
with
Here is the specific heat per unit volume, is the velocity of the sound wave, is the Debye velocity, and is a mean squared average Grüneisen parameter for the thermally excited modes Mar71 ; Fab99 . We neglect the thermal conduction term in Eq. (131) of Mar71 . Experience shows that the latter is already considerably smaller than the phonon-viscosity one in crystals Bon83 . This should be even more so in glasses owing to the much reduced thermal conduction Fab99 . The strongest assumption in (5) is presumably the use of a single relaxation time . A second assumption is to take constant.
As the temperature is lowered, one expects that increases, so that the condition eventually becomes violated. We use the Ansatz that is then given by (2a), where and is given by (5b),
As pointed out in Vau67b , this amounts to introducing an exponential decay in the time-dependent relaxation function. This is preferable to the expression (4.15) proposed in Woo61 , as the latter does not have a finite Kramers-Kronig transform.
It is now of interest to estimate from the data shown in Fig. 5. This is done using (6), in which all quantities are quite well known except for the value of that enters according to . The other non-trivial quantities in are: 1) the specific heat for which we use the data from Ina99 , complemented at high- with the specific heat of -SiO2 appropriately scaled to account for the higher density of -SiO2; 2) the Debye velocity for which we use , a numerical coefficient quite universal for glasses and taken from -SiO2. With the above, one calculates , which is a quantity that increases rapidly with at low . One divides then by that quantity, to obtain a result which according to (6) is equal to . One notes that in function of the latter is maximum at , and that the maximum value is simply . Unfortunately the noise in becomes much too high at low temperatures owing to the smallness of , so that a clear maximum cannot be identified. One notes however that the maximum in is not a maximum in , as is a rapidly growing function of . At , there is rather a step-like increase in . Such a feature is clearly recognizable between 25 and 35 K in the semilog presentation of Fig. 5. This suggests that reaches 1 around 30 K. An extrapolation of from higher indicates then that is an appropriate value, with an uncertainty smaller than 20 %. The resulting value is reasonable, especially owing to the observations made in Fab97 ; Fab99 . To complete the task, one can then solve for the quadratic equation (6). For each data point, the lowest root must be kept for and the highest one for . The noise in our data produces some complex roots for K. These have been rejected. Dividing the roots by , the values of shown in Fig. 6 are then obtained. The uncertainty in produces a similar uncertainty in the absolute scale of . This is of no consequence for the following discussion.
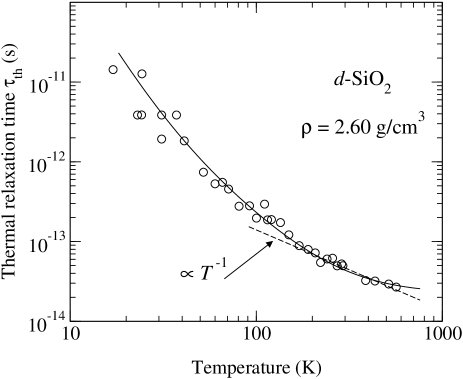
We observe that increases rapidly on cooling. It varies approximately in from to 600 K, and progressively faster below K. This is illustrated by the dashed line of slope -1 in Fig. 6. To produce the guides to the eye used in Figs. 4 to 6, we first adjusted to a sum of inverse powers of , obtaining the solid line shown in Fig. 6. We also adjusted to which is derived from Wachtman’s equation as discussed in And66 . This gives m/s, , and K, corresponding to the line shown in Fig. 4a which provides an excellent fit of up to the highest measured data point at near 600 K. Having , we can calculate , and then and as shown in Figs. 5 and 4b. The sharpness of the step near 30 K strongly depends on the assumed -dependence of in that region. Its exact position also depends on the value selected for . At this stage, the limited quality of the data would not justify attempting any further improvement on these adjustments. The main difficulty obviously arises from the inhomogeneous background contribution to .
We can now use Eq. (2) to calculate the velocity change associated with . As indicated in the Introduction, the result of this calculation is then referred to the unrelaxed velocity whose -dependence can have a structural origin. Thus one has
where is the Brillouin value measured at frequency . All velocity changes being relatively small, can be replaced by in the denominator on the left-hand side. Further, being anyway very small when , can be neglected in the denominator on the right-hand side of (7), so that finally
We remark that the size of the “correction” term is directly proportional to the value selected for .
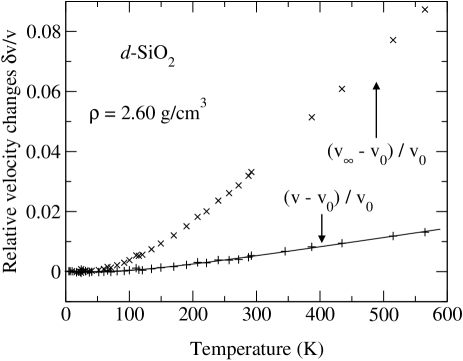
Figure 7 shows and . Both exhibit an anomalous -dependence, increasing as increases, but this anomaly becomes quite a bit stronger for the unrelaxed velocity .
V Discussion
The above results suggest that in -SiO2, contrary to all other investigated glasses, the damping of sound observed in Brillouin scattering is purely produced by the network viscosity, i.e. by the anharmonic interaction of collective modes rather than by the relaxation of local “defects”. Two features deserve additional discussion: 1) the temperature dependence of the relaxation time of the dominant thermal modes, ; 2) that of the unrelaxed sound velocity .
The particular behavior of , which decays above K, probably reflects the fact that in a glass, as opposed to crystals, the thermal modes are mostly diffusive or non-propagating. By comparison, in crystal quartz for example there is a large range of where decreases with Boe60 . To understand the nature of this difference, we consider the only available calculation of anharmonic lifetimes in disordered systems. It is based on the fracton model Ale86 . This model accounts for the non-propagating nature of the modes. As pointed out by the authors of Jag89 , fractons have been used to “obtain explicit results”, but “the approach would apply to any localized vibrational states”. We believe this remark is in particular true for what concerns the functional dependence in of the relaxation times. Indeed, the dependence found in Ale86 does not involve any of the various fractal dimensions, but just the crossover energy above which the modes become non-propagating. The -dependence results from the thermal population of the modes and their spatial overlap. It is presumably of quite general applicability to such situations, independently from the fractal model. The crossover energy is well known for -SiO2 as it has been carefully determined by x-ray inelastic scattering measurements Rat99 ; For02 ; Ruf03 . It is located at about 9 meV, or correspondingly at K. The prediction of Ale86 is that all relaxation times vary like for , whereas they diverge with at lower temperatures . We note that, qualitatively, this is in perfect agreement with our observations.
Further, the thermal conductivity in the Debye model can be calculated from using the standard kinetic equation Kit76 . Doing this, we find a calculated which is considerably larger than the measured one DMZ94 . Its -dependence also disagrees with the observations, as the calculation gives a that decreases with increasing at high , like in a crystal, contrary to the observed increase DMZ94 beyond the typical thermal conductivity plateau Zel71 common to glasses. The reason for this is of course that the modes contributing to are at best diffusive so that the kinetic equation is not applicable. This provides a second and independent indication that the thermal modes are essentially non-propagating.
Regarding the sound velocity, we first remark that the network viscosity has the usual effect of decreasing the velocity from to as increases. This is evident from a comparison of the two curves illustrated in Fig. 7. What is abnormal is that the unrelaxed velocity increases with . This anomaly is common to glasses that contain tetrahedral building blocks, as shown experimentally for SiO2, GeO2, BeF2, and zinc phosphate in Kra68 . An earlier proposal that this might be a manifestation of large structural inhomogeneities special to refractory glasses Kul74 does not seem supported by the fact that the effect is particularly strong in BeF2 which has a low glass transition temperature . A more likely explanation might be that there is a specific structural feature in SiO2-like glasses which leads to a -dependent reversible structural change as shown in recent simulations Hua04 . It was found in these that the angular position of the Si-O-Si plane around the Si-Si direction has distinct equilibrium values separated by jumps. The latter would produce in the glass a gradual transition similar in nature to the transformation in cristobalite. One might ask why there is no corresponding contribution to owing to such a transition-like mechanism. A possible explanation it that the transition being distributed in , most of the volume is always very far from so that the additional damping might be much too weak to be observable.
Another question of interest is whether the unrelaxed velocity could somehow become measurable in an appropriate experiment. One could naively imagine that it would suffice to investigate very high sound frequencies, as for example by going to sufficiently high momentum exchange in an x-ray Brillouin scattering experiment, to eliminate the viscous relaxation term in (2b) by forcing . Consider however the value s which is found at room in Fig. 6. To achieve would require THz which is already above THz. One runs then into a regime in which the sound waves are presumably hybridizing Gur03 with the SiO4 librational mode Heh00 , producing the boson peak Cou03 . Although such a measurement might give an indication about , it is certainly not a clean cut situation. The other alternative would be to reduce the temperature so as to increase the value of . This also soon meets its limits as the size of the viscous relaxation becomes negligible below K, as seen from Fig. 7. We thus find that it would unfortunately be difficult to obtain a direct measurement of the unrelaxed sound velocity.
To conclude, it seems that we have for the first time found a glass in which the Brillouin sound damping appears to be entirely controlled by the network viscosity. This already suggests that it is probably not appropriate to simply neglect the anharmonic damping as proposed for silica in Wie00 . This illustrates that the question is of importance, as it finally ties in with much more fundamental and debated issues, like the origin of the thermal anomalies of glasses Phi81 . We are fully aware that the noise in Fig. 2b is still far from satisfactory. We could only progress on this issue if we had an appreciably more homogeneous sample than the already excellent one used in this study. If so, it would be relatively straightforward to increase the spectrometer performance by using a spherical Fabry-Perot of larger spacing, such as 10 or 25 cm, the latter giving a factor five improvement over the present resolution.
References
- (1) Anderson P.W., Halperin B.I., Varma C.M., Phil. Mag. 25, 1 (1972).
- (2) Phillips W.A., J. Low Temp. Phys. 7, 351 (1972).
- (3) J. Jäckle, Z. Physik 257, 212 (1972).
- (4) Amorphous Solids: Low-Temperature Properties, edited by W.A. Phillips (Springer-Verlag, Berlin, 1981).
- (5) O.L. Anderson and H.E. Bömmel, J. Am. Ceram. Soc. 38, 125 (1955).
- (6) S. Hunklinger and W. Arnold, in Physical Acoustics, Vol. XII, edited by W.P. Mason and R.N. Thurston (Academic Press, New York, 1976), pp. 155-215, and references therein.
- (7) A model encompassing both two-level systems and relaxation is the soft-potential one. For a review, see e.g. D.A. Parshin, Phys. Solid State 36, 991 (1994).
- (8) J.W. Strutt, Baron Rayleigh, The Theory of Sound, Vol. II, §334, (The Macmillan Company, 1896).
- (9) P.G. Klemens, Proc. Roy. Soc. London, Ser. A, 208, 108 (1951).
- (10) S.R. Elliott, Europhys. Lett. 19, 201 (1992).
- (11) H.J. Maris, in Physical Acoustics, Vol. VIII, edited by W.P. Mason and R.N. Thurston (Academic Press, New York, 1971), pp. 279-345.
- (12) G.P. DeVault and R.J. Hardy, Phys. Rev. 155, 869 (1967).
- (13) H.J. Maris, Phys. Rev. 188, 1303 (1969).
- (14) A. Akhiezer, J. Phys. USSR 1, 277 (1939).
- (15) I.J. Pomeranchuck, J. Phys. USSR 4, 529 (1941).
- (16) H.E. Bömmel and K. Dransfeld, Phys. Rev. 117, 1245 (1960).
- (17) R. Vacher, J. Pelous, F. Plicque, and A. Zarembowitch, J. Non-Cryst. Solids 45, 397 (1981).
- (18) J. Fabian and P.B. Allen, Phys. Rev. Lett. 82, 1478 (1999).
- (19) S. Alexander, O. Entin-Wohlman, and R. Orbach, Phys. Rev. B 34, 2726 (1986).
- (20) R.O. Pohl, Xiao Liu, and EJ. Thompson, Rev. Mod. Phys. 74, 991 (2002).
- (21) P. Carruthers, Rev. Mod. Phys. 33, 92 (1961).
- (22) J.E. Graebner, B. Golding, and L.C. Allen, Phys. Rev. B 34, 5696 (1986).
- (23) E. Rat, M. Foret, E. Courtens, R. Vacher, and M. Arai, Phys. Rev. Lett. 83, 1355 (1999).
- (24) M.P. Zaitlin and A.C. Anderson, Phys. Rev. B 12, 4475 (1975).
- (25) D.A. Parshin and C. Laermans, Phys. Rev. B 63, 132203 (2001).
- (26) V.L. Gurevich, D.A. Parshin, and H.R. Schober, Phys. Rev. B 67, 094203 (2003).
- (27) V.G. Karpov and D.A. Parshin, Sov. Phys. –JETP 61, 1308 (1985).
- (28) M. Klinger and A.M. Kosevich, Phys. Lett. A 280, 365 (2001).
- (29) B. Rufflé, M. Foret, E. Courtens, R. Vacher, and G. Monaco, Phys. Rev. Lett. 90, 095502 (2003).
- (30) E. Courtens, M. Foret, B. Hehlen, B. Rufflé, and R. Vacher, J. Phys.: Condens. Matter 15, S1279 (2003).
- (31) R. Vacher, H. Sussner, and S. Hunklinger, Phys. Rev. B 21, 5850 (1980).
- (32) J. Hertling, S. Baeßler, S. Rau, G. Kasper, and S. Hunklinger, J. Non-Cryst. Solids 226, 129 (1998).
- (33) J. Wiedersich, S.V. Adichtchev, and E. Rössler, Phys. Rev. Lett. 84, 2718 (2000).
- (34) G. Ruocco and F. Sette, J. Phys.: Condens. Matter 13, 9141 (2001).
- (35) J.S. Lukesh, Phys. Rev. 97, 345 (1955).
- (36) J.P. Bonnet, M. Boissier, and A. Ait Gherbi, J. Non-Cryst. Solids 167, 199 (1994).
- (37) G. Weiss, A. Daum, M. Sohn, and J. Arndt, Physica B 219 & 220, 290 (1996).
- (38) K. Döring, S. Rau, G. Weiss, J. Arndt, and S. Hunklinger, Phys. Lett. A 20, 365 (1976).
- (39) Electrodynamics of Continuous Media, L.D. Landau and E.M. Lifshitz, Pergamon Press, Oxford 1960, §62 (see in particular the footnote on p. 260).
- (40) J. Jäckle, L. Piché, W. Arnold, and S. Hunklinger, J. Non-Cryst. Solids 167, 199 (1994).
- (41) C. Kittel, Introduction to Solid State Physics, 5th ed. (Wiley, New York, 1976).
- (42) P.W. Bridgman and I. Šimon, J. Appl. Phys. 24, 405 (1953).
- (43) J.R. Sandercock, in Light Scattering in Solids, M. Balkansky Ed., (Flammarion, Paris, 1971), p. 9.
- (44) R. Vacher, H. Sussner, and M. v. Schickfus, Rev. Sci. Instrum. 51, 288 (1980).
- (45) J. Arndt and W. Hummel, Phys. Chem. Miner. 15, 363 (1988).
- (46) M. Foret, R. Vacher, E. Courtens, and G. Monaco, Phys. Rev. B 66, 024204 (2002).
- (47) The data are from Vac81 complemented by unpublished results.
- (48) G.P. DeVault, Phys. Rev. 155, 875 (1967).
- (49) T.O. Woodruff and H. Ehrenreich, Phys. Rev. 123, 1553 (1961).
- (50) A. Jagannathan, R. Orbach, and O. Entin-Wohlman, Phys. Rev. B 39, 13 465 (1989).
- (51) J.-P. Bonnet, M. Boissier, C. Vedel, and R. Vacher, J. Phys. Chem. Solids 44, 515 (1983).
- (52) Y. Inamura, M. Arai, O. Yamamuro, A. Inaba, N. Kitamura, T. Otomo, T. Matsuo, S.M. Bennington, and A.C. Hannon, Physica B 263 & 264, 299 (1999).
- (53) J. Fabian and P.B. Allen, Phys. Rev. Lett. 79, 1885 (1997).
- (54) O.L. Anderson, Phys. Rev. 144, 553 (1966).
- (55) Da-Ming Zhu, Phys. Rev. B 50 (1994) 6053-6056.
- (56) R.C. Zeller and R.O. Pohl, Phys. Rev. B 4, 2029 (1971).
- (57) J.T. Krause and C.R. Kurkjian, J. Am. Ceram. Soc.51, 226 (1968).
- (58) M.N. Kul’bitskaya, S.V. Nemilov, and V.A. Shutilov, Sov. Phys. Solid State, 16, 2319 (1974).
- (59) L. Huang and J. Kieffer, Phys. Rev. B 69, 224203 (2004).
- (60) B. Hehlen, E. Courtens, R. Vacher, A. Yamanaka, M. Kataoka, and K. Inoue, Phys. Rev. Lett. 84, 5355 (2000).