A Mutual Attraction Model for Both Assortative and Disassortative Weighted Networks
Abstract
In most networks, the connection between a pair of nodes is the result of their mutual affinity and attachment. In this letter, we will propose a Mutual Attraction Model to characterize weighted evolving networks. By introducing the initial attractiveness and the general mechanism of mutual attraction (controlled by parameter ), the model can naturally reproduce scale-free distributions of degree, weight and strength, as found in many real systems. Simulation results are in consistent with theoretical predictions. Interestingly, we also obtain nontrivial clustering coefficient and tunable degree assortativity , depending on and . Our weighted model appears as the first one that unifies the characterization of both assortative and disassortative weighted networks.
pacs:
02.50.Le, 05.65.+b, 87.23.Ge, 87.23.KgThe past few years have witnessed a great deal of interest from physics community to understand and characterize the underlying mechanisms that govern complex networks. Prototypical examples cover as diverse as the Internet Internet , the World-Wide Web WWW , the scientific collaboration networks (SCN) CN1 ; CN2 , and world-wide airport networks (WAN)air1 ; air2 . As a landmark, Barabási and Albert (BA) proposed their seminal model that introduces the linear preferential linking to mimic the topological evolution of complex networks BA . However, networks are far from boolean structure. The purely topological characterization will miss important attributes often encountered in real systems. For example, the amount of traffic characterizing the connections of communication systems or large transport infrastructure is fundamental for a full description of these networks top10 . This thus calls for the use of weighted network representation, which is often denoted by a weighted adjacency matrix with element represents the weight on the edge connecting vertices and . In the case of undirected graphs, weights are symmetric , as this letter will focus on. A natural generalization of connectivity in the case of weighted networks is the vertex strength described as , where the sum runs over the set of neighbors of node . This quantity is a natural measure of the importance or centrality of a vertex in the network. Most recently, the access to more complete empirical data and higher computation capability has allowed scientists to consider the variation of the connection weights of many real graphs. As confirmed by measurements, complex networks not only exhibit a scale-free degree distribution with 23 air1 ; air2 , but also the power-law weight distribution ref1 and the strength distribution air2 . Highly correlated with the degree, the strength usually displays scale-free property with air2 ; traffic-driven ; empirical . Motivated by those findings, Alain Barrat et al. presented a model (BBV for short) to study the growth of weighted networks BBV . Controlled by a single parameter , BBV model can produce scale-free properties of degree, weight and strength. But its disassortative property BBV ; GBBV (i.e. the hubs are primarily connected to less connected nodes), as observed in real technological and biological networks, can hardly give satisfying interpretations to social networks like the SCN, where the hubs are very likely to be linked together (assortative mixing). Previous models as far as our knowledge can generate either assortative networks vazquez ; assortative ; assortative2 or disassortative ones BBV ; GBBV ; WWX ; vazquez , but rarely both. Thus, some questions arises here: why are social networks all assortative, while all biological and technological networks opposite? Is there a generic explanation for the observed incompatible patterns, or does it represents a feature that needs to be addressed in each network individually? Our work may shed some new light to these questions.
Former network models often impress on us such a network evolution picture: pre-existing nodes are passively attached by newly added node according to the preferential linking mechanism. This scenario, however, lacks the other side of fact that old nodes will choose the young at the same time. In addition, this evolution picture also ignores the universal mutual attraction between existing components, which leads to the creation and reinforcement of connections. This idea has been partly reflected in the studies of Dorogovtsev and Mendes (DM) DM who proposed a class of undirected and unweighted models where new edges are added between old sites and existing edges can be removed. In this letter, we will present a model for weighted evolving networks that considers the topological evolution under the general mechanism of mutual attraction between nodes. In contrast with previous models where weights are assigned statically ref2 ; ref3 or rearranged locally BBV ; GBBV , our model allow weights to be widely updated. It can mimic the reinforcement and creation of internal links as well as the evolution of many infrastructure networks. Specifically, the model can generate a diversity of scale-free quantities, nontrivial clustering property, and tunable assortativity coefficient. Therefore, one can easily find explanations to various real networks by our microscopic mechanisms.
The model starts from an initial configuration of isolated nodes with no connections between each other. At each time step, a new isolated node is introduced into the system. Then every existing node (including the newly-added one) selects other existing nodes for potential interaction with the probability
| (1) |
To guarantee the isolated new node be chosen by others the model requires , and hence is called the initial attractiveness DM2 . If two unconnected nodes are mutually selected, then an internal connection is created between them. If there already exists a connection between them, their link is just strengthened by increasing weight . Here, is the number of candidate nodes (of each site per step) to create and strengthen connections, and the initial attractiveness governs the probability for “young” nodes to get new links and weights. After the weights have been updated, the growth process is iterated by introducing a new vertex until the desired size of the network is reached.
One can easily find appropriate interpretations to real networks from our model mechanism. Take the SCN for example: the collaboration of scientists require their common interest and mutual acknowledgements. Unilateral effort does not promise effective activity. Speaking by the model language, though the nodes with low degree would like to connect to nodes with large degree, the latter do not necessarily wish to be linked by former. On the other hand, two scientists both with strong scientific potentials (large strengths) and long collaborating history are more likely to publish papers together. The above description of our model could also satisfactorily explain the WAN where the edge weigh denotes the relative magnitude of the traffic along a flight line. During the evolution of WAN, the airlines are more likely to open between metropolises that hold a high status in both economy and politics (with large strengths). With the improvement of economy and the expansion of population, the air traffic between connected metropolises will increase much faster than that between smaller cities. Due to their importance, there is an obvious need for smaller cities to build new airports to connect those metropolises. But the limit of energy and resources leads to the fact each node can only afford a finite number of connections. Therefore, they have to choose in front of the vertex pool.
The model time is measured with respect to the number of nodes added to the graph, i.e. , and the natural time scale of the model dynamics is the network size . Using the continuous approximation, we can treat and the time as continuous variables BA ; BBV . The time evolution of the weights can be computed analytically as follows:
| (2) | |||||
Hence, the strength is updated by this rate:
| (3) |
The last expression is recovered by noticing that
From Eq. (3), one can obtain the scaling of versus as , which also implies the scale-free distribution of strength with the exponent BBV
| (4) |
One can also obtain the evolution behaviors of weight and degree, and hence their power-law distributions MAM : with
| (5) |
and with as .
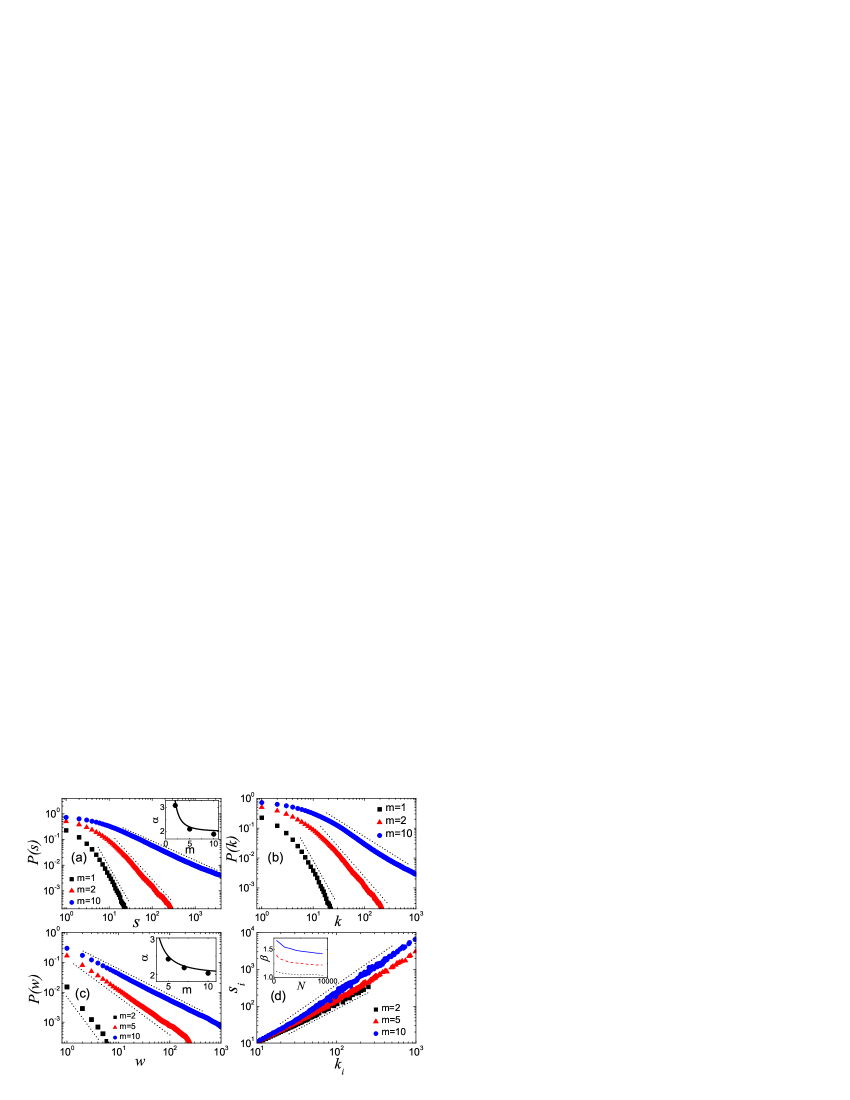
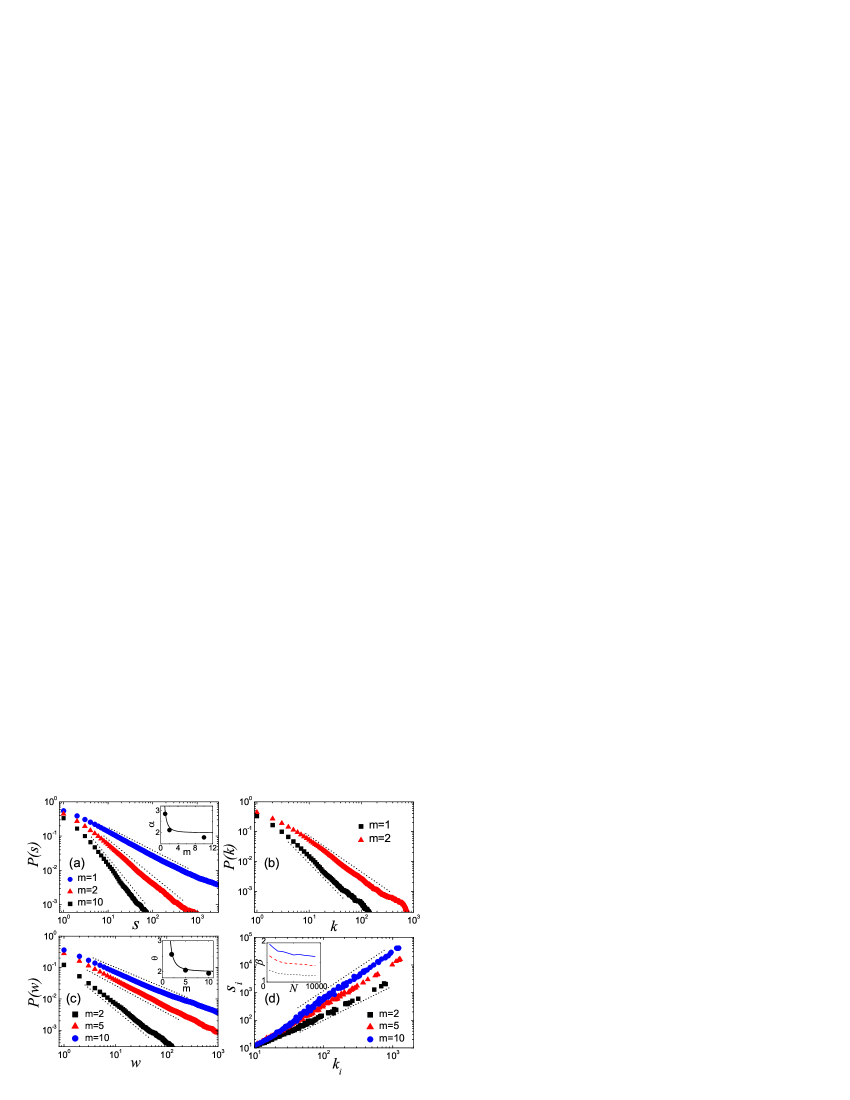
We performed numerical simulations of networks generated by choosing different values of and and recovered the theoretical predictions. We have also checked that the scale-free properties of our model networks are almost independent of the initial conditions. Fig. 1(a)-(d) report the probability distributions of strength, weight and degree, as well as the strength-degree correlation, fixed and tuned by . Specifically, Fig. 1(a) gives the probability distribution , which is in good agreement with the theoretical expression [Eq. 4]. Probability weight distribution also recovers the power-law behavior [Fig. 1(b)] with as predicted analytically [Eq. 5]. Fig. 1(c) shows the scale-free degree distribution and Fig. 1(d) reports the average strength of vertices with degree , which displays a nontrivial power-law behavior as confirmed by empirical measurements. The inset of Fig. 1(d) indicates that the exponent decreases slowly with the network size MAM , which is noticeably different from the linear correlation () as obtained in most previous models. Again, Fig. 2(a)-(d) show the simulation results by fixing and adjusting . In comparison with Fig. 1(a)(b), the distributions of strength and degree for both behave exponential corrections in the zone of low degree. This phenomenon occurs at large and the exponential part are very similar with the empirical findings in some social networks like SCN Newman . In the zone of large degree, however, we can still observe the scale-free behavior which again recover the theoretical exponent expressions. It is worth remarking ahead that the model at large can generate the assortative property too, which is seen in social networks. Thus, the introduction of is important for our model to mimic social networks.
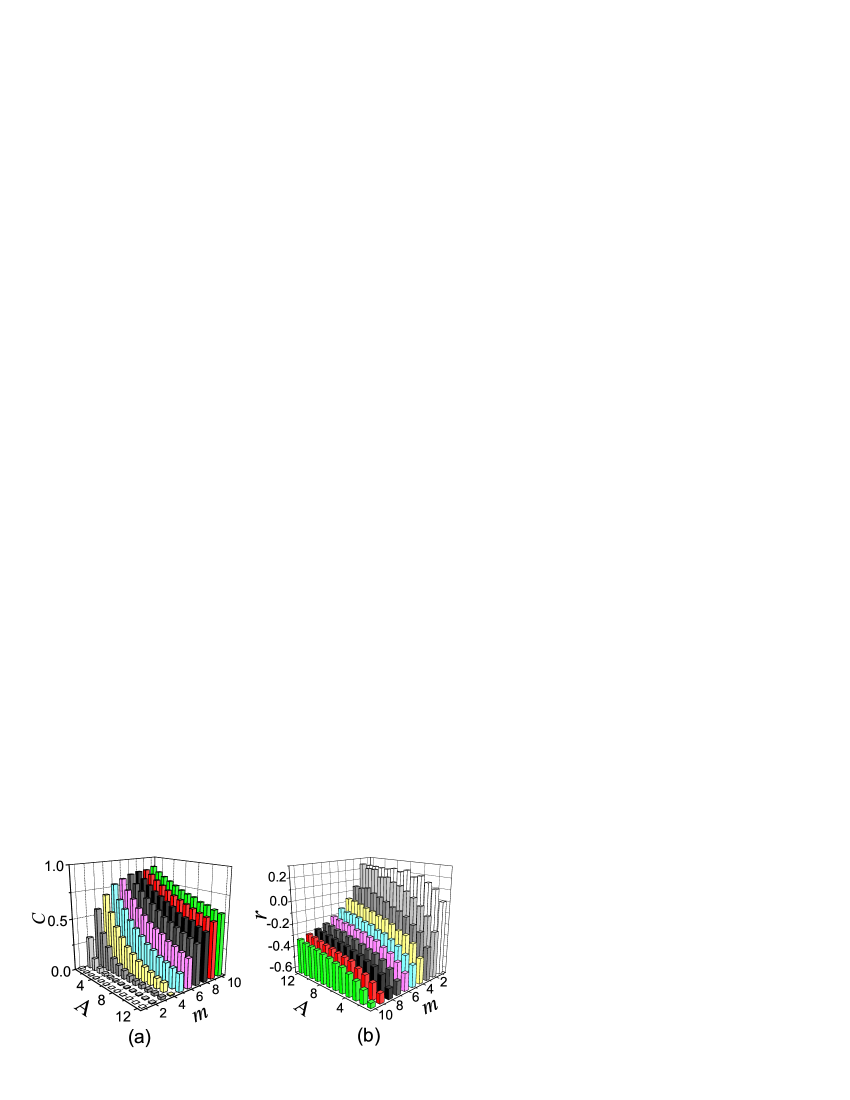
To better understand the degree correlations of our model networks, we also studied the clustering coefficient (which describes the statistic density of connected triples) Newman and degree assortativity mixing depending on the model parameters and . As presented in Fig. 3(a), for fixed monotonously decreases with , and for fixed monotonously increases with . Generally, it can be adjusted in the range ]0,1[. Obviously, the clustering property of our model is tunable in a broad range by simultaneously varying and , which makes it more powerful in modelling real networks. As shown in Fig. 3(b), degree assortativity for fixed , unlike the clustering case, increases with increasing ; while for given decreases with . For small and large , the model generates disassortative networks which can best mimic technological networks like the Internet Internet and WAN or even biological networks. While at large and small , assortive weighted networks emerge and can be used to model social graphs as the SCN. Actually, enhancing the initial attractiveness will considerably increase the chances for “young” nodes to be linked and strengthened. As low-degree nodes take the majority in the system, larger will lead to the stronger affinity between “young” vertices, and thus they can link together more easily. This explains the origin of assortative mixing in our model and may also shed some light on the old open question: why social networks are different from other networks in degree assortativity? Considering humans are active elements, it is plausible that the components of social networks possess considerable initial attractiveness (large ). On the other end, as controls the interaction level of internal connections, increasing will make the hubs become busier and busier, as they have to be linked by more and more “young” sites. It may explain why the disassortativity of the model is increasingly sensitive to . Combining these two parameters together, the mutual attraction model integrates two competitive ingredients that may be responsible for the mixing difference in complex networks.
The universal mutual attraction between nodes and the existence of initial node attractiveness are two important united ingredients of our model in mimicking real weighted networks. The general dynamics of node interaction proposed in this letter provides a wide variety of scale-free behaviors, nontrivial clustering coefficient and tunable degree assortativity. As far as our knowledge, the weighted network model presented here appears as the first one that can both mimic assortative and disassortative networks under a unified evolution dynamics. Its obvious simplicity and reproduced real-world variety allow more specific mechanisms to be integrated into future modelling efforts. Above all, the Mutual Attraction Model we presented here implies us the possible and worthwhile efforts in exploring the unified mechanisms behind various networks.
We thanks Yan-Bo Xie for his valuable comments and suggestions. This work is funded by NNSFC under Grants No. 10472116 and No. 70271070.
References
- (1) R. Pastor-Satorras and A. Vespignani, Evolution and Structure of the Internet: A Statistical Physics Approach (Cambridge University Press, Cambridge, England, 2004).
- (2) R. Albert, H. Jeong, and A.-L. Barabási, Nature 401, 130 (1999).
- (3) M.E.J. Newman, Phys. Rev. E 64, 016132 (2001).
- (4) A.-L. Barabási, H. Jeong, Z. Néda. E. Ravasz, A. Schubert, and T. Vicsek, Physica (Amsterdam) 311A, 590 (2002).
- (5) R. Guimera and L.A.N Amaral, Eur. Phys. J. B 38, 381 (2004).
- (6) A. Barrat, M. Barthélemy, R. Pastor-Satorras, and A. Vespignani, Proc. Natl. Acad. Sci. U.S.A. 101, 3747 (2004).
- (7) R. Albert and A.-L. Barabási, Rev. Mod. Phys. 74, 47 (2002).
- (8) A virtual round tabel on ten leading questions for network research can be found in the special issue on Applications of Networks, edited by G. Caldarelli, A. Erzan, and A. Vespignani [Eur. Phys. J. B 38, 143 (2004)].
- (9) W. Li adn X. Cai, Phys. Rev. E 69, 046106 (2004).
- (10) K.-I. Goh, B. Kahng, and D. Kim, cond-mat/0410078 (2004).
- (11) R. Pastor-Satorras, A. Vázquez, and A. Vespignani, Phys. Rev. Lett. 87, 258701 (2001).
- (12) A. Barrat, M. Barthélemy, and A. Vespignani, Phys. Rev. Lett. 92, 228701 (2004).
- (13) B. Hu, G. Yan, W.-X. Wang, and W. Chen, e-print cond-mat/0505417.
- (14) A. Vázquez, Phys. Rev. E 67, 056104 (2003).
- (15) R. Xulvi-Brunet and I. M. Sokolov, Phys. Rev. E 70, 066102 (2004).
- (16) M. Catanzaro, G. Caldarelli, and L. Pietronero, Phys. Rev. E 70, 037101 (2004).
- (17) W.-X. Wang, B.-H. Wang, B. Hu, G. Yan, and Q. Ou, Phys. Rev. Lett. 94, 188702 (2005).
- (18) S.N. Dorogovtsev and J.F.F. Mendes, Europhys. Lett. 52, 33 (2000).
- (19) S.H. Yook, H. Jeong, A.-L. Barabási, and Y. Tu, Phys. Rev. Lett. 86, 5835 (2001).
- (20) D. Zheng, S. Trimper, B. Zheng, and P.M. Hui, Phys. Rev. E 67, 040102 (2003).
- (21) S.N. Dorogovtsev and J.F.F. Mendes, Phys. Rev. Lett. 85, 4633 (2000).
- (22) B. Hu, Wen-Xu Wang et al. (unpublished).
- (23) M. E. J. Newman, SIAM Review 45, 167-256 (2003).
- (24) M. E. J. Newman, Phys. Rev. E 67, 026126 (2003).