The nature of iron-oxygen vacancy defect centers in PbTiO3
Abstract
The Fe3+ center in ferroelectric PbTiO3 together with an oxygen vacancy forms a charged defect associate, oriented along the crystallographic -axis. Its microscopic structure has been analyzed in detail comparing results from a semi-empirical Newman superposition model analysis based on finestructure data and from calculations using density functional theory.
Both methods give evidence for a substitution of Fe3+ for Ti4+ as an acceptor center. The position of the iron ion in the ferroelectric phase is found to be similar to the B-site in the paraelectric phase. Partial charge compensation is locally provided by a directly coordinated oxygen vacancy.
Using high-resolution synchrotron powder diffraction, it was verified that lead titanate remains tetragonal down to 12 K, exhibiting a -ratio of 1.0721.
I Introduction
Piezoelectric lead titanate oxide (PbTiO3, PT) is of considerable scientific and technical interest because of its extraordinary electromechanical properties leading to the development of novel devices, such as nonvolatile memories, detectors, sensors or actuators Lines ; Swa90 ; Sco98 . A variety of ferroelectric properties can be controlled by replacing the lead or titanium cations with rare-earth or transition-metal ions. In general, the effect of aliovalent dopants on PbTiO3, such as Fe3+, leads to the creation of oxygen vacancies () (The Kröger and Vink notation is used to designate the charge state of the defect with respect to the neutral lattice.) for charge compensation, which are expected to have a major impact on properties and performance of ferroelectric compounds. However, it is still not certain at which coordination sphere the charge compensation takes place, and because the oxygen vacancies are known to be the dominant charge carriers in this class of compounds this is an issue of technological and scientific importance Smyth . Beside charge compensation provided by , intrinsic doubly negatively charged centers have been proposed as additional charge compensating mechanism War9697 , these vacancies, however, being rather immobile and almost of no importance for charge transport.
When dealing with dopants on a sub-percentage level, a sensitive test of the local environment around the functional center can only be provided by electron paramagnetic resonance (EPR). In case of paramagnetic Fe3+ dopants, the sextet spin ground state is most influenced by the ligand-field originating from the nearest-neighbor O2- ions. The resulting finestructure (FS) interaction is a measure of the local symmetry. Various structure models have been proposed such as Fe defect associates, not-coordinated ’free’ Fe centers, as well as off-center shifted iron centers. Previous EPR studies on crystalline samples reported FS parameters spanning a large range Fe_EPR . Structural information about the dopant site in PbTiO3 and related compounds can be based on modelling the magnitude of the FS parameter, and therefore its accurate determination is an important issue. Because most samples are provided in polycrystalline form, it was important to demonstrate that FS parameters can reliably be determined even for polycrystalline compounds by invoking high-frequency-EPR RAE04c .
Structure modelling can be performed using different levels of sophistication. For instance, the FS parameter can be analyzed in terms of the semi-empirical Newman superposition model (NSM) New71 . Within this model, values for local distortion, i.e., atomic displacements from the ideal crystal structure in the vicinity of the Fe3+ center, are derived by comparing calculated and observed FS parameters. A detailed study was performed already 25 years ago by Siegel and Müller Sie79a ; Sie79b , in which the distortion of the cubic high-temperature unit cell in the ferroelectric phase was taken as decisive parameter controlling the FS splitting at the iron site. Over the past decades, the NSM parametrization has been refined by applying the method to many examples of paramagnetic centers in perovskite-type crystals. Examples include iron-doped PbTiO3, SrTiO3 and BaTiO3 Sie79a ; Sie79b , LiTaO3 Yeo01 , as well as chromium-modified PbTiO3 Erd03 and manganese in BaTiO3 Boe00 .
Second, an alternate approach offering additional microscopic information, is provided by calculating the equilibrium structure using density-functional theory (DFT). In recent years numerous calculations have been performed on ferroelectric materials in order to explain the microscopic mechanisms of spontaneous polarization Kin9394 ; Cohen and phase diagrams Zho94 ; Wag97 , or to determine the full piezoelectric stress tensor and dynamical charges Sag9899 . In particular, the role of defects and defect dipoles has been highlighted. Oxygen vacancies were shown to pin at 180∘-domain walls, confirming the tendency of these defects to migrate to the walls He03 . It was also derived that lead vacancies have stable charges ranging from to and thus being an effective acceptor in lead titanate Poe00 . The dipole moment of di-vacancies was calculated, demonstrating that the increased value may be an important source of local polarization and electric fields Coc04 . Another defect dipole originates from interstitial hydrogen impurities in lead titanate, which were found to bind to oxygen and to act as shallow donor impurities. The H-O dipole increases the polarization and the barrier for reversing the defect dipole, which can give rise to imprint Par00 .
In this work, we exploit the recently accurately determined FS parameter RAE04c as basis for structure modelling by performing an NSM analysis. Second, we compare the results obtained from this semi-empirical approach with results from DFT calculations, thus providing a sound basis for the postulated structural relaxation at the impurity site. As a result, we present a refined structural model of the iron functional center in lead titanate.
II Theoretical methods
II.1 Newman superposition model
With its five unpaired electrons, the free Fe3+ ion possesses a half-filled shell and can be described as orbital singlet. Its ground state configuration is () and the six-fold spin degeneracy can be lifted by the FS interaction and an external magnetic field. Neglecting hyperfine interaction, because the magnetic active isotope 57Fe is present in only 2.2 % natural abundance, an approximate spin-Hamiltonian for this high-spin system can be written as
| (1) |
Here, denotes the Bohr magneton, is the external magnetic field, the electron -matrix, are the FS Hamiltonian coefficients and are the extended Stevens spin operators Abr70 ; Rud99 . The first term represents the electronic Zeeman interaction and the second term is the effective FS Hamiltonian, describing the interaction of the crystal field with the paramagnetic ion. The rank in the Hamiltonian must be even, and is restricted by and , allowing terms up to for . However, parameters only up to second rank () will be used, because terms of fourth rank were shown to be at least two orders of magnitude smaller than those of second rank Fe_EPR (c-e). Parameters are related to the standard FS parameters by means of the scaling factor as . For one finds . The coefficients are related to the conventional spectroscopic FS parameters and by and .
The FS term in (1) lifts the degeneracy of eigen states even in the absence of an external magnetic field. There is always a choice of spin-operator coordinate system with respect to the crystal axes for which the ratio lies in the interval , analogous to the condition .
In case the symmetry of the paramagnetic site is axial, the FS coefficients in its eigen frame reduce to , . Furthermore, the -matrix for -state ions usually has very small anisotropy and can be treated as isotropic. The resulting scalar value is expected to be close to that of the free electron . For Fe3+ we therefore set and then the spin-Hamiltonian used for numerical spectrum simulation of the experimental data reduces to
| (2) |
The Newman superposition model New71 allows for an analysis of positions of neighboring ions (ligands) around the Fe3+ center, given the single-ligand contributions are known. The essential assumption of the NSM is that the spin-Hamiltonian parameters for a paramagnetic ion can be constructed by a superposition from individual contributions of separate neighboring ligands. The contribution of next nearest neighbor ions as well as interaction between the ligands are ignored. The NSM expression for the zero-field splitting parameters can be formulated as follows
| (3) |
Here, denotes every ligand, is the contribution from each single ligand, is the distance between the th ligand and the paramagnetic ion, and are the polar and axial angles between and the symmetry axis of the paramagnetic center, and are spherical harmonic functions of rank of the polar angles, listed in New71 (f). For the axial second-rank parameter one has
| (4) |
For the short-range distance dependence of the single-ligand contribution, the following empirical power law was established
| (5) |
The critical exponent parameter is specific to a particular ion-ligand system. For a given ligand, the intrinsic parameters are determined by the nature of the ligand and the covalency of the bond, which is assumed to depend exclusively on the bond lengths . Because in this model depends only on the ligand and its distance, and not on other properties of the host crystal, this parameter can be obtained from data of the same ion - ligand complex measured in other host crystals.
If the molecular coordinate system coincides with the principal axes system of the FS tensor, all off-diagonal elements vanish. For the Fe3+ ion at a position of tetragonal site symmetry (), the NSM can be used in its truncated form Sie79a
| (6) |
The strategy followed is to calculate the FS parameter by using the NSM for different conceivable structural arrangements, and to compare the calculated values with the experimental data. The experimental value for has been determined reliably RAE04c , and thus the interception points between the calculated curve and the experimental value is used for a prediction of actually realized local structure. Previously, the extremum of the calculated dependence was used to obtain an approximate ion position, although a correlation between the ZFS extremum and the ion equilibrium position cannot be derived from first principles. Sie79a ; Sie79b .
II.2 Density functional theory (DFT) modelling
The electronic structure of Fe:PbTiO3 was calculated using two different DFT methods. First, the local relaxation of the structure around the defects, FeTi, and VO, is studied by the Vienna Ab initio Simulation Package (VASP) T1 , as applied recently to study Pb-O vacancies in PbTiO3 Coc04 . However, instead of using ultrasoft pseudopotentials, Projector Augmented Waves (PAW) have been applied T2 ; T3 . The identical basis set has been used, namely Pb(,,), Ti(,,,,), and O(,), as well as the LDA exchange potential T4 , and a k-mesh. Second, the electron density distribution has been computed by the NFP (new full potential) program package T5 ; T6 ; T7 , which is a variant of the LMTO (linear muffin-tin orbitals) T8 procedure using a minimal basis set.
| atom | site symmetry | |||||
|---|---|---|---|---|---|---|
| Pb | exp. | 0.000000 | 0.000000 | 0.000000 | 0.820(27) | 4MM(001) |
| DFT | 0.000000 | 0.000000 | 0.000000 | |||
| Ti | exp. | 0.500000 | 0.500000 | 0.5415(14) | 0.66(10) | 4MM(001) |
| DFT | 0.500000 | 0.500000 | 0.5346 | |||
| O1 | exp. | 0.500000 | 0.500000 | 0.1239(19) | 0.38(19) | 4MM(001) |
| DFT | 0.500000 | 0.500000 | 0.0904 | |||
| O2 / O3 | exp. | 0.000000 | 0.500000 | 0.6288(13) | 0.38(19) | MM2(001) |
| DFT | 0.000000 | 0.500000 | 0.6032 |
III Results
III.1 Low-temperature X-ray data
The low temperature crystal structure of lead titanate has been the subject of some controversy over the past 50 years. Several X-ray and optical studies as well as dielectric measurements of PT samples indicated small anomalies in the temperature regions around 173 K and 123 K. These anomalies were detected as changes in the negative volume expansion coefficient in combination with superlattice reflections in powder samples Kob55 below 173 K and as changes in lattice parameters and birefringence in single crystals around 183 K. They were interpreted as a possible second order phase transition to a different tetragonal, later corrected into an antiferroelectric orthorhombic phase Kob83 . Moreover, this earlier claimed low-temperature tetragonal phase was assumed to transform into a further tetragonal phase around 113 K Ike69 , which does not fit into the picture of having an orthorhombic phase present at this temperature range. However, neither in neutron powder profiles Gla78 , nor in X-ray dilatometric and optical measurements using PT single crystals, additional evidence was seen for a structural transition at low temperatures Mab79 . First-principle studies Gar96 show that the thermodynamically stable phase at low temperatures is the tetragonal one, as all the unit-cell preserving distortions at low temperature have positive elastic constants and as there are no other mechanical instabilities present that could cause a transition to a lower symmetry group.
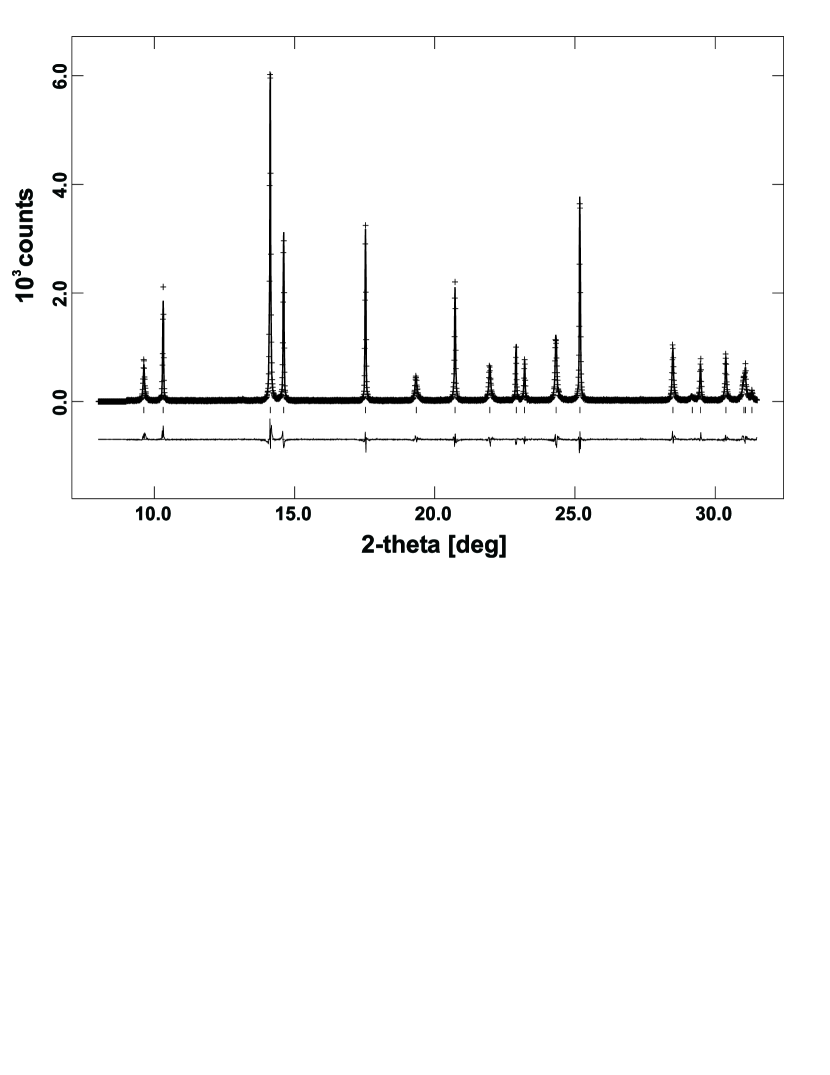
To identify the low-temperature structure and to obtain reference values for the interpretation of EPR data recorded at low temperatures, a high-resolution synchrotron powder diffraction experiment was carried out in reflection geometry at B2, Hasylab in Hamburg, Germany (figure 2). The measurement was performed at 12 K using a He closed-cycle cryostat, equilibrating the temperature in a low-pressure helium atmosphere. The powdered sample was glued onto a Si (711) low-background wafer and measured using an incident beam of wavelength nm in combination with an analyzing crystal and a scintillation counter Kna04 .
For Rietveld refinement, the general structure analysis system (GSAS) Lar94 was used. As the peak profiles of the ferroelectric material are quite complex, the profiles were fitted using the incorporated generalized model for anisotropic peak broadening Ste99 . The structural model could be refined with the symmetry of , keeping the lead positions fixed at the origin. No superlattice reflections were detected. The - ratio is 1.0721 at this temperature. Lattice parameters and atom coordinates obtained are given in table 1.
The detected low-temperature symmetry is consistent with the interpretation of the EPR spectra, for which a FS tensor of axial symmetry was used, thus indicating that no orthorhombic phase is present RAE04c . Therefore it can be concluded that PbTiO3 remains tetragonal down to 12 K, as already assumed earlier Gar96 .
III.2 Superposition-model analysis
The intrinsic NSM parameters and have not yet been determined for iron centers in lead titanate. However, they may be adopted from similar single crystals having equivalent FeO2- bonds in octahedral coordination. For Fe3+ in MgO at the central site with octahedral oxygen coordination, the following set of NSM parameters was reported: GHz, , pm Sie79a . The ionic positions of the nearest oxygens were taken from the X-ray data at 12 K (cf. section III.1). Because the site symmetry defines the direction of FS-tensor axes, the principal FS axis of the Fe3+ center was chosen along [0 0 1].
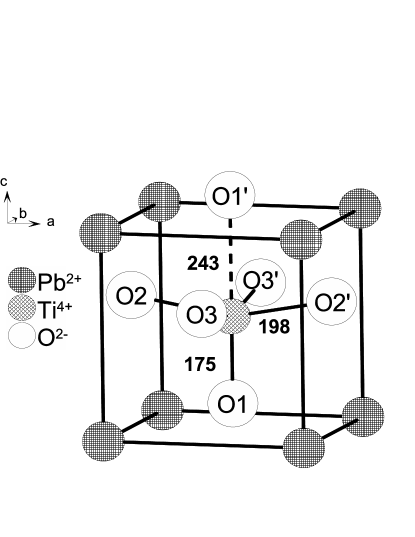
The common reference structure for undistorted cubic PbTiO3 is the perovskite structure, in which Ti4+ ions are octahedrally coordinated by oxygen ions and are positioned at the center of the unit cell. The Pb2+ ions are twelvefold coordinated by oxygens and are located at the corners of the cube, whereas the O2- ions are centered on each face of the unit cell. In the ferroelectric tetragonal phase, the oxygen octahedron is elongated along [0 0 1] and also shifted by 54 pm with respect to the Pb2+ position, the titanium ion being displaced from the center of cell along [0 0 1] by 17 pm, respectively. As a result, the titanium ion occupies an off-center position within the shifted oxygen octahedron (cf. table 1, figures 1, 4).
Iron is believed to substitute Ti4+ as Fe3+ at the B-site in the ABO3 perovskite structure. In order to verify this hypothesis, in the calculation we also considered the possibility that it substitutes at the A-site for Pb2+. Furthermore, to decide whether the oxygen vacancy is situated in the first coordination sphere or if it is located more distantly, two more structure models were investigated, with and without oxygen vacancy in nearest neighbor positions. The model of a directly coordinated oxygen vacancy can be realized in two different arrangements, in which the vacancy may substitute either for the apical O1 or O1’ position (cf. figure 1). A vacancy coordination at the equatorial O2 and O3 positions can be excluded as the orientation of the Fe defect dipole has to be along the -axis, due to the EPR results that indicate axial symmetry at the iron center RAE04c . For orientations of the oxygen vacancy along the and axes, the FS tensor would be of only orthorhombic symmetry. For a final model, the effect of a likely relaxation of oxygen ion positions in case of a directly coordinated oxygen vacancy has been taken into account. The relaxed ionic positions were obtained from the DFT calculations (cf. section III.3).
The position of the oxygen octaeder is defined using the crystal coordinate system given in table 1. Here, the oxygen vacancy is located either at (0.5000 0.5000 0.1239), or at (0.5000 0.5000 1.1239) in fractional coordinates, and the reference position of iron is at the titanium position in the undoped system at (0.5000 0.5000 0.5415). For the calculation of , the position of Fe3+ was varied along [0 0 1], the parameter defining the shift of the ion. A positive sign of defines a shift towards the O1’ oxygen, i.e. pm.
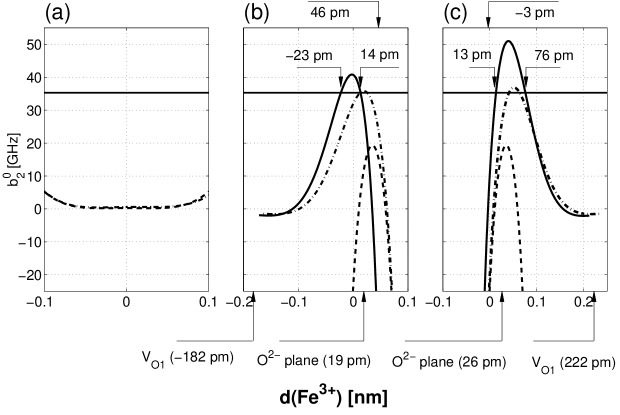
The results are presented in figure 3, depicting the dependence of calculated axial FS parameters on for the different structural models. In this figure, the experimentally obtained value for is represented by a solid horizontal line. As reference, the positions of the corresponding oxygen vacancies , , the position of the equatorial plane of oxygens through O2, O3, as well as the positions for the iron as obtained by the DFT calculations (cf. section III.3) are indicated by arrows.
Four conclusions immediately emerge from the NSM calculations: as compared to earlier studies for the iron center in lead titanate Sie79a ; Sie79b , in which static oxygen positions were used, the inclusion of relaxed positions for the equatorial oxygens towards the vacancy yields substantially refined and quite different curves for . Furthermore, the extremum of the dependence is no a-priori viable position for the iron displacement as has earlier been exploited as first guess Sie79a ; Sie79b ; the intersection points with the experimental value, not necessarily coinciding with the extremum, should be used instead. Finally, agreement with the experimental value RAE04c can be obtained only with a model, in which Fe3+ is substituted at the B-site with a directly coordinated oxygen vacancy, thus forming an Fe defect associate.
In the pure, unsubstituted ferroelectric phase, Ti4+ is displaced considerably from the center of the oxygen octahedron (cf. table 1). In contrast, there are two predicted positions for the Fe ion with an adjacent oxygen vacancy for each of the two models: for the Fe associate the iron ion is either displaced by pm from the Ti4+ position away from the vacancy towards the center of the truncated octahedron, or it is shifted considerably by pm towards the vacancy. For the alternative Fe associate, the Fe ion both times is shifted towards the vacancy, where one position is close to the plane of equatorial oxygens at pm and the other position is at pm. In order to distinguish between these positions, further information as provided by the DFT calculation is needed. The finally preferred structure (vide infra) of the Fe defect associate from the NSM calculations is presented in figure 4.
III.3 DFT calculations
III.3.1 DFT investigations of undoped PbTiO3
First, the iron-free host lattice of PbTiO3 was studied. Using the VASP code, lattice parameters pm and pm were obtained, which is in agreement with earlier calculations Mey02 . These values are smaller than the experimental values as expected from LDA calculations. The percentage difference between the experimental and calculated values are different for the and direction resulting in a calculated strain of 1.04 compared to the experimental value of 1.07. The calculated Ti-O bonds are given in figure 4(c).
Next, one oxygen vacancy was inserted in the supercell without providing charge compensation, i.e., the electronic structure of Pb8Ti8O23 was calculated for a determination of the local relaxation of the ions around the vacancy. As shown in figure 4 (d), one finds that the nearest neighbor Ti ions move away from the vacancy site, which was also predicted in a previous LDA calculation Par98 . If the vacancy is located at the O1 site (cf. figure 1), the Ti moves towards O1’ and the Ti-O1’ distance decreases in the LDA simulation from pm (in the perfect lattice) to pm. The Ti ion closest to the vacancy in positive c-direction moves from its original position by pm while the nearest Ti ion on the opposite side of the vacancy is displaced by pm. If the vacancy is located at the O2 site, Ti moves towards the O2’ site and the Ti-O2’ bond distance decreases from pm to pm.
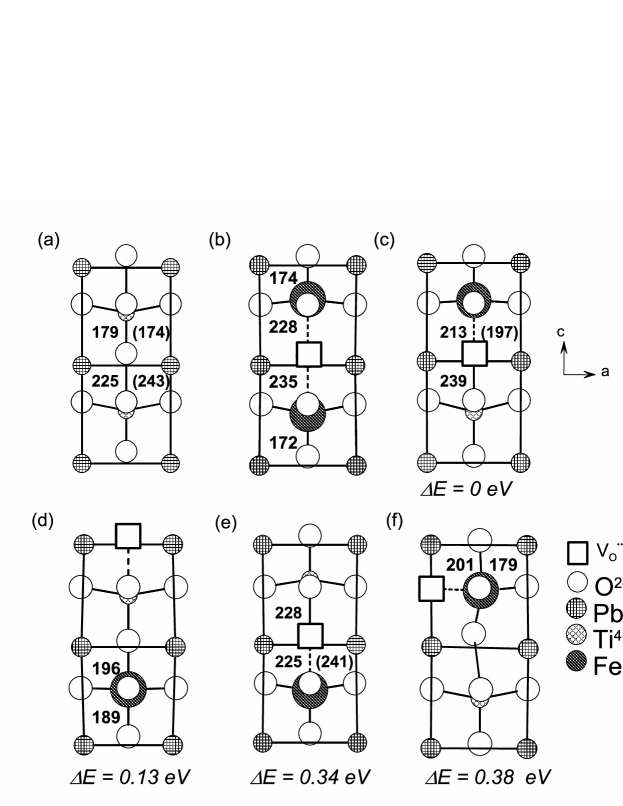
(a) undoped reference structure obtained from DFT calculations and from synchrotron powder difraction (cf. table 1);
(b) Fe-V- Fe’Ti complex in Pb8Ti6Fe2O23 oriented along -axis (model A1);
(c) Fe-V defect associate in [Pb8Ti7FeO oriented along -axis where the O1 oxygen is missing (shorter bond, model C1). The bracketed values are obtained with Newman superposition model on the basis of measured FS data. This model is the energetically most favored among models with one oxygen vacancy.
(d) Fe and V as isolated defects in [Pb8Ti7FeO (model C3);
(e) Fe-V defect associate in [Pb8Ti7FeO oriented along -axis where the oxygen O1′ is missing (longer bond, model C2);
(f) Fe defect associate in [Pb8Ti7Fe2O oriented along -axis where the oxygen O2 is missing (model C4);
Models B1-B4 which consider defects in charged Pb8Ti7Fe2O23 are in the same energetical sequence.
III.3.2 DFT investigations of iron-doped PbTiO3
The theoretical studies of the system Fe′:PbTiO3 have been performed using an supercell, in which now Ti is partly replaced by Fe. We have studied different possibilities of ion arrangements for the defect structures. In a model series A, we have replaced two Ti by Fe′, Fe, and for charge compensation we have created one O vacancy, , that is the supercell has the composition Pb8Ti6Fe2O23. In two other model series, we have replaced only one Ti by Fe′. In the model series B, we consider the neutral defect [Pb8Ti7FeO23] and in the model series C, the charged defect [Pb8Ti7FeO, charge compensation obtained by assuming a homogeneously charged background.
The ion arrangement in the three model series A to C are as follows. In model A1, the two Fe are next nearest neighbors and the is located between these two Fe forming a clustered defect oriented in the direction. Model A2 differs from model A1 only by the assumption that one of the Fe is an isolated point defect, whereas for model A3, we have assumed that all point defects are isolated. Model A4 to A6 vary from model A1 to A3 by the position of the oxygen vacancy, which is located in the (or ) direction (i.e., at O2 or O3 in figure 1) rather than in the direction (O1 in figure 1). For the systems of model series B [Pb8Ti7FeO23] and C [Pb8Ti7FeO23]+ with only one FeTi in the supercell we have again studied the arrangement of neighbored in or direction (models B4 or B1, B2 and C4 or C1, C2) as well as the arrangement with both Fe and as isolated point defects (models B3 and C3). For the defect associate neighbored in the direction we distinguished between the case where the vacancy site is at O1 (models B1 and C1) or at O1’ (models B2 and C2) as the distances of the O1 and O1’ to Fe are not the same.
For all these models we have performed a structure optimization varying the atomic positions but taking the lattice constants and fixed to the values obtained from the DFT results for the pure host lattice given in table 1. Considering the total energy of the optimized structures it is concluded for all three model series A to C that the oxygen vacancy in direction is always favored in energy, as compared to an orientation along . For models A1 to A6 the clustered defect Fe along the direction (model A1) gives the lowest energy followed by model A2 (Fe placed along the direction) with energy , where eV per supercell.
Also for the model series with only one Fe defect the direction of the Fe associate along (models B1 and C1) is preferred over the direction. More precisely, the most stable arrangement is the arrangement were O1 is missing and not O1’. The models B1 and C1 are lower in energy than B2 and C2, namely eV and eV. The arrangements B4 and C4 with an orientation of the Fe dipole along the axis is less stable than the favored arrangement within the model series by eV and eV. The associated defect Fe is favourable compared to the isolated defects by eV and eV. Applying the spin-polarised version of the LDA method changes the energy by less than eV per supercell and therefore has not been pursued any further.
Next, the movement of the ions around the vacancy shall be described. Qualitatively, we find the same trends for all models considered here, namely the cation nearest to the vacancy moves away from the vacancy site, which results in a shortening of the metal oxygen bond opposite to the vacancy.
Comparing the undoped structure (figure 4 (a)) and the defect structures (figure 4 (b)-(f)) one sees that the position of the metal ion above the vacancy moves upwards above the plane of the four oxygen ions which has already been found for TiTi in a previous calculation by Park and Chadi Par98 . The displacement of the Fe ion from the original Ti position in the undoped host lattice represented by the distance is equal to pm and pm for the two Fe in model A1. For the structures with only one Fe we get the following values for , = pm pm, and pm.
Considering the atomic arrangement and relaxation we finally point out that even for the pure host the weak O - Ti bond of pm compared to the other O - Ti bonds of and pm are not described quite satisfactorily by the LDA results, see figure 4. This also holds for GGA (Generalized Gradient Approximation) calculations which we have additionally performed using the potential of Perdew and Wang Per92 . Therefore, we have repeated all calculations under the constrain of leaving the strain constant, by both LDA and GGA. From these additional calculations we get the same main conclusions described above, namely that the associate Fe in direction has the lowest energy and compared to the original Ti and O positions the Fe is moving away from the vacancy V.
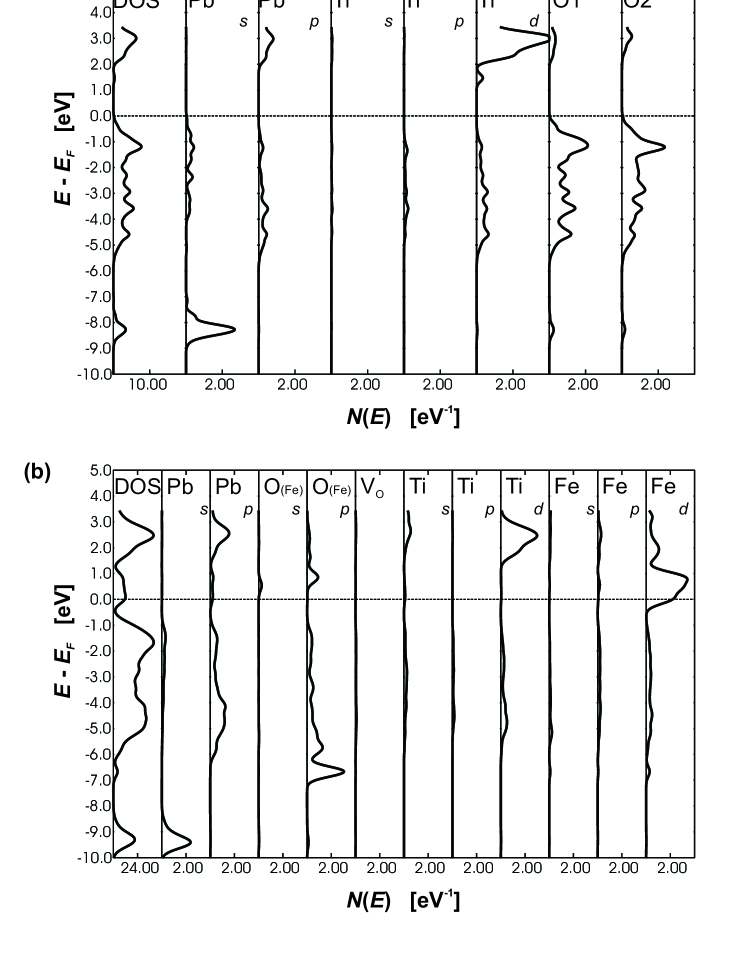
The resulting electron states are presented in figure 5, in which the density of states (DOS) and the partial DOS based on the Mulliken population analysis is plotted for PbTiO3 (figure 5 (a)). The lowest states in figure 5 (a) are the 6-like states of Pb. Above these states we find the oxygen 2-like states mixing with the 6- and 6-like states of Pb and the 4/4-like states of Ti. This indicates that the bonding has a distinct covalent character as found also in previous calculations Cohen ; Par98 ; T11 . The lowest states of the conduction bands are predominantly 3-like states of Ti for pure PbTiO3. For Pb8Ti6Fe2O23 in figure 5 (b), additional 1 and 2 basis functions centered at the vacancy site have been used. No new states are found in the band gap, which otherwise would indicate the existence of color centers at the oxygen vacancy. Compared to figure 5 (a) we get additional Fe like states and one can see that the highest occupied states are now the 3-like states of Fe. The oxygen, for which the partial DOS are displayed in figure 5(b), is neighbored to Fe in the -direction and labelled as O(Fe′). Its 2-like states show a common peak with the 3-like states of Fe in an energy range of to eV indicating an Fe - O bond.
IV Discussion
The most striking prediction from the NSM calculations is that the Fe3+ functional center in lead titanate forms a charged Fe defect associate with an oxygen vacancy in the local oxygen octahedron, the iron being substituted at the B-site of the perovskite ABO3 lattice. The similarity of ionic radii between Ti4+ at 68 pm and Fe3+ at 64 pm as compared to Pb2+ with a radius of 124 pm supports this assignment. In fully or partly ionic compounds, vacancies are charge balanced by other defects forming an overall neutral system. It can be assumed that partial charge compensation takes place at a nearest-neighbor oxygen site in the octahedron, because the resulting Coulomb interaction is the most important driving force for association. This assignment is in accordance with first-principle calculations that predict the binding of oxygen vacancies to acceptor-type impurities Poe99 , as well as to our DFT investigations that favor defect associates. Experimental findings indicate, however, that for other acceptor centers in similar compounds, like chromium-doped PbTiO3 Erd03 and copper-modified Pb[Zr0.54Ti0.46]O3 RAE04ab , no such association is present. Alternatively, like in iron-doped SrTiO3, an equilibrium between ’free’ Fe centers and Fe defect associates can be present Mer03 . With respect to the ionic mobility of free oxygen vacancies, the iron - oxygen vacancy defect dipole complex will be rather immobile in the ceramic. Hence, charge transport will be considerably hindered. Furthermore, the charged defect agglomerate may influence the poling properties by providing pinning centers for domain walls Yan99 . Moreover, dipolar defect complexes have been demonstrated to be able to also pin the polarization of the surrounding crystal Poe99 . In particular, oxygen-vacancy related defect dipoles have been shown to be involved in voltage offsets leading to imprint failure Pik95 and are suggested to play a crucial role in electrical fatigue Poe99 ; Lupascu ; Tag01 .
With respect to the reliability of the predictions obtained by the semi-empirical NSM approach, the following points should be mentioned. First, crystal distortions near the substituted ion and contributions from ions or vacancies more distant than neighboring ligands are neglected. Second, the main assumption of the NSM is that the spin-Hamiltonian parameters result from individual crystal field contributions of every nearest neighbor ion. Finally, the model is based upon the calculation of single electron-derived charge densities, whereas the FS interaction is related to two-electron expectation values. Apparently, the NSM has proven to yield reliable results for determining the second- and fourth-rank finestructure parameters in -state ions, probably because the intrinsic parameters have been refined over several decades using a large set of experimental data. If iron at a B-site of the perovskite ABO3 lattice can be considered as part of this set, the structural data can be considered as reliable.
Within these limits, the results can be interpreted as follows: the Fe3+ ion with the nearby oxygen vacancy probably has a position near the center of the truncated oxygen octahedron, i.e. at the (0.5000 0.5000 0.6288) position, whereas the second position in accordance with NSM prediction can be discarded because of DFT-based results.
As mentioned above, for all DFT calculations a unit cell was used. This size of the unit cell seems to be too small to avoid interaction of the defects, and the relaxation at the defect site could be smaller if larger unit cells are used. However, for computation time reasons we could not expand our unit cell. Nevertheless, it is most encouraging to find that the local structure with respect to Fe3+ positioning, predicted by DFT calculation and by the semi-empirical model are quite similar. The agreement is surprisingly good and might be fortuitous, considering the rather small supercell accomplished by an effective 12.5 % iron doping
The quantum mechanical simulations show, that the association of the defects is preferred over the arrangement as isolated point defects. Additionally, the arrangements for an orientation of the defect associate along the -axis are more stable than the ones along the and -axes, confirming the conclusion drawn from the axial symmetry of the FS tensor RAE04c . The off-center position of the Fe ion in the oxygen octahedron leads to two Fe distances in c direction and therefore to two different positions of the oxygen vacancy. According to the DFT investigations the vacancy at the O1 position in figure 1 is energetically favored, in which the long O1’- Fe distance decreases significantly.
Finally, because the observed EPR spectra RAE04c can almost exclusively be interpreted in terms of Fe associates, one can conclude that no ’free’ Fe3+ signals, i.e., iron ions without associated and hence with considerably smaller FS values, are present. Considering the condition for overall charge compensation there is a charge mismatch, because the Fe3+ ion substituting for the Ti4+ ions are singly negative charged (Fe), whereas the associated oxygen vacancy is doubly positive charged () with respect to the neutral lattice. Hence, additional mechanisms for charge compensation have to be discussed. Candidates for charge compensation are either free electrons () trapped in the lattice, lead vacancies , and the formation of positively charged cations, such as Pb2+ Pb+, Ti4+ Ti3+, or Fe3+ Fe2+. However, there no evidence for color centers in the DFT calculations and the variable valency ions Pb+, Ti3+ are paramagnetic with -values at about to 1.9, which were not observed in the EPR spectra and thus can be excluded. Since intrinsic double negatively charged lead vacancies have been suggested as additional charge compensation War9697 , the overall electro-neutrality condition for iron-modified lead titanate thus is proposed to be given by
| (7) |
This model is supported by the inherent loss of PbO during processing, for which reason a natural intrinsic di-vacancy pair was proposed Kee98 , its existence, however, being currently controversially discussed on the basis of DFT calculations Poe00 ; Coc04 .
In principle, charge-compensation could also be obtained by the creation of FeFe defect associates without the need for lead vacancies at all. The existence of such a defect structure is also supported by the DFT results, predicting this arrangement as of lowest energy. In this structure, the DFT calculations predicts two different iron sites, for which reason two Fe3+ EPR spectra with different FS parameters are expected. Using the calculated displacements of pm and pm, the corresponding NSM estimates are GHz and GHz, respectively. These values differ considerably from the experimentally obtained one, and for this reason this model can be discarded. Furthermore, for samples with low iron doping, this prediction of an FeFe defect associate might not be upheld. Finally, from the present EPR experiment there is no further evidence for this hypothesis, because no indication for strongly dipolar coupled iron centers is detected in the EPR spectra.
V Conclusion
In summary, a charged Fe defect associate in lead titanate has been identified and its microscopic structure has been determined based on a comparison of FS data with results of semi-empirical NSM and DFT calculations. The refined structure comprises information about the structural relaxation around the iron functional center in lead titanate. In the model presented, Fe3+ is substituted as an acceptor center at the perovskite B-site with a directly coordinated oxygen vacancy. The position of the iron ion in the ferroelectric phase is found to be almost centered in the unit cell, different from the bulk B-site Ti4+ ions in the ferroelectric phase that are considerably displaced, but similar to the B-site positions in the paraelectric phase.
The orientation of the Fe defect dipole is found to be along the crystallographic -axis. This can be concluded from EPR results which indicate axial symmetry at the iron center. Any other orientation of the defect dipole would result in an FS tensor of lower than axial symmetry. Furthermore, the DFT calculations confirm this assignment by showing that the total energy of the arrangement along the -axis is more stable than the ones along the and -axes. Using high-resolution synchrotron powder diffraction, a quite large -ratio of 1.0721 was measured, again pointing to the uniqueness of structural relaxation along c.
The impact of iron-doping in lead titanate on the macroscopic piezoelectric properties can now be rationalized from a microscopic point of view, because the iron - oxygen vacancy defect dipole complex will be rather immobile in the ceramic as compared to the ionic mobility of free oxygen vacancies. Thus, charge transport will be considerably hindered and the charged defect agglomerate may furthermore influence domain-wall motion and poling properties by providing pinning domain walls.
VI Acknowledgments
This investigation has been financially supported by the DFG priority program 1051 ’High-Field EPR in Biology, Chemistry and Physics’ and center of excellence 595 ’Electrical Fatigue in Functional Materials’. The authors are grateful to helpful comments of the referees made during the review process. Furthermore, we thank Dr. D.J. Keeble for sending us a preprint about his X-band EPR study of Fe3+ centers in lead titanate single crystals prior to publication.
References
- (1) M.E. Lines, A.M. Glass: Principles and applications of ferroelectrics and related materials, Oxford University Press, Oxford (2001)
- (2) W.L. Swartz, IEEE Trans. Electr. Insul. 25 (1990) 935-987
- (3) J.F. Scott, Ferroelectrics Rev. 1 (1998) 1
- (4) (a) D.M. Smyth, Annu. Rev. Mater. Sci. 15 (1985) 329; (b) ibid. Ferroelectrics 116 (1991) 117; (c) M.V. Raymond, D.M. Smyth, J. Phys. Chem. Solids 57 (1996) 1507
- (5) (a) W.L. Warren, G.E. Pike, K. Vanheusden, D. Dimos, B.A. Tuttle, J. Robertson, J. Appl. Phys. 79 (1996) 9250-9257; (b) W.L. Warren, B.A. Tuttle, F.C. Rong, G.J. Gerardi, E.H. Poindexter, J. Am. Ceram. Soc. 80 (1997) 680-684
- (6) (a) D.J.A. Gainon, Phys. Rev. 134 (1964) A1300-A1301; (b) G. Wessel, H. Goldick, J. Appl. Phys. 39 (1968) 4855; (c) R.G. Pontin, E.F. Slade, D.J.E. Ingra, J. Phys. C 2 (1969) 1146; (d) O. Lewis, G. Wessel, Phys. Rev. B 13 (1976) 2742-2746; (e) V.V. Laguta, M.D. Glinchuk, I.P. Bykov, Y.L. Maksimenko, J. Rosa, L. Jastrabik, Phys. Rev. B 54 (1996) 12353-12360
- (7) H. Meštrić, R.-A. Eichel, K.-P. Dinse, A. Ozarowski, J. van Tol, L.C. Brunel, J. Appl. Phys. 96 (2004) 7440-7444
- (8) (a) D.J. Newman, Adv. Phys. 20 (1971) 197; (b) D.J. Newman, W. Urban, J. Phys. C 5 (1972) 3101; (c) ibid., Adv. Phys. 24 (1975) 793; (d) D.J. Newman, E. Siegel, J. Phys. C 9 (1976) 4285; (e) D.J. Newman, J. Phys. C 15 (1982) 6627-6630; (f) D.J. Newman, B. Ng, Rep. Prog. Phys. 52 (1989) 699-763
- (9) E. Siegel, K.A. Müller, Phys. Rev. B 19 (1979) 109-120
- (10) E. Siegel, K.A. Müller, Phys. Rev. B 20 (1979) 3587-3596
- (11) T.H. Yeom, J. Phys. Condens. Matter 13 (2001) 10471-10476
- (12) E. Erdem, R. Böttcher, H.C. Semmelhack, H.J. Gläsel, E. Hartmann, phys. stat. sol. (b) 239 (2003) R7-R9
- (13) R. Böttcher, C. Klimm, D. Michel, H.C. Semmelhack, G. Völkel, H.J. Gläsel, E. Hartmann, Phys. Rev. B 62 (2000) 2085-2095
- (14) (a) R.D. King-Smith, D. Vanderbilt, Phys. Rev. B 47 (1993) 1651; (b) ibid. 49 (1994) 5828; (c) D. Vanderbilt, R.D. King-Smith, Phys. Rev. B 48 (1993) 4442
- (15) (a) R.E. Cohen, Nature 358 (1992) 136; (b) R.E. Cohen, H. Krakauer, Phys. Rev. B 42 (1990) 6416
- (16) (a) W. Zhong, R.D. King-Smith, D. Vanderbilt, Phys. Rev. Lett. 72 (1994) 3618; (b) W. Zhong, D. Vanderbilt, K.M. Rabe, Phys. Rev. Lett. 73 (1994) 1861
- (17) U.V. Waghmare, K.M. Rabe, Phys. Rev. B 55 (1997) 6161-6173
- (18) C.H. Park, D.J. Chadi, Phys. Rev. B 57 (1998) 13961
- (19) S. Pöykkö, D.J. Chadi, Phys. Rev. Lett. 83 (1999) 1231
- (20) G. Saghi-Szabo, R.E. Cohen, H. Krakauer, Phys. Rev. Lett. 80 (1998) 4321-4324; ibid. Phys. Rev. B 59 (1999) 12771-12776
- (21) L. He, D. Vanderbilt, Phys. Rev. B 68 (2003) 134103
- (22) S. Pöykkö, D.J. Chadi, Appl. Phys. Lett. 76 (2000) 499-501
- (23) E. Cockayne, B.P. Burton, Phys. Rev. B 69 (2004) 144116
- (24) C.H. Park, D.J. Chadi, Phys. Rev. Lett. 84 (2000) 4717-4720
- (25) A. Abragam, B. Bleaney: Electron Paramagnetic Resonance of Transition Ions, Clarendon Press, Oxford (1970)
- (26) C. Rudowicz and S. B. Madhu, J. Phys.: Condens. Matter 11(1999) 273-287
- (27) (a) G. Kresse and J. Hafner, Phys. Rev. B 48, (1993) 13115; (b) G.Kresse and J. Hafner, ibid. 49, (1994) 14251; (c) G. Kresse and J.Furthmuller, J. Comput. Mater. Sci 6, (1996) 15 (d) G. Kresse und J. Furthmller, Phys. Rev. B 54, (1996) 11169
- (28) P.E. Blöchl, Phys. Rev. B 50, (1994) 17953
- (29) G. Kresse, and J. Joubert, Phys. Rev. B 59, (1999) 1758
- (30) S.H. Vosko, L. Wilk, M. Nusair, Can. J. Phys. 58 (1980) 1200
- (31) M. Methfessel, M. Schilfgaarde and Casali R A. Lecture Notes in Physics 535, (2000) 114
- (32) E. Bott, M. Methfessel, W. Krabs and P. C. Schmidt, J Math Phys. 39, (1998) 3393
- (33) B. Mayer, H. Anton, E. Bott, M. Methfessel, J. Sticht, J. Harris, P. C. Schmidt, Intermetallics 11, (2003) 23
- (34) O. K. Andersen, Phys. Rev. B 12 (1975) 3060
- (35) B. Meyer, D. Vanderbilt, Phys. Rev. B 65 (2002) 104111
- (36) J. Kobayashi, R. Ueda, Phys. Rev. 99 (1955) 1900
- (37) J. Kobayashi, Y. Uesu, Y. Sakemi, Phys. Rev. B 28 (1983) 3866
- (38) S. Ikegami, I. Ueda, T. Miyazawa, J. Phys. Soc. Japan 26 (1969) 1324
- (39) A.M. Glazer, S.A. Mabud, Acta Cryst. B34 (1978) 1065
- (40) S.A. Mabud, A.M. Glazer (1979), 12, 49
- (41) A. Garcia, D. Vanderbilt, Phys Rev B 54 (1996) 3817
- (42) M. Knapp, C. Baehtz, H. Ehrenberg, H. Fuess, J. Synchrotron Rad. 11 (2004) 328-334
- (43) A.C. Larson, R.B. von Dreele, LAUR, Los Alamos National Laboratory (1994) 86
- (44) P.W. Stephens, J. Appl. Crystallogr. 27 (1999) 462
- (45) J.P. Perdew, J.A. Chevary, S.H. Vosko, K.A. Jackson, M.R. Pederson, D.J. Singh, C. Fiolhais, Phys. Rev. B 46 (1992) 6671
- (46) J.A. Rodriguez, A. Etxeberriab, L. González and A. Maiti, J. Chem. Phys, 117 (2002) 2699
- (47) A.M. Glazer, S.A. Mabud, J. Appl. Cryst. 12 (1979) 49
- (48) (a) R.-A. Eichel, H. Kungl, M.J. Hoffmann, J. Appl. Phys. 95 (2004) 8092-8096; (b) R.-A. Eichel, K.-P. Dinse, H. Kungl, M.J. Hoffmann, A. Ozarowski, J. van Tol, L.C. Brunel, Appl. Phys. A 80 (2005) 51-54
- (49) R. Merkle, J. Maier, Phys. Chem. Chem. Phys. 5 (2003) 2297-2303
- (50) T.J. Yan, V. Gopalan, P.J. Swart, U. Mohideen, Phys. Rev. Lett. 82 (1999) 4106
- (51) G.E. Pike, W.L. Warren, D. Dimos, B.A. Tuttle, R. Ramesh, J. Lee, V.G. Keramidas, J.T. Evans, Appl. Phys. Lett. 66 (1995) 484
- (52) D.C. Lupascu: Fatigue in ferroelectric ceramics and related issues, Springer, Heidelberg (2004)
- (53) A.K. Tagantsev, I. Stolichnov, E.L. Colla, N. Setter, J. Appl. Phys. 90 (2001) 1387-1402
- (54) D.J. Keeble, B. Nielsen, A. Krishnan, K.G. Lynn, S. Madhukar, R. Ramesh, C.F. Young, Appl. Phys. Lett. 73 (1998) 318
- (55) S. Serrano, C. Duque, P. Medina, A. Stashans, SPIE Proceedings 5122 (2002) 287
- (56) L. He, D. Vanderbilt, Phys. Rev. B 68 (2003) 134103
- (57) R.A. Evarestov, V.P. Smirnov, D.E. Usvyat, Solid State Commun. 127 (2003) 423-426
- (58) R.E. Cohen, H. Krakauer, Ferroelectrics 136 (1992) 65
- (59) V. Gavrilyachenko, R.I. Spinko, M.A. Martynen, E.G. Fesenko, Sov. Phys. Solid State 12 (1970) 1203
- (60) (a) G. Kresse, J. Hafner, Phys. Rev. B 47 (1993) 558; (b) G. Kresse, J. Furthmüller, Phys. Rev. B 54 (1996) 11169
- (61) P. Ghosez, J.P. Michenaud, X. Gonze, Phys. Rev. B 58 (1998) 6224
- (62) Y. Kuroiwa, S. Aoyagi, A. Sawada, J. Harada, E. Nishibori, M. Takata, M. Sakata, Phys. Rev. Lett. 87 (2001) 217601