NMR evidence for very slow carrier density fluctuations in the organic metal (TMTSF)2ClO4
Abstract
We have investigated the origin of the large increase in spin-echo decay rates for the 77Se nuclear spins at temperatures near to in the organic superconductor (TMTSF)2ClO4. The measured angular dependence of demonstrates that the source of the spin-echo decays lies with carrier density fluctuations rather than fluctuations in TMTSF molecular orientation. The very long time scales are directly associated with the dynamics of the anion ordering occurring at , and the inhomogeneously broadened spectra at lower temperatures result from finite domain sizes. Our results are similar to observations of line-broadening effects associated with charge-ordering transitions in quasi-two dimensional organic conductors.
pacs:
74.70.Kn, 75.30.Gw, 76.60.-k(TMTSF)2ClO4 is a member of the Bechgaard salts family of organic conductors and superconductors. While the original discovery of organic superconductivity was made in the isostructural system (TMTSF)2PF6 at Orsay Jerome et al. (1980), the perchlorate salt was interesting because it was the only composition undergoing a superconducting transition () at ambient pressure Parkin et al. (1981); Ishiguro et al. (1998). Another difference, when compared with the hexaflouride salts is that the counterion is non-centrosymmetric. As a result, there is a symmetry breaking of the high-temperature crystallographic space group (Pmma), when the ClO4 counterions orientationally order at with wavevector Pouget and Ravy (1996). This particular leads to inequivalent TMTSF stacks and therefore also two bands crossing the Fermi energy . Some of the low-temperature properties of (TMTSF)2ClO4 that differ from the PF6 salt are attributed to this difference Lebed et al. (2004); Kang et al. (1993); Chashechkina and Chaikin (1997, 1998).
The phase transition at is a metal-metal phase transition driven by lattice Coulomb effects at which a disproportionation, or charge order (CO), of carrier density between the adjacent stacks accompanies the counterion ordering. By now, CO is known to be ubiquitous to the analog TMTTF-based salts with counterions ranging from hexaflourides like AsF6 to non-centrosymmetric SCN or ReO4. Those systems are all insulators, either resulting from the broken-symmetry of the CO phase transition itself Seo and Fukuyama (1997); Chow et al. (2000); Monceau et al. (2001) or resulting from a dimerization of intrastack bond distances between TMTTF molecules Emery et al. (1982); Jerome and Schulz (2002). In the case of the insulators, there is little doubt that electron-electron interactions play a crucial role; nevertheless there is empirical evidence that coupling to the counterions allows the CO transition to take place. We examine the effects of the transition on the NMR properties as a window into what differences might be observed when compared to what is seen in the insulators.
Here we explore the effects of the anion ordering on the 77Se NMR spectrum and relaxation in (TMTSF)2ClO4. In this case, the transverse spin relaxation rate is strongly affected by slow fluctuations of the electronic carrier density above . The slow fluctuations have been observed previously by Takigawa and Saito (TS) Takigawa and Saito (1986), but with the difference that our experiments are done using single crystals, and we are able to demonstrate that the carrier density fluctuations rather than molecular orientational fluctuations are responsible. The linewidth broadens homogeneously in association with these fluctuations and narrows on cooling further. From experiments undertaken below on quenched and relaxed samples, we conclude that the spectrum is dominated by disorder effects. This is very different from the insulators, where distinct symmetry-breaking signatures of the ordered phase are observed Zamborszky et al. (2002). Even in the presence of the disorder, (TMTSF)2ClO4 is a superconductor, and the pairing is probably not s-wave.
The (TMTSF)2ClO4 crystals were grown using standard electrolysis techniques. In this case, the dimensions are and the mass is . Typically, crystals grow longer along the highly-conducting stack direction relative to the other directions. Our goal was to investigate the effect on the hyperfine fields resulting from the ClO4 anion ordering, so the appropriate coil geometry is unusual when compared to most NMR investigations of the Bechgaard salts. We expected the hyperfine fields are principally dipolar Takigawa and Saito (1986), arising from the orbital on the Se atoms, extending out of the plane of the molecule. As a result, the strongest hyperfine fields are with the dc field aligned along the stacking axis, so we chose the symmetry axis of the coil to allow for sample rotations with the external field lying in the - plane. The AO transition occurs at , so we cooled at through it to reach the highly-conducting relaxed state.
Shown in Fig. 1 is the spin-echo decay rate (here we define as the time corresponding to decay) vs. temperature for several angles of the applied field . As observed by Takigawa and Saito Takigawa and Saito (1986), we see a substantial increase in the relaxation rate on lowering the temperature through . The questions we answer are how this increase in is related to anion ordering and the mechanism by which it occurs. By rotating the sample, we establish the anisotropy in in the vicinity of . The size of the peak is found largest for the field applied along the stacking axis , somewhat smaller for the -direction, and even less when is rotated away from by (inset; also see Eq. 2 below, noting that 3cos), where the anisotropic part of the hyperfine field vanishes. At the peak, the rate is too fast to allow for a measurement with the field along .
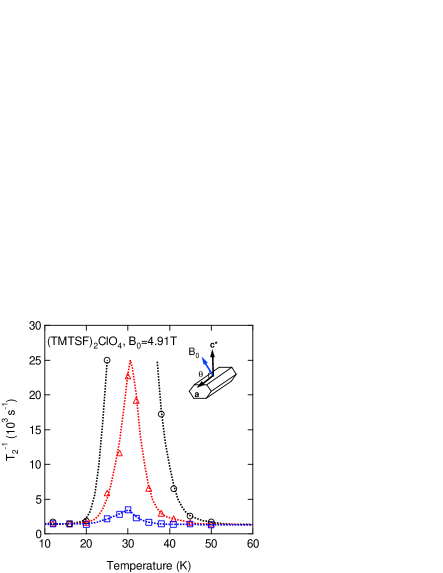
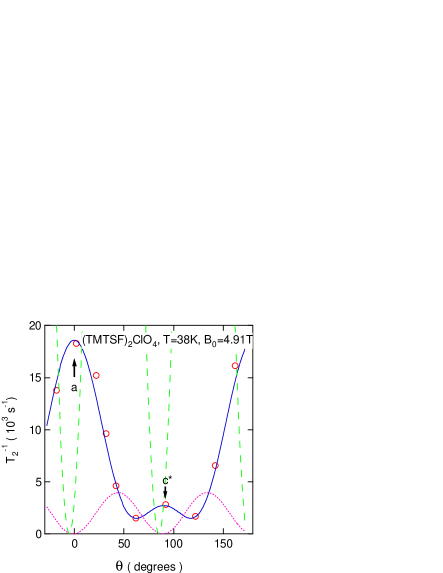
A more complete angular dependence of the spin-echo decay rate is shown in Fig. 2 at , where the relaxation rate is enhanced over a temperature-independent background. We also notice that there is a change in linewidth and lineshape on cooling through the temperatures where peaks. In the high temperature regime (i.e., ), the lineshape is very close to Gaussian. It changes to Lorentzian on the high-temperature side of the peak and returns to Gaussian (although considerably broader) on the low-temperature side of the peak.
In what follows, we make the case that the peak in vs. is a result of the slowing down of carrier density fluctuations linked to the inequivalence of TMTSF stacks developing at the anion ordering transition. The spin-echo decay is affected by the density fluctuations through the z component of the hyperfine fields, because local temporal variations result in dephasing of the precessing spins involved in a spin-echo experiment. To be more specific, suppose that a nuclear spin is situated in an environment in which the local field switches randomly between two discrete on a time scale . If this is the only source for the spin-echo decay, then the spin-echo amplitude decreases as
| (1) |
in the extreme narrowing limit (), with the gyromagnetic ratio. When Eq. 1 applies, the spectrum is said to be motionally narrowed. The spin-echo decay rate increases when grows larger, as it would on the approach to the anion ordering transition. Dephasing is most efficient when , where we expect a peak in . Below, we evaluate the form of the hyperfine coupling, and use it to describe the angular dependence of the spin-echo decay rate.
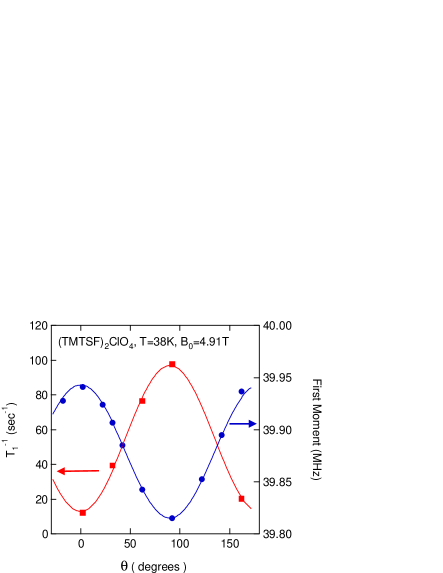
The angular dependence of the first moment as well as the spin-lattice relaxation rate at are shown in Fig. 3. We assume these are consistent with a uniaxial hyperfine coupling of the form
| (2) | |||||
| (3) |
with the volume per formula unit and the dimensionless spin susceptibility. is the contribution from core polarization of the Se ions. We assume that is dominated by the intra-atomic Se orbital and takes the form with the carrier density on a single ion. The upper limit for is 0.25; it is reasonable to expect less, and TS used calculated in Ref. Metzger (1981). The stacking (i.e., ) axis is very nearly coincident with the principal axis orthogonal to the plane of the TMTSF molecule.
Then the hyperfine field contribution to the spin-lattice relaxation rate also varies with angle, even though the spin susceptibility is isotropic Miljak et al. (1988). For () and where correlations are ignored, we have
| (4) |
with the gyromagnetic ratio of the free electron. For the angular dependence of the relaxation rate, we obtain
| (5) |
where .
Inserting the accepted value for the spin susceptibility of Miljak et al. (1988) into Eq. 3, together with extracted from the angular dependence of the first moment (Fig. 3), we obtain a value for , where is the Bohr radius. This value is larger than the obtained for Se atoms from Hartree-Fock calculations Fraga et al. (1976). The solid line running through the relaxation rate data shown in Fig. 3 is a least square fit to Eq. 5, from which we extract SLR . Returning to Fig. 2 and using this value of , we obtain the solid line through the data points using the function
| (6) |
with the external applied magnetic field, and a temperature and angle independent constant. The first term of Eq. 6 results from local field fluctuations originating in variations of the hyperfine coupling (Eq. 3), which are caused by carrier density fluctuations. At higher temperatures, is sufficiently short so as to make hyperfine field fluctuations inconsequential for the spin-echo decay, and it grows upon cooling with the slowing of the lattice fluctuations. is a constant that measures the amplitude of the hyperfine field fluctuations relative to the average.
Although the dependence of the spin-echo decay rate on the external field is the same as in TS model, the dependence on angle is very different to that expected for orientational fluctuations of the molecule. For contrast, we show the relative angular dependence of this mechanism for orientational fluctuation amplitudes of in Fig. 2. In that case, the spin-echo decay rates induced by the local field fluctuations are largest where is maximum, namely near to . Instead, we observe a minimum at . The angular dependence is consistent with fluctuations in the hyperfine coupling, which includes the factor representing the fractional number of carriers per Se atom. Our interpretation is that as the correlation length for the counterion ordering grows, so does the characteristic time scale for the fluctuations in the usual way. In the ordered state there is an inequivalent carrier density on adjacent stacks, as a result of the period doubling of the lattice in the direction. The fluctuations in the component of the hyperfine field parallel to the applied field follow. What is striking is that the time scales are governed by the lattice motion, while the hyperfine fields merely probe it.
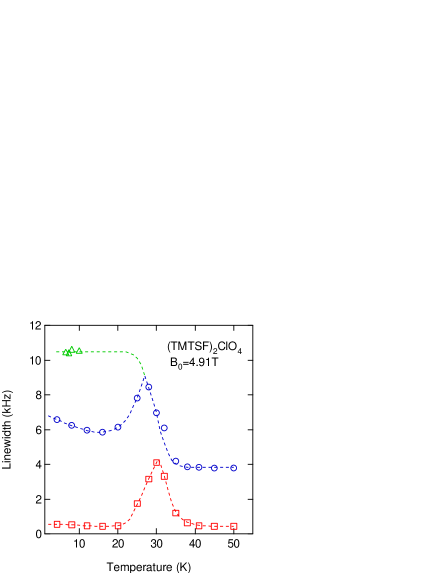
The temperature dependence of the homogeneous and inhomogeneous linewidth for is shown in Fig. 4, both in the relaxed and completely quenched state. At high temperatures, the spectra are dominated by the inhomogeneous broadening due to the inequivalent Se sites. The line is then homogeneously broadened on the high temperature side of the peak and is narrowed again on the low temperature side of the peak in the relaxed state. At lower temperatures (below ), the inhomogeneous broadening grows significantly without evidence for saturation.
The fluctuation amplitude of the hyperfine field can be estimated from the low temperature linewidth in the completely quenched state (Fig. 4) from which we obtain . Using this value of and , can be evaluated as . We can also estimate the characteristic time scale of the fluctuations near the peak to be . On the low temperature side of the peak of the fluctuations are so slow as to be ineffective in dephasing the transverse nuclear spin components in a spin-echo experiment. That we should observe this trend above should not be surprising because only on very slow cooling through the anion ordering transition results in a relaxed phase and superconductivity.
It remains to explain the nature of the low temperature inhomogeneous broadening in Fig. 4, which has a similar angular dependence as the homogeneous broadening peaking near . Instead of two discrete peaks in the spectrum, there is a single broad feature. As a result of the anion ordering, there is a distinction between adjacent chains, say “A” chains and “B” chains. Zone folding produces two bands crossing the Fermi energy, where the degeneracy at the zone face near is lifted by a small gap, . There is a corresponding difference in Fermi wavevector,
| (7) |
The two bands are of predominantly “A” or “B” character for these states near to the zone edge, but they are mixed if , with the correlation length of the counterion ordering measured along the stacks. Using Uji et al. (1996); Lebed et al. (2004) and gives Å-1. Therefore, quite large values of are necessary to maintain the distinction between “A” and “B” chains. Perhaps sufficient order for observation of distinct chains could be achieved with slower cooling. Indeed, in magnetotransport studies Uji et al. (1996), much slower rates () were necessary to observe interference effects linked to the existence of the gap induced by the anion ordering Uji et al. (1996).
If we presume the growth of the inhomogeneous broadening at low temperatures (Fig. 4) is linked to the configuration of the counterions, then either it is a dynamic effect linked to motional narrowing associated with lattice defect mobility, or it is a static effect, where the nature of the defects in the counterion sublattice changes as the temperature is lowered. For the latter, an example is where the domain boundary between “A” and “B” stacks broadens upon cooling, perhaps as a consequence of thermal contraction of the lattice. Experiments sensitive to spectral diffusion could distinguish between the two mechanisms for the broadening.
Finally, we make some general comments on our observations in the context of charge ordering in organic conductors. In our view, the reason for the very slow fluctuations evident here are the large masses and moments of inertia involved in the anion ordering transition. As a result of the coupling of the electronic states to the lattice potential, this becomes apparent in the spin-echo decay and inhomogeneous line broadening at low temperatures. Very similar results for spin-echo decays and inhomogeneous broadening were recently reported in 13C NMR experiments on -(BEDT-TTF)2RbZn(SCN)4 Chiba et al. (2004), a quasi-two dimensional organic conductor. In that case, there is strong evidence that the slow fluctuations are directly associated with a charge-ordering phase transition, also linked to metal-insulator transition, for the 1/4-filled system. We suggest that the slow fluctuations are evidence that coupling to the lattice is an important component of the CO transition in that system, and perhaps all of the quasi-two dimensional organic systems undergoing charge order symmetry breaking.
This work was supported by the National Science Foundation under grant No. DMR-0203806. We acknowledge helpful discussions with Serguei Brazovskii.
References
- Jerome et al. (1980) D. Jerome, A. Mazaud, M. Ribault, and K. Bechgaard, J. Phys. (Paris) Lett. 41, L95 (1980).
- Parkin et al. (1981) S. S. P. Parkin, M. Ribault, D. Jérome, and K. Bechgaard, J. Phys. C 14, L445 (1981).
- Ishiguro et al. (1998) T. Ishiguro, K. Yamaji, and G. Saito, Orgainc Superconductors, Solid-state sciences (Springer-Verlag, New York, 1998).
- Pouget and Ravy (1996) J. P. Pouget and S. Ravy, J. Phys. I (France) 6, 1501 (1996), (review paper).
- Lebed et al. (2004) A. G. Lebed, N. N. Bagmet, and M. J. Naughton, Phys. Rev. Lett. 93, 157006 (2004).
- Kang et al. (1993) W. Kang, S. T. Hannahs, and P. M. Chaikin, Phys. Rev. Lett. 70, 3091 (1993).
- Chashechkina and Chaikin (1997) E. I. Chashechkina and P. M. Chaikin, Phys. Rev. B 56, 13658 (1997).
- Chashechkina and Chaikin (1998) E. I. Chashechkina and P. M. Chaikin, Phys. Rev. Lett. 80, 2181 (1998).
- Seo and Fukuyama (1997) H. Seo and H. Fukuyama, J. Phys. Soc. Japan 66, 1249 (1997).
- Chow et al. (2000) D. S. Chow, F. Zamborszky, B. Alavi, D. J. Tantillo, A. Baur, C. A. Merlic, and S. E. Brown, Phys. Rev. Lett. 85, 1698 (2000).
- Monceau et al. (2001) P. Monceau, F. Y. Nad, and S. Brazovskii, Phys. Rev. Lett. 86, 4080 (2001).
- Emery et al. (1982) V. J. Emery, R. Bruinsma, and S. Barisic, Phys. Rev. Lett. 48, 1039 (1982).
- Jerome and Schulz (2002) D. Jerome and H. J. Schulz, Adv. Phys. 51, 293 (2002).
- Takigawa and Saito (1986) M. Takigawa and G. Saito, J. Phys. Soc. Japan 55, 1233 (1986).
- Zamborszky et al. (2002) F. Zamborszky, W. Yu, W. Raas, S. E. Brown, B. Alavi, C. A. Merlic, and A. Baur, J. Phys. IV France 12, 139 (2002).
- Metzger (1981) R. M. Metzger, J. Chem. Phys. 75, 482 (1981).
- Miljak et al. (1988) M. Miljak, J. R. Cooper, and K. Bechgaard, Phys. Rev. B 37, 4970 (1988).
- Fraga et al. (1976) S. Fraga, K. M. S. Saxena, and J. Karwowski, Handbook of atomic data (Elsevier, Amsterdam, 1976).
- (19) The measured spin-lattice relaxation rate is faster than what is predicted using Eq. 4, and also that predicted in Ref.Bourbonnais (1993); Wzietek et al. (1993) where it is argued that one-dimensional paramagnons are responsible for the relaxation.
- Uji et al. (1996) S. Uji, T. Terashima, H. Aoki, J. S. Brooks, M. Tokumoto, S. Takasaki, J. Yamada, and H. Anzai, Phys. Rev. B 53, 14399 (1996).
- Chiba et al. (2004) R. Chiba, K. Hiraki, T. Takahashi, H. M. Yamamoto, and T. Nakamura, Phys. Rev. Lett. 93, 216405 (2004).
- Bourbonnais (1993) C. Bourbonnais, J. Phys. I France 3, 143 (1993).
- Wzietek et al. (1993) P. Wzietek, F. Creuzet, C. Bournonnais, D. Jerome, K. Bechgaard, and P. Batail, J Phys. I France 3, 171 (1993).