Infrared spectroscopy under multi-extreme conditions: Direct observation of pseudo gap formation and collapse in CeSb
Abstract
Infrared reflectivity measurements of CeSb under multi-extreme conditions (low temperatures, high pressures and high magnetic fields) were performed. A pseudo gap structure, which originates from the magnetic band folding effect, responsible for the large enhancement in the electrical resistivity in the single-layered antiferromagnetic structure (AF-1 phase) was found at a pressure of 4 GPa and at temperatures of 35 - 50 K. The optical spectrum of the pseudo gap changes to that of a metallic structure with increasing magnetic field strength and increasing temperature. This change is the result of the magnetic phase transition from the AF-1 phase to other phases as a function of the magnetic field strength and temperature. This result is the first optical observation of the formation and collapse of a pseudo gap under multi-extreme conditions.
pacs:
71.27.+a, 78.20.Ls, 75.30.KzCe monopnictides have many magnetic phases with complex magnetic structures at low temperatures, high pressures and high magnetic fields. ref01 The magnetic moments originate from the localized Ce electron. Direct magnetic exchange interaction between Ce electrons does not occur, but the magnetic interaction mediated by the conduction and valence electrons plays an important role. In the case of CeSb, the interaction is known to be due to the hybridization between the Ce and Sb orbitals, referred to as mixing. ref02
The magnetic properties and magnetic structures of CeSb have been thoroughly investigated by neutron scattering experiments. ref03 ; ref04 However, only a few studies on the modulation of the Sb bands due to the mixing have been performed. In particular, at pressures of several GPa, the electrical resistivity ( several mcm) at around = 30 K increases by one full order over that at ambient pressure (cm). ref05 The origin of this increase is believed to be the strong modulation of the Sb bands. In this Letter, we show that the Sb band modulation can be convincingly confirmed by optical measurements.
The magnetic phase in which the enhancement appears is the single-layered antiferromagnetic (AF-1) phase, which is not present at ambient pressure. The magnetic structure is , where and indicate the magnetic moment direction of the ferromagnetic layer along the magnetic field. The double-layered antiferromagnetic (, AF-1A) phase, which is different from the AF-1 phase, appears at ambient pressure and also at high pressures. The only difference between the AF-1A and AF-1 phases is in their magnetic structures, but in the AF-1A phase (cm) is that of a metallic phase, which is also different from that in the AF-1 phase. Clarification of the difference in the electronic structures of the AF-1 and AF-1A phases and their temperature and magnetic field dependencies is fundamental for understanding the changes in the Sb band due to the different magnetic structure.
Angle-resolved photoemission ref06 ; ref07 and infrared reflection spectroscopy ref08 ; ref09 are employed to observe the electronic structure. The photoemission spectroscopy cannot be performed at high pressures or in the presence of magnetic fields, in which cases infrared spectroscopy is used. Recently, Kimura et al. reported a change in the electronic structure of CeSb due to a change in the magnetic order using infrared reflection spectroscopy and magnetic circular dichroism. ref10 ; ref11 The change in the Sb bands due to mixing in addition to the hybridization between the Sb and Ce orbitals plays an important role in the formation and stabilization of the double-layered magnetic structure. ref12
The electronic structure of CeSb at high pressures has been investigated using infrared spectroscopy in our previous paper. ref13 In the paper, the spectral changes of due to two magnetic phase transition at = 2.5 GPa were observed. However, the dependences of temperature and magnetic field were not performed. In this study, to clearly investigate the electronic structure of CeSb in the AF-1 phase and its temperature and magnetic field dependencies, the higher pressure of 4.0 GPa is applied to the sample to stabilize the AF-1 phase. And then spectra at 4.0 GPa, low temperatures and magnetic fields are investigated. As the results, we found that the formation of the pseudo gap at the Fermi level () due to the magnetic band folding effect and its collapse by temperature and magnetic field in . This is the first ever report involving infrared reflection spectroscopy under multi-extreme conditions.
Single crystalline samples of CeSb were grown by the Bridgman method using a tungsten heater crucible. ref14 A 0.2 0.2 0.05 mm3 sample was set in a diamond anvil cell with Apiezon-N grease as the pressure medium and with a gold film on the sample as a reference. The pressure was calibrated using a ruby fluorescence method. Infrared reflectivity measurements were performed at the magneto-optical imaging station of BL43IR at SPring-8, Hyogo, Japan. ref15 The station is equipped with an infrared microscope, a superconducting magnet, and a cryostat for cooling samples. ref16 The diamond anvil cell was mounted at the sample position. The measurement parameters include the photon energy range of 0.1 - 1 eV, temperatures of 4 - 70 K, magnetic fields of 0 - 14 T and a pressure of 4.00.1 GPa. A laboratorial infrared microscopy system without a magnetic field was also used in the photon energy range of 0.065 - 1.5 eV. To derive the spectra via the Kramers-Kronig analysis (KKA), the obtained infrared spectra were connected to the spectrum in the photon energy region of 1.2 - 200 eV recorded only at room temperature ref11 and were extrapolated using above 200 eV. ref17 In the lower energy region, Hagen-Rubens function (HRF) (, where is the direct current conductivity) was used for the metallic spectra. In the event case that the HRF cannot be connected to the obtained spectra, a constant extrapolation was employed. This situation would not indicate metallic electronic structures. A detailed analysis is shown below.

The temperature dependence of the spectrum at = 4 GPa and = 0 T is shown in Fig. 1(a). At = 10 and 70 K, the spectra are typically metallic because approaches unity with decreasing photon energy. At intermediate temperatures, the spectrum displays a strong temperature dependence. At 30 K, the spectrum changes drastically. Particularly, below 0.2 eV does not approach unity and cannot be fitted by HRF. This means that the metallic character is suppressed at intermediate temperatures.
To clarify the temperature dependence of , the differential intensity () between and is plotted as a function of temperature in Fig. 1(b). This figure indicates that the temperature dependence of is very weak below 20 K and above 60 K. A large jump appears at 30 K and slightly increases with increasing temperature between 35 and 50 K. At around 50 K, smoothly connects to the constant value above 60 K. The two characteristic temperatures shown by the hatched area is in good agreement with the magnetic phase transition temperatures at 4 GPa determined by other methods. ref04 ; ref05 Based on this figure, it is clear the electronic structures in the AF-1A and P phases are almost constant. At the transition temperature from the AF-1A to AF-1 phases, the electronic structure drastically changes. In the AF-1 phase, the electronic structure gradually changes with increasing temperature, eventually reaching the value of that in the P phase. This is consistent with the behavior of the intensity at the sublattice peak indicating the presence of the AF-1 phase magnetic structure detected by neutron scattering. ref03 The magnetic scattering intensity at the sublattice peak as a function of temperature illustrates the second-order nature of the transition from the P to AF-1 phases and the first-order one from the AF-1 to AF-1A phases. This behavior is consistent with the temperature dependence of . This directly provides that the magnetic structure strongly couples to the Sb electronic structure. This same result has been obtained in CeBi at ambient pressure. ref18 CeBi has an AF-1 phase even at ambient pressure. In the CeBi case, the mixing intensity increases with decreasing temperature. CeSb at = 4 GPa gives the same result, indicating the temperature dependent mixing intensity is responsible for the change in .
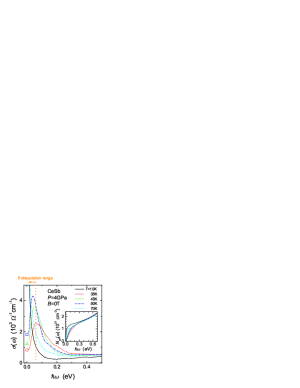
To clarify the change in the electronic structure at = 4 GPa and = 0 T as a function of temperature, derived from the KKA of is shown in Fig. 2. To perform the KKA, the HRF derived from must smoothly connect to at the temperatures below 25 K and above 55 K. The obtained spectra at 10 and 70 K shown in Fig. 2 look like normal metallic ones. However, the HRF derived from does not connect to at the temperatures between 30 and 50 K. This means that the measured spectra are not the tail of the metallic Drude function but a part of low-energy interband transitions like in insulators. So, at = 0.065 eV is extrapolated to the lower energy side as a constant and is connected to the HRF derived from . The absolute value of must contain the physical properties at around this energy. Therefore, the spectrum in the extrapolated region has a qualitative meaning. To evaluate this quantitatively, these measurements in the lower energy region under the same multi-extreme conditions should be performed, which is impossible at present. The spectra derived from the KKA using this extrapolation method are plotted in Fig. 2. The spectrum at 35 K has a peak with a peak energy of 0.065 eV. The peak energy, which originates from both of the absolute value of and , shifts to the lower energy side with increasing temperature. In CeBi, a similar peak appears in the AF-1 phase. ref18 The peak shifts to the low energy side with increasing temperature in the same way as that of CeSb. However, CeBi differs in that it has a metallic spectrum and also a metallic value even in the AF-1 phase. This indicates that the AF-1 phases in both CeSb and CeBi have a gap shape electronic structure in common. However, the gap in CeBi is distant from and that of CeSb is just on . This directly accounts for the different behavior in between these materials.
To investigate the origin of the pseudo gap, the effective electron number () is plotted in the inset of Fig. 2. Here means free electron mass. Based on the figure, the temperature dependence occurs below 0.4 eV. This means that only the electronic structure 0.4 eV below depends on temperature. The energy of 0.4 eV is similar to the mixing energy (0.35 eV, -0.245 eV) of CeSb. ref02 ; ref12 This indicates that the Sb band modified by the Ce spin structure due to the mixing is the origin of the pseudo gap. The enhancement in the electrical resistivity originates from the decrease in the density of states on through the creation of the pseudo gap structure. A similar pseudo gap structure is also observed in cases of pairing due to a charge/spin density wave ref19 , of a lattice distortion due to the Jahn-Teller effect ref20 etc. In the present case, no pairing effect was observed. On the other hand, a very small lattice contraction appears in the magnetically ordered states in the form of a change in the Ce ground state from with a large charge distribution in the P phase to with a small distribution in the AF-1 phase. ref21 ; ref22 However, if the lattice distortion would be the origin of the pseudo gap, the gap structure would remain in the AF-1A phase, as the ground state is common even in the AF-1A phase. Since the difference between the AF-1 and AF-1A phases is only in the alignment of the magnetic moments, the origin of the pseudo gap must be the periodicity of the Ce magnetic moments contained in the Sb band through the mixing. This is referred to as the magnetic band folding effect.
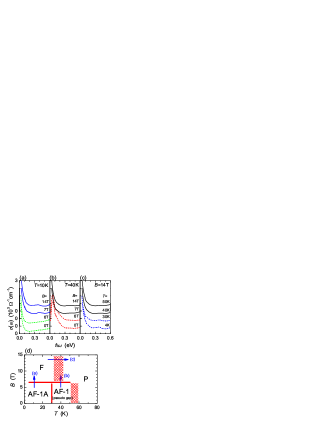
Next, we show an example of a magnetic-field-induced nonmetal-metal transition under a high pressure. Figure 3 indicates the magnetic field dependence of . In Fig. 3(a), the spectrum at = 0 T is equal to that at 6 T. The spectrum at 7 T is different from that at 6 T and is equal to that at 14 T. This indicates that the region below 6 T is all the same phase and that above 7 T is a different one. The phase transition magnetic field is 6.5 0.5 T. The data in Fig. 3(b) indicate the same situation as that in Fig. 3(a). However, the spectrum at = 40 K and = 0 T is different from that at 10 K and 0 T because these magnetic phases are different, as shown in Fig. 1. Since the spectrum at = 10 K and = 14 T is the same as that at ambient pressure, 6.5 K and 6 T for the ferromagnetic (F) phase, ref10 the condition of = 4 GPa, = 10 K and = 14 T is also in the F phase. The transition magnetic field from the AF-1A to F phases shifts from 4.4 T at ambient pressure to 6.5 T at 4 GPa. The reason for this shift is that the mixing increases and stabilizes the double-layered magnetic structure with a decrease in the distance between the Ce and Sb atoms as a result of the applied pressure. At 40 K in Fig. 3(b), the pseudo gap structure appears below = 6 T. The gap structure disappears at 7 T across the transition magnetic field of 6.5 0.5 T, and the spectrum changes to a metallic one. This is an example of a magnetic-field-induced nonmetal-metal transition under a high pressure.
At 0 T, the spectrum drastically changes with temperature because of the magnetic phase transition, as shown in Fig. 2. The same spectral transition at the same transition temperature was observed below 6 T (not shown). Above 7 T, a different spectral change was observed, in which the spectrum displayed a more typical temperature dependence, shown in Fig. 3(c). This temperature dependence indicates that the F phase below 30 K gradually changes to a different phase above 50 K. Since the spectrum above 50 K is the same as that at 70 K and 0 T, as shown in Fig. 2, the higher temperature phase must be the P phase. Based on this, these results indicate the F phase gradually changes to the P phase with increasing temperature in the magnetic field range above 7 T.
The magnetic field - temperature phase diagram at 4 GPa resulting from changes in the spectrum is shown in Fig. 3(d). In the figure, the solid lines and the hatchings are the first-order-like and second-order-like spectral transitions, respectively. The temperature and magnetic field region of the AF-1A phase expands at 4 GPa in comparison with that at ambient pressure. This is the plausible result of the mixing increasing due to the applied pressure. On the other hand, the phase diagram at 4 GPa becomes simpler than that at ambient pressure. In particular, the complex magnetic structure, for example, in AFP () phases at ambient pressure ref01 disappears at 4 GPa. At ambient pressure, since the mixing competes with other magnetic interactions and crystal field splitting, such complex magnetic phases and structures appear. With increasing pressure, the mixing increases and then dominates among these interactions. The increase of the mixing also makes the simpler magnetic phase diagram at 4 GPa.
In summary, infrared reflection spectroscopy on CeSb at low temperatures, high pressures and high magnetic fields was performed. The pseudo gap structure was clearly observed in the AF-1 phase at 4 GPa, as well as the collapse of the gap with increasing magnetic field. The pseudo gap originates from the magnetic band folding effect. CeSb has the necessary electronic structure to create the pseudo gap in the AF-1 phase. CeSb in the AF-1 phase is the model system of the magnetic band folding. This paper indicates the first optical observation of the magnetic field induced nonmetal-metal phase transition at high pressures. The magnetic field - temperature phase diagram of CeSb at 4 GPa was also determined.
We would like to thank to Drs. Kaneta and Sichelschmidt for valuable discussions and also thank SPring-8 BL43IR staff members for their technical support. This work was partially supported by a Grant-in-Aid for Young Scientists (A) (Grant No. 14702011) from MEXT of Japan. The experiments were performed with the approval of the Japan Synchrotron Radiation Research Institute (Proposal Nos. 2003A0076-NS1-np, 2004A0231-NSa-np and 2004B0545-NSa-np).
References
- (1) J. Rossat-Mignod et al., J. Magn. Magn. Mater. 52, 111 (1985).
- (2) H. Takahashi and T. Kasuya, J. Phys. C: Solid State Phys. 18, 2697 (1985); ibid 2709; ibid 2721; ibid 2731; ibid 2745; ibid 2755.
- (3) T. Chattopadhyay et al., Phys. Rev. B 49, 15096 (1994).
- (4) T. Osakabe et al., Acta Phys. Pol. 34, 1469 (2003).
- (5) N. Môri et al., JJAP Series 8, pp. 182 (1993).
- (6) H. Kumigashira et al., Phys. Rev. B 56, 13654 (1997).
- (7) T. Ito et al., Physica B 351, 268 (2004).
- (8) Y. S. Kwon et al., Jpn. J. Appl. Phys. Series 8, pp. 104 (1993).
- (9) F. Salghetti-Drioli et al., Solid State Commun. 109, 687 (1999).
- (10) S. Kimura et al., J. Phys. Soc. Jpn. 69, 647 (2000).
- (11) S. Kimura et al., J. Phys. Soc. Jpn. 71, 2200 (2002).
- (12) F. Ishiyama and O. Sakai, J. Phys. Soc. Jpn. 72, 2071 (2003).
- (13) S. Kimura et al., Physica B, in press.
- (14) T. Suzuki, Jpn. J. Appl. Phys. Series 8. pp. 44 (1993).
- (15) S. Kimura et al., Nucl. Instrum. Meth. A 467-468, 893 (2001).
- (16) S. Kimura et al., Physica B 329-333, 1625 (2003).
- (17) F. Wooten, Optical Properties of Solids (Academic Press, New York, 1972).
- (18) S. Kimura et al., J. Phys. Soc. Jpn. 73, 2041 (2004).
- (19) M. Dressel and G. Grüner, Electrodynamics of Solids (Cambridge University Press, Cambridge, 2002).
- (20) ex.) M. Quijada et al., Phys. Rev. B 58, 16093 (1998).
- (21) K. Iwasa, Y. Arakaki, M. Kohgi and T. Suzuki, J. Phys. Soc. Jpn. 68, 2468 (1999).
- (22) K. Iwasa,A. Hannan, M. Kohgi and T. Suzuki, Phys. Rev. Lett. 88, 207201 (2002).