Comment on “Comparison of the and space groups for the superlattice phase of Pb(Zr0.52Ti0.48)O3”
Abstract
The two-phase (space groups and ) structural model recently proposed for the modeling of the neutron powder diffaction pattern collected on Pb(ZrxTi1-x)O3 (PZT) sample with [R. Ranjan, A. K. Singh, Ragini, and D. Pandey. Phys. Rev. B 71, 092101 (2005)] is shown to neglect the dependent (anisotropic) line broadening. The most serious problem with this model is that it assigns octahedral tilts to a wrong phase. Instead of correctly taking the anisotropic line broadening into account, this model used low symmetry phases to minimize the residuals during Rietveld refinement. The essential features of a model taking the dependent line broadening into account are summarized. It has already been reported that once the anisotropic line broadening, revealed by high resolution neutron powder diffraction instrument, is correctly taken into account the model with and space group symmetries describes all Bragg peaks and their intensities well [J. Frantti, S. Eriksson, S. Hull, V. Lantto, H. Rundlöf, and M. Kakihana. J. Phys.: Condens. Matter 15, 6031 (2003).]. It was further shown that the model is consistent with the structural features observed at other compositions and temperatures, which is particularly important in the vicinity of the phase boundary. Also problems related to sample preparation and data collection are pointed out.
pacs:
77.84.Dy 61.12.Ld 61.50.Ah 81.30.DzRecently, based on previously published neutron powder diffraction data Ranjan3 ; Hatch , a model which used two monoclinic phases (space group symmetries and ) was proposed to describe the structure of Pb(ZrxTi1-x)O3 (PZT) with Ranjan . This model assigned a space group symmetries (at room temperature) or (at low temperature) to the phase which was assigned to symmetry in refs. Noheda, and FranttiPRB, . In addition, the phase, which traditionally has been assigned to the rhombohedral symmetry, was assigned to symmetry. To understand the problems related to such a model and the reason why the use of space group was previously rejected FranttiPRB it is necessary to summarize the crucial role of the dependent line broadening for Rietveld refinement in the case of these materials. There is a high risk that erroneous space group symmetry assignments result in once this line broadening is compensated for by reducing the space group symmetry. For example, one can make the difference between measured and calculated diffraction intensities arbitrarily small by simply using space group and increasing the primitive cell size until the difference vanishes below the desired value. In our opinion, a structure model which reduces the symmetries to ’model’ the dependent line broadening takes the disorder into account in a wrong way, since in this way the disorder is assigned to be a periodical disturbance extending through the crystal, obeying the space group symmetry. However, the -dependent line broadening is an inherent property of PZT powders, and is already seen in tetragonal Ti rich compositions. The same behaviour was observed in a closely related Pb(HfxTi1-x)O3 (PHT) system with , where the peak widths of the reflections were twice as large as the widths of reflectionsFranttiSub . It must be emphasized that no signs of symmetry lowering from the symmetry was observed in this high- resolution neutron powder diffraction study. Light scattering experiments revealed that both in the case of PZT and PHT samples deviations from the average symmetry were observed FranttiPRB2 ; FranttiJJAP2 ; FranttiBoston . Although one could decrease the average symmetry to take these observations into account, a more realistic model is to assume that the average symmetry over a length scale of a few hundred nanometers is , and deviations from this symmetry occur in a local scale (of a few unit cells). The essential point here, too, is that these deviations are not periodical! It is also important to note that the phase was identified by studying the peak split of the pseudo-cubic reflections Noheda . This peak split was beyond the resolution of the instrument used in ref. Ranjan, and there is no way to recover the lost information. It does not matter how many ’new’ refinements are carried out for the low-resolution data collected with insufficient counting time (note that neutron powder diffraction data in refs. Ranjan3, ; Hatch, and Ranjan, are the same). To solve the problem related to average symmetries it is necessary to carry out experiments with an appropriate instrument and carefully prepared sample. The role of the spatial composition variation (which in practice cannot be eliminated) in the vicinity of the phase boundary is an old and still a valid explanation for the two phase ’co-existences’ and also partially explains the -dependent line broadening. It was also worth of trying to find a simple model which is consistent with other compositions and temperaturesFranttiPRB ; FranttiJPCM . These aspects are shortly reviewed below.
Spatial composition variation.
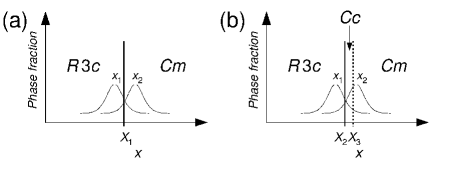
Traditionally, the two-phase ’co-existence’, observed in room temperature PZT in the vicinity of the morphotropic phase boundary (MPB), has been explained by the composition variation. In the context of low temperature symmetries the role of spatial composition variation was discussed in refs. FranttiPRB, and FranttiJPCM, . The crystal symmetry of Zr rich PZT ceramics is Michel ; Corker ; FranttiJPCM , except for the compositions with . Since spatial composition variation cannot be completely eliminated, there must exist two phases in the vicinity of MPB. To allow the existence of phase necessitates that there should be a narrow region in the plane were this phase is stable or metastable. Now, if we were to explain the existence of phase, two phase boundaries located somewhere between should be assumed to exists, see Fig. 1 (b). This in turn, once the spatial composition variation is taken into account, leads to three phase ’co-existence’. We preferred the simplest model (corresponding to Fig. 1 (a)), since it was able to explain the experimental observations in simplest terms. At low temperature (4 KFranttiJPCM or 10 K FranttiPRB ) the phase fraction of the phase was monotonically decreasing with increasing from to , which in turn implies that two-phase ’co-existence’ is predominantly due to the spatial composition variation. Other factors include stresses, which probably exist in the grain boundaries.
It is worth to point out that the model proposed in ref. Ranjan, was ruled out also in a recent paper, see the last paragraph in ref. Cox, . After all, the only difference between our model and the model proposed in ref. Cox, is that we used symmetry (corresponding to two lattice parameters and four atomic coordinates), while they used symmetry (corresponding to four lattice parameters and twelve atomic coordinates, if constraints are not used), a subgroup of space group. Thus, the model proposed by us and the model proposed in ref. Cox, assigned octahedral tilts (evidenced by superlattice reflections) to the same phase. Octahedral tilts are crucial once the structural changes versus temperature, composition or pressure are studied. Somewhat surprisingly, the space group symmetries of the two phases were rather arbitrarily interchanged in refs. Ranjan, and Ranjan2, . This model immediately runs into trouble, as the octahedral tilts are assigned to a wrong phase, see below.
In addition, there have been reports claiming that dielectric measurements support phase (for example, see ref. Ranjan3, ). In this context we note that the samples studied in refs. Ranjan, and Ranjan2, contained a nonidentified impurity phase(s), as was revealed by the peaks at around 28 and 35 two-theta degrees (corresponding to spacings 3.18 Å and 2.56 Å, respectively). This implies that the composition was not well known and there is no way to avoid compositional and structural inhomogeneities. Although this non-perovskite phase was clearly observable, it was neglected in the Rietveld refinement model considered in ref. Ranjan2, , which in turn results in an error in the structural parameters of the perovskite phase(s). This is related to the fact that the diffraction pattern shown in ref. Ranjan2, (reported to have ) is reminiscent to our diffraction pattern with . In contrast, our diffraction pattern with (see ref. FranttiJJAP, ) and the diffraction pattern of the sample reported in refs. Cox, and Noheda, were reminiscent. It should also be understood that dielectric measurements do not suit for a space group determination. Although the dielectric measurements can provide valuable information in the case of single phase samples, particular care is necessary once multiphase samples are studied. Anomalies observed in a dielectric constant versus temperature measured from a two or three phase ceramic bulk samples (see ref. Ragini3, ) do not provide reliable evidence that one of the phases has undergone a phase transition from to phase.
Anisotropic line broadening.
The anisotropic line broadening was ascribed to the spatial composition variation resulting in ’microstrain’ (i.e., Zr substitution for Ti creates local strains which in turn contributes to the dependent line broadening)FranttiJPCM . In addition, rather strong diffuse scattering is commonly observed between the and Bragg reflections, which was assigned to Pb ions displaced toward directions. This latter feature is somewhat puzzling, as it adds intensity to certain diffraction peaks, which results in an asymmetric profile. For example, the larger and smaller -spacings sides of the pseudo-cubic and reflections, respectively, gain intensity. In ref. Ranjan, phase was practically used to model the intensity not only due to the crystalline phase, but also due to the diffuse scattering and due to the main crystalline phase. Despite the increased number of refined parameters, the residuals were still rather high and the differences between different models compared were marginal (for instance, was lowest for the model which was rejected in ref. Ranjan, ).
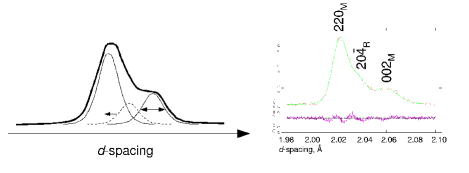
Although a reasonable structure refinement for medium resolution data collected on PZT samples with could be obtained using a lineshape which ignores anisotropic line broadening, the situation was quite different for high resolution facilities, particularly once the data was collected on two phase samples (the present case). In such a case it was essential to use an appropriate profile function. Now, if the anisotropic line broadening is neglected, the fit in the case of certain weak peaks becomes slightly worse (as was observed to be the case of weak superlattice reflections, which are less weighted in the refinements). The reason for this is illustrated in Fig. 2: in order to improve the fit corresponding to the strong pseudo-cubic reflections, during the refinement the position of reflection is shifted toward higher -spacings, which in turn resulted in a small shift of the weak peaks at 2.44 and 1.06 Å (in a case of the data shown in ref. Ranjan, the latter peak was almost at the level of noise and the model assigns more reflections than there are data points in this region). The anisotropic line broadening was not limited to the -spacing at around 2 Å, and similar mechanism was seen at other -spacings.
Previous high resolution neutron powder diffraction results.
The anisotropic line broadening was the reason to carry out a subsequent study using a high resolution neutron powder diffraction instrument (which reveals the anisotropic line broadening particularly clearly and allows a distinction between average symmetry lowering and a defect related anisotropic line broadening to be done, in contrast to the low- or medium resolution constant wavelength neutron diffraction facilities)FranttiJPCM . In addition, we increased Zr content, FranttiJPCM (although it definitely was possible to fit all reflections using the model also in the case of and samples). This allowed a more reliable refinement and symmetry identification to be done by studying the changes in phase fractions versus temperature. Importantly, for these compositions it has been found that oxygen octahedra tilts increase with increasing (ref. Corker, ) and decreasing temperature (this feature is discussed in refs. Thomas, and FranttiPRB, ). We also note that previously was proposed to be space group symmetry corresponding to high isotropic pressureHaines , whereas our work was concentrating on the determination of space group symmetries versus composition and temperature at ambient pressure. Now, PZT sample with provided a test for clarifying which phase is the preferred one at low temperature. To model the peak profiles, GSASGSAS lineshape 4 by Stephens Stephens was used. As was seen in ref. FranttiJPCM, , once the crystal contracts with decreasing temperature the phase was favoured (and phase did not transform to phase, as one could expect from the model proposed in ref. Ranjan, ). Thus, when the oxygen octahedra had almost no chance to contract, they were tilt towards opposite directions along the pseudo-cubic axis (tilt system ). This tilt results in a decrease of the volume of cuboctahedra around Pb ions. Changes evidencing symmetry (and the corresponding tilt system) were not observed. Indeed, the phase fraction of phase (which was assigned to symmetry in ref. Ranjan, ) decreased with decreasing temperature, whereas phase fraction significantly increased with decreasing temperature. This can be confirmed even by a naked eye, although the results of refinements were also given. The intensity of the peak at around 1.06 Å was increasing with decreasing temperature, which further confirmed that its origin is the phase assigned to phase. Also the peak at around 1.06 Å was well fit by symmetry.
As a summary, we do not find support for model proposed in ref. Ranjan, . Instead, we still consider that provides a sufficient low temperature structural model for PZT with composition in the vicinity of the morphotropic phase boundary.
References
- (1) R. Ranjan, S. K. Mishra, D. Pandey and K. Kennedy. Phys. Rev. B 65, 060102 (2002).
- (2) D. M. Hatch, H. T. Stokes, R. Ranjan, Ragini, S. K. Mishra, D. Pandey, and B. J. Kennedy, Phys. Rev. B 65, 212101 (2002).
- (3) R. Ranjan, A. K. Singh, Ragini, and D. Pandey. Phys. Rev. B 71, 092101 (2005).
- (4) B. Noheda, D. E. Cox, G. Shirane, J. A. Gonzalo, L. E. Cross and S-E. Park. Appl. Phys. Lett. 74, 2059 (1999); B. Noheda, J. A. Gonzalo, L. E. Cross, R. Guo, S-E. Park, D. E. Cox, and G. Shirane. Phys. Rev. B 61, 8687 (2000).
- (5) J. Frantti, S. Ivanov, S. Eriksson, H. Rundlöf, V. Lantto, J. Lappalainen, and M. Kakihana. Phys. Rev. B 66, 064108 (2002).
- (6) J. Frantti, Y. Fujioka, S. Eriksson, S. Hull and M. Kakihana. Neutron powder diffraction study of Pb(HfxTi1-x)O3 ceramics (), submitted.
- (7) J. Frantti, V. Lantto, S. Nishio and M. Kakihana. Phys. Rev. B 59, 12 (1999).
- (8) J. Frantti, J. Lappalainen, S. Eriksson, V. Lantto, S. Nishio, M. Kakihana, S. Ivanov, and H. Rundlöf. Jpn. J. Appl. Phys. 38, 5679 (1999).
- (9) J. Frantti, Y. Fujioka, S. Eriksson, V. Lantto, and M. Kakihana. Journal of Electroceramics 13, 299 (2004).
- (10) Ragini, R. Ranjan, S. K. Mishra, and D. Pandey, J. Appl. Phys. 92, 3266 (2002).
- (11) J. Frantti, J. Lappalainen, S. Eriksson, V. Lantto, S. Nishio, M. Kakihana, S. Ivanov, and H. Rundlöf. Jpn. J. Appl. Phys. 39, 5697 (2000).
- (12) J. Frantti, S. Eriksson, S. Hull, V. Lantto, H. Rundlöf, and M. Kakihana. J. Phys.: Condens. Matter 15, 6031 (2003).
- (13) C. Michel, J. M. Moreau, G. D. Achenbach, R. Gerson, and W. J. James, Solid State Commun. 7, 865 (1969).
- (14) D. L. Corker, A. M. Glazer, R. W. Whatmore, A. Stallard, and F. Fauth. J. Phys. Condens. Matter 10, 6251 (1998).
- (15) D. E. Cox, B. Noheda, and G. Shirane. Phys. Rev. B 71, 134110 (2005).
- (16) J. Rouquette, J. Haines, V. Bornand, M. Pintard, Ph. Papet, W. G. Marshall, and S. Hull. Phys. Rev. B 71, 024112 (2005).
- (17) Ragini, S. K. Mishra, D. Pandey, H. Lemmens, and G. Van Tendeloo. Phys. Rev. B 64, 054101 (2001).
- (18) N. W. Thomas and A. Beitollahi. Acta Crystallorg., Sect. B: Struct. Sci. 50, 549 (1994).
- (19) A. C. Larson and R. B. Von Dreele General Structure Analysis System, LANSCE MS-H805, Los Alamos National Laboratory, Los Alamos, NM 87545 (2000).
- (20) P. W. Stephens. J. Appl. Crystallogr. 32 281 (1999).